Chapter 10
Improving Your Marketing Strategy with Facebook Insights
IN THIS CHAPTER
 Using Facebook Insights as your GPS for success
Knowing what to measure based on your goals
Downloading data for deeper analysis
Using third-party analytic tools
Facebook Insights is an analytics tool for your Page that helps you make better marketing decisions with Facebook. It shows you what your fans like to talk about so that you can publish content that continues to engage them. Insights also helps you spend your Facebook advertising dollars more wisely by targeting Facebook users who are similar to your most engaged fans.
Most important, Insights helps you discover the strategies that work for your specific Facebook Page community. These strategies are better than any you’d get from relying on your gut or, worse, the best practices you read on some blog.
In this sense, Facebook Insights is your personal GPS for your Facebook Page, telling you exactly what you need to do to arrive at your destination. The destination, of course, is each marketing campaign objective.
In this chapter, we show you how to improve your Page by using the information Facebook Insights provides. We explain what the metrics are and how to use them to reach your goals. We also offer tips on how to integrate third-party analytics into your Page.
Getting Analytical with Facebook Insights
As you proceed with your Facebook marketing journey, you begin to get a sense of what’s working and what isn’t working. You see that some of your Page updates get a lot of Likes and comments, while others get only crickets.
Based on these simple observations, you’ll get hunches about what kind of Page stories work, and you may eventually get better at posting stories that effectively engage your fans.
Although this type of nonanalytical analysis — thinking with your gut — is an effective way for beginners to see how Facebook users respond to content, it doesn’t provide the data you need to be truly successful as a Facebook marketer. The following list, for example, includes some questions you won’t be able to answer with your gut:
- What were the most engaging updates within a specific period?
- Do your fans prefer videos or photos?
- How many times are you reaching fans each week?
- What other websites sent traffic to your Facebook Page?
- How many fans hid your Page stories on their News Feeds?
We’re not saying you shouldn’t listen to your intuition, because we both know that following your gut can give you great information. Confirming your intuition with statistics, however, is just smart business.
Additionally, with Insights you can identify trends within your Facebook Page — such as where most of your engaged users are located, their ages, and their genders — that you’d never see by scrolling down your Page. Understanding trends helps you adjust your content strategy based on what’s really working instead of basing it on best guesses and random shots in the dark. Additionally, this information can help you target Facebook Ads much more effectively.
Using Facebook Insights
The next few sections show you how to access and use Facebook Insights.
 Keep in mind that only Page admins (all roles) can access Insights.
Understanding the two types of Likes your Facebook Page receives
Before you dive into analyzing how effective your Facebook Page efforts are, you need to understand that your Facebook Page can have two types of Likes:
- People liking your Page by becoming fans or connections of your Page. Facebook users can Like (become a fan by clicking the Like button) and Unlike your Page.
- People liking your content by clicking Like after reading a specific post or Page story that you publish. Facebook users can also stop a single story or all stories from your Page from appearing in their News Feeds.
Accessing Page Insights
You can access Facebook Page Insights in three ways:
- Directly on the Page: To access Facebook Insights, log in and then click the Insights link on the admin navigation bar at the top of your Facebook Page (shown in Figure 10-1).
- From the Facebook Insights web page: If you manage more than one Page, you can bookmark the All Pages screen — where all your Pages are listed — for future reference (see Figure 10-2). Go to
https://www.facebook.com/insightsand select the Page you’d like to analyze. - From the Pages Manager app: If you use the Facebook Pages Manager app (for Android and iOS), you have access to a scaled-down version of Insights right within your mobile device (see Figure 10-3).
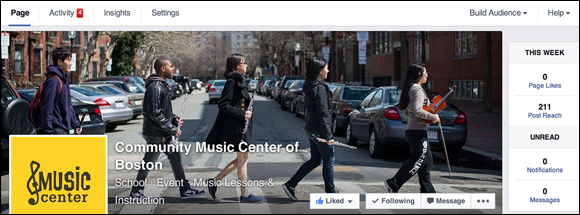
FIGURE 10-1: Access Insights on the admin navigation bar of your Page.
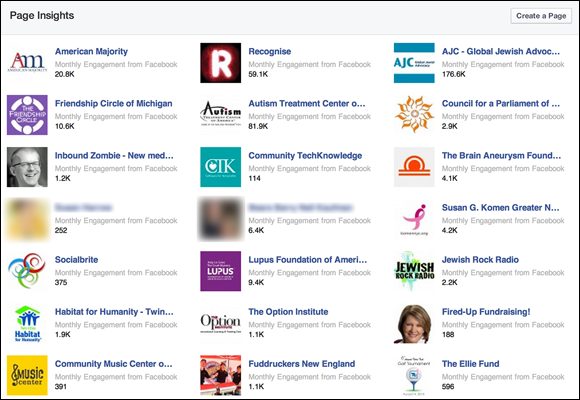
FIGURE 10-2: Access Insights on the Facebook website.
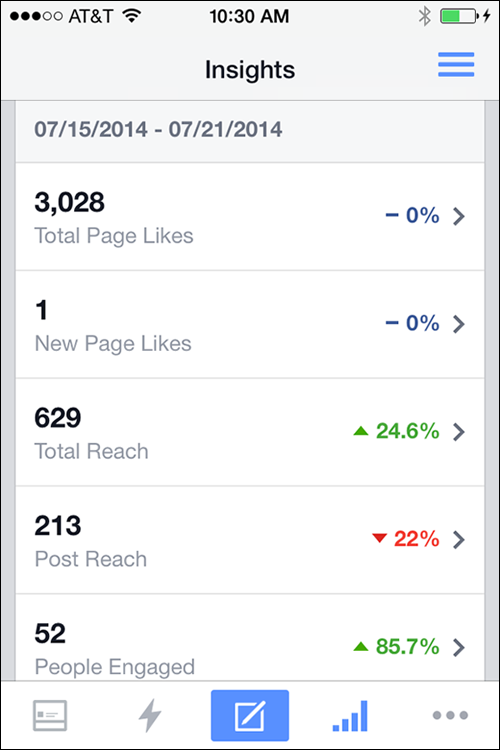
FIGURE 10-3: Access Insights on your mobile device with the Facebook Pages Manager app.
Exploring Facebook Page Insights
Facebook Insights provides critical data about activity on your Page, such as people liking your Page, and about activity related to your Page updates, such as when users comment on or like one of your Page updates.
Facebook Insights displays data on 15 tabs:
The tabs you see may be different depending on the category you chose for your business Page.
- Overview: An overview of how your Page is performing day to day.
- Promotions: This report shows you how well each of your ads performed including boosted posts and other types.
- Followers: A report that shows you the net followers of your page that week and where the follow occurred.
- Likes: Reports about the Facebook users who like your Page.
- Reach: A report about the Facebook users who see your Page content.
- Page Views: This report provides details about how many times people viewed your Page.
- Page Previews: A report that tells you the amount of times someone hovered over your Page or other content but didn’t click.
- Actions on Page: A report about the different things your followers did on your pages, for example, how many clicked an action button.
- Posts: A report about how Facebook users are engaging with your Facebook Page updates.
- Events: Details about the number of people you reached at your events.
- Videos: A report about how your videos are performing.
- People: Demographic reports on the people you reach, the people who like your page, and the people who engage with your content.
- Local: This report tells you what happened in the area around your business.
- Shop: If you have an online shop, you can see a report about your sales.
- Messages: A report about the conversations you’ve had with your fans on Messenger.
In the next few sections, we discuss these tabs in greater detail.
Understanding the Overview Report
The Overview report is the first tab you see when you click Insights. This report shows the Actions on your Page, total Page Likes (fans) that you’ve acquired over the past week, how many people saw your posts or previewed them over the past week, how many people engaged with your updates over the previous seven days, and several other measures, detailed below. You can see stats about your most recent posts and promotions, as well as stats about other Pages you watch, which allows you to compare the performance of your Page and posts with similar Pages on Facebook.
The default date range for the Overview report is a seven-day period ending with the present date, as shown in Figure 10-4.
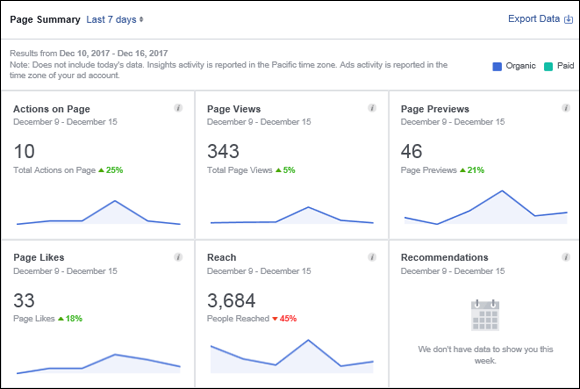
FIGURE 10-4: The top of the Overview report.
The following list goes over the various parts of this report in detail:
- Actions on Page: This section shows you the number of clicks you received from your contact info and call to action button.
- Page Views: The Page Views section shows you how often people viewed your page when they were logged in and logged out.
- Page Previews: This section shows you the number of times people previewed your Page content by hovering over your Page name or profile.
- Page Likes: The Pages Likes section shows the total number of people who like your Facebook Page and the percentage increase or decrease of this number compared with the previous week. An increase is shown in green; a decrease is shown in red.
- Reach: This section shows the number of people who saw any content associated with your Page (including any Ads or Sponsored Stories pointing to your Page) over the past seven days. The percentage to the right of this number is the increase (green) or decrease (red) over the past week.
- Recommendations: The Recommendations section shows how many times your Page was recommended by others.
- Post Engagements: This section details how people have interacted with your Posts, including likes and shares.
- Videos: The videos section shows how many times that users viewed videos for more than three seconds.
- Page Followers: This section details the actions of new followers.
- Recent Promotions: The Recent Promotions section shows you how each of your current promotions has performed.
- Your 5 Most Recent Posts: This section shows you statistics on your five most recently published updates. We discuss these stats in greater detail in the section titled “Evaluating Posts with the Posts Report,” later in this chapter, but for now, just know that the data in this report covers reach and engagement for your five most recent posts.
- Pages to Watch: This section shows you how the Pages you watch are performing. You can select any page to add to this list. Simply click the Add Pages button and search for the Facebook Page that you want to include in your “Pages to Watch.”
Note: Each summary section within the Overview report allows you to click through to each full report to see more comprehensive data.
 Although the Overview report lacks the data you need for a comprehensive analysis of your Facebook marketing, it provides a great deal of useful data. Checking it each day allows you to see quickly whether your audience and its level of engagement is growing or shrinking.
Promoting Your Message by Using the Promotions Report
The Promotions report shows you the performance of the ads you created. To view the Promotions report, click the Promotions tab within Facebook Insights (see Figure 10-5).
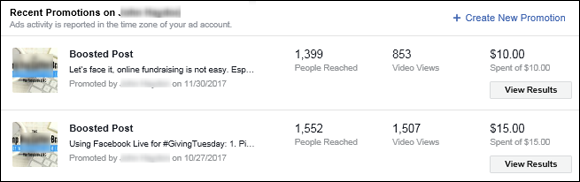
FIGURE 10-5: The Recent Promotions list.
The various parts of the Promotions report detailed in Figure 10-5 are as follows:
- People reached: This part of the report shows the number of people who saw your ad.
- Videos viewed: If you are using videos in your promotions, you see the number of people who watched them.
- Budget: This shows you how much of the budget that you set was spent for this promotion.
If you click the View Results button to the right of each ad, a screen pops up, as shown in Figure 10-6.
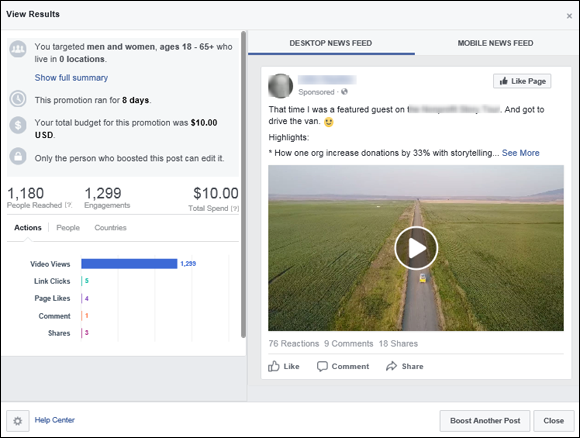
FIGURE 10-6: The View Results pop-up screen for a promotion.
On the View Results screen, in addition to the information you saw on the previous Promotions screen, you see the demographics that you targeted (gender, age, and location) and the length of the promotion. Also, you can choose to view your results when viewers looked at your promotion from their Desktop News Feed or Mobile News Feed.
Evaluating the performance of your ads helps you determine such things as
- Demographics: How well you have targeted the specific audience who is interested in your content
- Desktop and Mobile Feed: On which devices your audience is viewing your content
- Video: Whether the videos you are displaying have content that resonates with your fans, and whether they like the video format
Understanding Your Followers with the Followers Report
The Followers report shows you the number of followers you obtained within a specific date range. You can select a custom range to analyze, or choose one of three predefined segments of time: one week, one month, or one quarter.
To view the Followers report, click the Followers tab within Facebook Insights (see Figure 10-7), which also shows you the Total Page Followers As of Today. This graph gives you a big-picture look at the followers you have gained over the most recent period. You can assess whether your current strategies are successful.
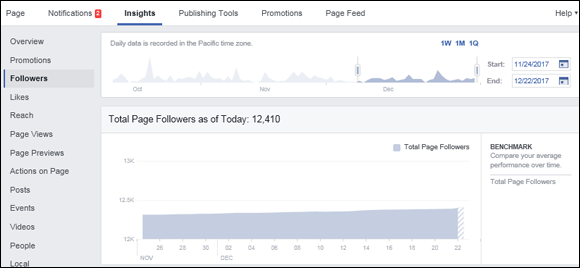
FIGURE 10-7: The Followers report tells you specifics about the followers you are acquiring.
The Followers report also shows you:
-
Net Followers: Here you see a breakdown of the Unfollows, Organic followers, and Page followers so that you can evaluate such things as whether your paid advertising is effective and how may followers you are losing.
The term Organic Follower refers to someone who sees and likes your content whom you did not reach via an ad or other paid content.Notice that for each of the measures for Followers, you can choose to compare your average stats over time using the Benchmark tool on the right side of the chart (refer to Figure 10-7). This tool helps you see how well you are growing your audience so that you can adjust your choices.
- Where Your Page Followers Happened: This chart shows you how often your Page was followed and where it happened. The venues tracked are Uncategorized Desktop; On your Page; Page Suggestions; and Search.
Using the Likes Report for Smarter Fan Acquisition
The Likes report shows your fan growth, as well as the locations from which Facebook users have liked your Page (that is, from the News Feed or another source).
To view the Likes report (see Figure 10-8), click Insights on the navigation bar and then click the Likes tab.
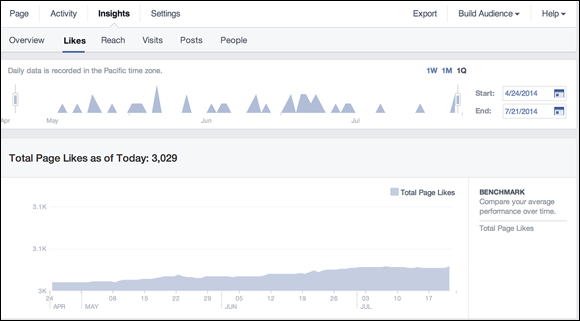
FIGURE 10-8: The Likes report allows you to analyze how you’re acquiring fans.
At the top of the Likes report, you can select the date range for the report. Select a custom range to analyze, or choose one of three predefined segments of time: one week, one month, or one quarter.
Make sure that you select a period before and after any changes you’ve made in your strategy. This way, you can see whether the strategy is working. If your campaign starts on July 1, for example, make sure that you include data from June in this report so that you can compare your fan-acquisition strategy in July with your fan-acquisition strategy in June.
The Followers, Page Views, Page Previews, Actions on Page, Shop tab, and Reach tab also include this feature for customizing the date range.
The following list gives you a deeper look at the various sections of the Likes report:
-
Total Page Likes As of Today: Immediately below the date-selection tool is the Total Page Likes As of Today section, which shows you the running total of accumulated likes over the periods you selected.
To the right, you can compare your average growth this period with your average growth in the previous period. You can see this benchmark data simply by clicking the Total Page Likes link below Benchmark.
-
Net Likes: What Changed: In addition to seeing fan growth, Facebook shows you how many people have unliked your Page, how many people have liked your Page from an ad, and the resulting net Likes, as shown in Figure 10-9.
You can also benchmark Unlikes, Organic Likes (acquired without ads), and Paid Likes (acquired with ads).
Often, you can discover your best fan-acquisition strategies by paying attention to the peaks in this graph for organic and paid Likes. These spikes indicate successful strategies and tactics you’ve already employed to acquire Facebook fans. Repeat these strategies as long as they continue to work. - Where Your Page Likes Came From: The last section of the Likes report, Where Your Page Likes Came From, shows you the sources of your new fans. The graph shown in Figure 10-10 shows you the sources of the fans you acquired in the selected date range.

FIGURE 10-9: The Net Likes report shows you fan acquisition from ads and organic Likes, as well as the number of people who unliked your Page.
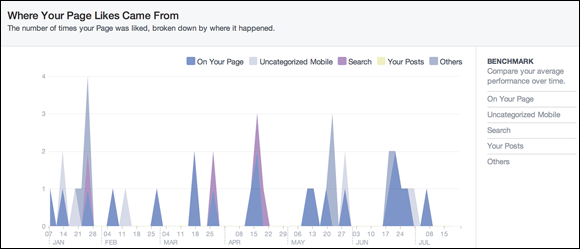
FIGURE 10-10: The Likes report shows you fan acquisition (and attrition) and how people are liking your Page.
Reaching Fans with the Reach Report
Facebook defines reach as the number of people your post was displayed to. Facebook users see your Page posts in three ways:
- Organic reach: When someone visits your Page or sees a post from your page in the News Feed, he’s reaching your Page organically.
- Paid reach: When someone sees your updates because you paid for her to see it, you’re getting paid reach. Paid reach, of course, is generated with Facebook Ads and Boosted Posts.
- Viral reach: When people like, comment, and share your Facebook Page updates, their friends see that activity in their News Feeds. This type of reach is called viral reach.
The Reach report within Facebook Insights shows you how many people you’ve reached with your Facebook marketing efforts.
To view the Reach report, click Insights and then click the Reach tab (see Figure 10-11). The Reach report shows the number of unique Facebook users who viewed your Page stories, Events related to your Page, and Ads promoting your Page or its posts.

FIGURE 10-11: The Reach report shows you how people see your Page updates.
As with the Likes report, you can adjust the date range at the top of the Reach report.
Again, reach means the number of individual people who saw your content. Four sections are available on the Reach tab:
-
Post Reach: This section shows you how many people saw your Page updates in News Feed, on your Page, or in a Facebook Ad. The graph shows two types of reach:
- Organic: Shows the number of unique Facebook users who saw content related to your Page in News Feeds, in the ticker, or on your Facebook Page.
- Paid: Shows the number of unique Facebook users who saw a Facebook Ad or Boosted Post for a Page Post.
You can also view how your current reach compares with your reach during the previous period (see Figure 10-12), which is extremely valuable because it serves as an important alert to optimize or adjust your marketing strategy.
- Recommendations: Displays the number of times your Page was recommended in posts and comments.
-
Reactions, Comments, Shares, and More: This section shows you the rate of reactions, comments, shares, and more over the selected period. As in the Post Reach section, you can compare your current performance with performance in the previous period.
Benchmarking comments and shares can help you discover ways to create more viral reach through comments and shares.
- Reactions: This section shows you how people reacted to your Page Posts.
-
Hide, Report as Spam, and Unlikes: All Facebook users can give Facebook feedback about the content they see in their News Feeds. This section shows you the rate of people hiding, reporting, marking your content as spam, and unliking your Page.
You can also benchmark (compare the current period with the previous period) Hides, Report as Spam, and Unlikes for your Page content.
-
Total Reach: This section is similar to the Post Reach section in that it compares paid and organic reach. But Total Reach includes any activity on your Page, including posts, posts by other people, mentions, check-ins, and any posts you promote with Facebook Ads.
Check-ins on Facebook are a way for users to tell their friends and the Page what their location is. When you check in on a Page, a list of nearby locations pops up, and you can choose the one that matches yours.
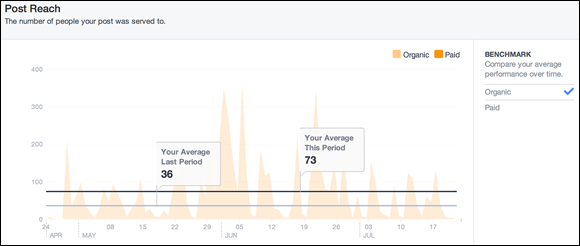
FIGURE 10-12: The Post Reach report allows you to compare your current reach with the previous period’s reach.
Delving into Engagement with the Page Views Report
The Page Views report shows you the total number of views your Page received broken out by your Page sections, demographics, and source within a specific date range. You can select a custom range to analyze, or choose one of three predefined segments of time: one week, one month, or one quarter.
To view the Page Views report, click the Page Views tab within Facebook Insights, as shown in Figure 10-13. In this figure, you see the total number of views your Page received and a By Section tab that contains additional data broken out by views of your Home page, Posts, Videos: Other, Jobs and Live Videos.
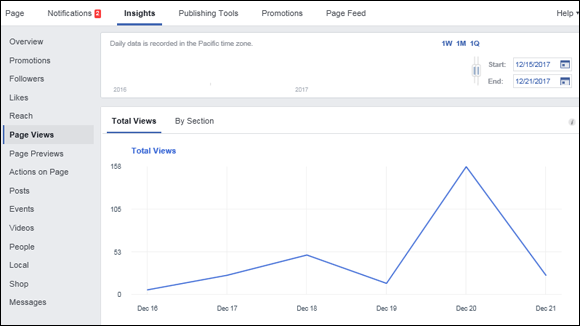
FIGURE 10-13: The Total Page Views graph with the By Section tab.
Your categories may be different depending on the type of business you selected.
This report also shows the total number of people who viewed your Page and tabs, including by
- Section: Which tab on your page they clicked
- Age and gender: An aggregate of their age by gender
- Country: Where they are located
- City: What city they are in
- Device: The device on which they viewed the page
This report also shows the Top Sources, which are the major platforms that sent traffic in the form of views. In this case, Facebook, Google.ca, and Google.com are the ones.
The Page Views information is extremely useful because you can not only see where your views occurred but also learn the demographic makeup of those fans and what venue they were sent from. This helps you determine whether your content is getting attention.
Using the Page Previews Report to Evaluate Interactions
The Page Previews report shows you the total number of Page Previews you received and the total number of people who previewed them within a specific date range. You can select a custom range to analyze, or choose one of three predefined segments of time: one week, one month, or one quarter.
To view the Page Previews report, click the Page Previews tab within Facebook Insights (see Figure 10-14). In this figure, you also see the total number of Page Previews.
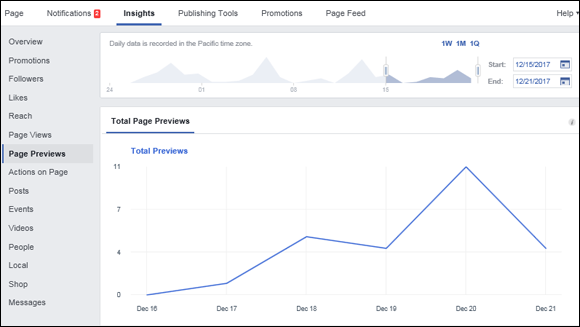
FIGURE 10-14: The total number of Page Previews and the number of people who previewed them.
Next you see the total number of people who previewed the page and, using the By Age and Gender link next to it, you see the breakdown by age and gender.
Monitoring Actions on Page Report
The Actions on Page report is very robust and shows the total number of actions people take on your Page. You also see a breakdown of the kinds of actions people take on your Page within a specific date range. You can select a custom range to analyze, or choose one of three predefined segments of time: one week, one month, or one quarter.
To view the Actions on Page report, click the Actions on Page tab within Facebook Insights, as shown in Figure 10-15. In this figure, you also see the Total Actions on Page and tabs that contain additional data for people who clicked Get Directions, your website, your phone number, and the Action button.
- People Who Clicked Action Button: This graph shows you what people did when they saw your call to action (CTA) button. This is important because it tells you whether the message on the Action button is compelling enough to click. These clicks are broken down by age and gender, by country, by city, and by devices. This helpful chart shows you the demographics of the people taking action to communicate with you. You also see whether they are using mobile or desktop devices.
- People Who Clicked Get Directions: These clicks (see Figure 10-16) tell you the number of people who wanted to get directions to your event or business. This indicates that they are very interested in learning more about you and possibly becoming a customer.
- People Who Clicked Phone Number: This shows you the number of people who wanted to know your phone number. Your assumption would be that if they wanted your phone number, they intended to communicate with you.
- People Who Clicked Website: These click links tells you the number of people who were sufficiently interested in your content to visit your website.
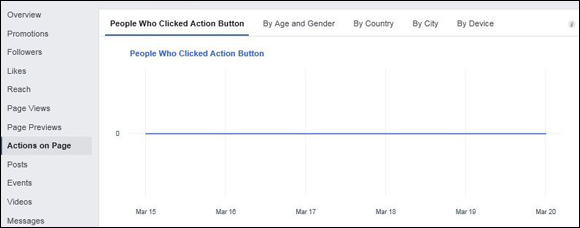
FIGURE 10-15: The Actions on Page report tells you what people did when they visited your Page.

FIGURE 10-16: The number of people who clicked Get Directions.
Evaluating Posts with the Posts Report
The Posts report shows you the ways that Facebook users have engaged with each post, when your fans are online, and how each type of post (image, status update, and so on) performs.
To view the Posts report, click the Posts tab within Facebook Insights (see Figure 10-17).
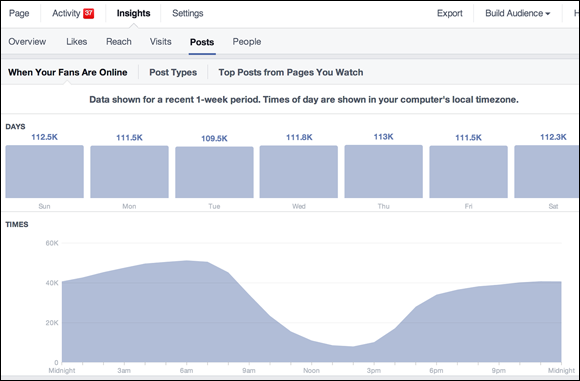
FIGURE 10-17: The Posts report shows you how Facebook users engage with your posts.
At the top of the Posts report are three tabs that contain additional data:
- When Your Fans Are Online: This tab shows you how many Page fans are online for each day during the most recent week and for each hour of the day. You can view the hours for a specific day by mousing over that day of the week at the top of this tab. If you want to increase engagement with your fans, post your updates during the peak times shown on this tab.
-
Post Types: If you want to know how photos, videos, status updates, and links perform, you’ll love this tab. It shows you average reach and engagement for photos, status updates, videos, and links (see Figure 10-18). Post types include link clicks, photo views, video plays, in addition to likes, comments, and shares.
If you want to increase engagement and reach for your Page updates, publish more types of posts that get the most likes, comments, and shares. Based on the data in Figure 10-18, for example, you should post more photos to get more likes, comments, and shares. - Top Posts from Pages You Watch: This tab shows you the top-performing posts on the Pages you watch. You can add Pages to your watch list simply by clicking the Add Pages button. If you want an easy way to source great content for your Facebook Page, add Pages from similar businesses that you admire.
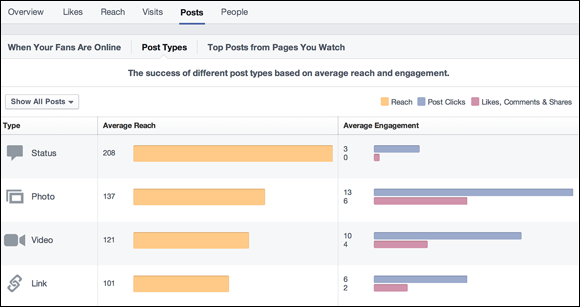
FIGURE 10-18: The Post Types report shows you average reach and engagement for each type of post.
Scroll down in the Posts report and you see the All Posts Published section. This section contains a table that describes how Facebook users engaged with each of your Page updates published for a recent one-week period. You can sort the Reach and Engagement columns and select various data to be displayed in each column.
This report can help you understand what types of stories increase engagement. In other words, it shows you what your fans want to talk about, which is half the battle!
The columns in this report are as follows:
- Published: The date that your post was published (your computer’s local time zone).
- Post: The content of the post. Clicking any of the links in this column allows you to see detailed analytics for the post in a small pop-up window.
- Type: The type of post published (status update, video, photo, or link).
- Targeting: How each post was targeted (location and language).
- Reach: The number of people who saw your post. You can break this statistic into paid/organic reach and fans/nonfans by choosing the desired option from the Reach drop-down menu (refer to Figure 10-13).
- Engagement: The ways Facebook users engaged with your content. You can view engagement in several ways including Post Clicks, Likes/Comments/Shares, Hide/Spam, and Engagement rate. Engagement rate is the percentage of people who commented on, liked, shared, or clicked a post. It’s essentially a score for the quality of your post — the higher the percentage, the higher the quality.
- Promote: You can choose to Boost a post from this column. A megaphone icon indicates that a post hasn’t been promoted but can be. Read more about Boosted Posts in Chapter 11.
You can view more details for each post by clicking the link for the post in the Post column(see Figure 10-19). When you do so, you can see the number of Likes, comments, and shares for the post, and shares of the post.
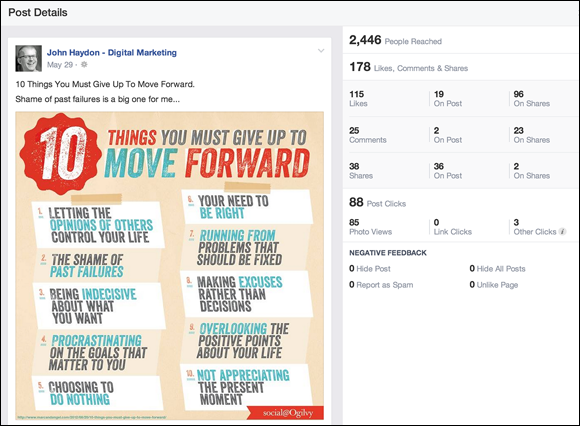
FIGURE 10-19: You can view details on engagement and reach for each post.
By analyzing post-level data, you can understand what type of content your fans engage with most. You also begin to see what type of content gets the most comments, likes, and shares. In other words, the information in this report improves your ability to engage existing fans, attract new fans, and create more awareness of your business throughout Facebook.
Evaluating Events with the Events Report
The Events report shows you how well you drove people to get information about your events for the last 7 or 28 days.
To view the Events report, click the Events tab within Facebook Insights (see Figure 10-20). In this figure, you see both the number of people you reached and the number of views of your event page. There are tabs that contain additional data broken down by the following:
- Awareness: The number of people who saw information about your event
- Engagement: The number of people who responded in some way to your Event information
- Tickets: How many people bought tickets to your event
- Audience: The demographic makeup of the people who took some action — their age and gender
- Upcoming/Past: A drop-down option (bottom of the page) that shows you information about your upcoming events and the ones you held in the past
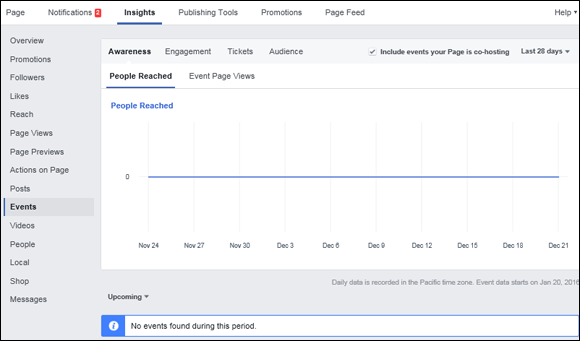
FIGURE 10-20: The Events report tells you about how people engaged with your event information.
Monitoring Engagement with the Video Insights Report
The Video Insights report shows you how well your videos are performing within certain date parameters. To view the Video Insights report, click the Videos tab within Facebook Insights (see Figure 10-21). The default date range for videos is 7 days. If you want to see a specific set of dates, you can click the pull-down to choose stats from Today, Yesterday, The Last 7 Days, the Last 14 Days, the Last 28 Days, This Month, This Quarter, or Custom.
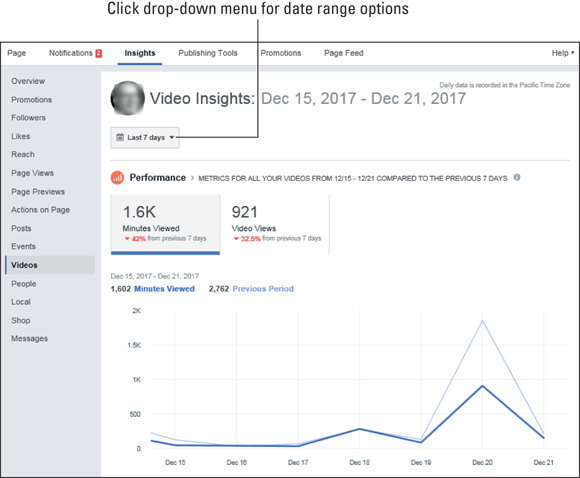
FIGURE 10-21: The Video Performance report shows you the aggregate number of minutes viewed and the number of videos viewed.
For your video to count as a video view, Facebook requires that the user watches for three seconds or more.
Also in Figure 10-21, within Performance, you see the following:
- Minutes viewed: This shows you the aggregate number of minutes viewed, which includes replays and views less than three minutes long. To count as a video view, Facebook requires that the user watches for three seconds or more. Under the number of minutes, you see the percent change from the previous seven days (or the date range you chose).
- Video Views: Shows the number of times videos were watched for three seconds or more. Under the number of videos viewed, you see the percentage change from the previous seven days (or the date range you chose). From a drop-down menu that appears when you click Video Views, you can also view whether the video was organic or paid.
Top videos show you a list of your top-performing videos (see Figure 10-22). They are broken down by
- Video: The video you choose from the displayed list
- Published: The time and date that your video was published
- Minutes Viewed: The total minutes viewed, including both the replays and the views that lasted less than three seconds
- Video Views: The total number of views over three seconds
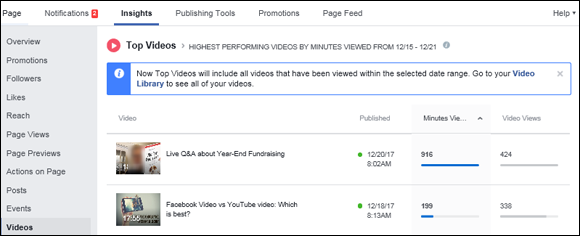
FIGURE 10-22: The Top Videos report shows you which videos received the most engagement.
Viewing Demographics with the People Report
The People reports contains demographic, location, and language information for Facebook users who like your Page, see your content, engage with your posts, and check in to your business (see Figure 10-23).
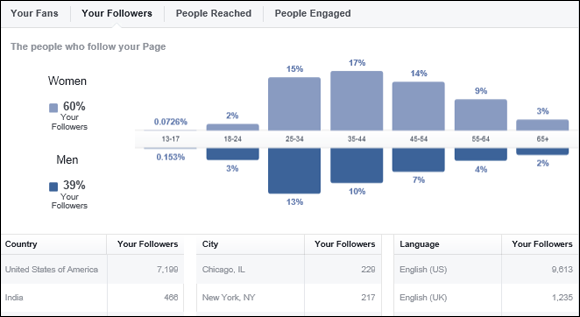
FIGURE 10-23: You can view demographic information on Facebook users who talk about your Page.
To view demographic information, click one of the four tabs:
- Your Fans: Demographic information about people who like your Page
- Your Followers: Demographic details about those who follow your Page
- People Reached: Demographic information about people who see your Page updates
- People Engaged: Demographic information about people who like, comment, share, or click your updates
Reviewing the Local Report to Learn about Activity Nearby
The Local report shows you the activity going on around your business location. You can see peak hours of action, demographic info, and Ad performance as it relates to people who are near your physical location.
To view the Local report, click the Local tab within Facebook Insights (see Figure 10-24). In this figure, you see a visual of your business location. You can choose to view data within a specific date range (One Week, One Month, and One Quarter) and Region. (All the data is anonymous, so you’re not invading anyone’s privacy.)
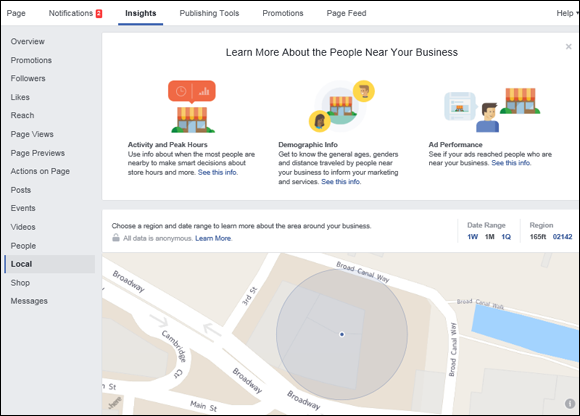
FIGURE 10-24: The Local report shows you people around your business location.
Next, you see a breakdown of age and gender for the people nearby. You also see the hours of the day and the day of the week when activity near your location is highest. This helps you determine what hours your store or service business should be open for business.
The Ad performance graph displays the percentage of people who saw your ad on Facebook who were within 165 feet of your business in relation to your ad spending. This shows you which days were high-performing days.
The People Nearby graph (see Figure 10-25) shows you data concerning people within 165 feet of your location hourly (for a 24-hour period), weekly (days of the week for one week), overall (trend data that shows you people nearby in relation to people nearby who saw your ads) and by check-ins (the number of people who checked into your business).
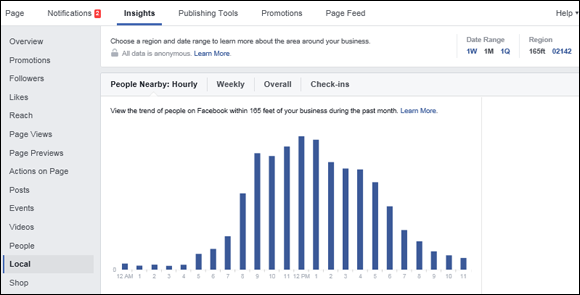
FIGURE 10-25: The People Nearby graph shows you trend data for several time and date ranges.
The Demographics graph, shown in Figure 10-26, shows you people within 165 feet of your business within the last month. You can display this information in a bar graph or line graph format depending on which display button you choose. The data is broken out by
- Age: Gives the percentage of each age range of people nearby
- Gender: Gives the percentage of each gender of people nearby
- Home Locations: Shows people who live within 165 feet of your business, or people who travel from 165 feet to get to your business
- Age and Gender: Shows the aggregate of age and gender of people nearby
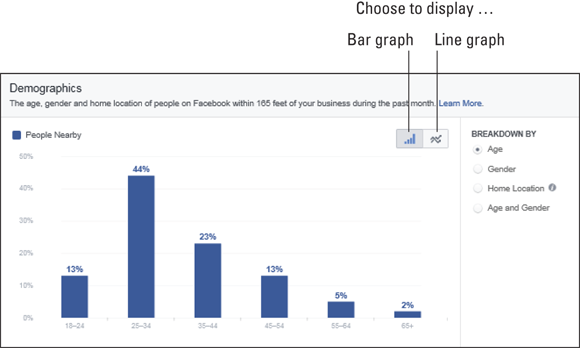
FIGURE 10-26: Demographics of people within 165 feet of your location.
Using the Shop Report to Evaluate Sales
The Shop report displays an overview of views, purchases, and sales within a specific date range. You can select a custom range to analyze, or choose one of three predefined segments of time: One Day, One Week, One Month, or One Quarter.
To view the Shop report, click the Shop tab within Facebook Insights (see Figure 10-27). You see the overview of Shop activity and change in percentage from the previous week.
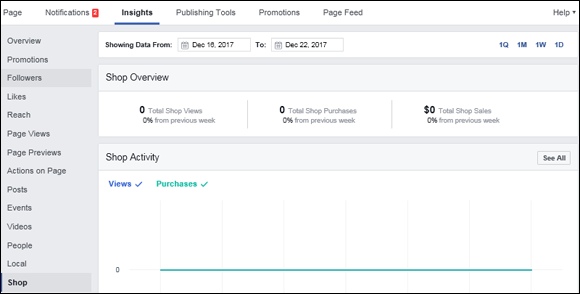
FIGURE 10-27: The Shop Overview.
Next you see the Shop activity broken down by views and purchases, followed by All Products in This Shop (see Figure 10-28.)
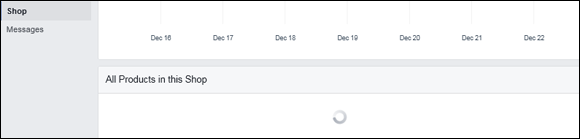
FIGURE 10-28: All Products in This Shop.
Unlocking Engagement with the Messages Report
The Messages report shows you the number of conversations your Page had with fans on Messenger for date ranges that include Today, Yesterday, the Last 7 Days, the Last 28 Days, or the Last 180 Days.
To view the Messages report, click the Messages tab within Facebook Insights (see Figure 10-29). The Messages report data is broken down by the following:
- Total conversations: This shows you the number of times you had a conversation with a person on Messenger and the percentage change over the date range chosen.
- Your responsiveness: This is an important metric. It shows you the percentage of messages you answered and the average response time. It also shows you the percentage change over the date range chosen. You can gauge your ability to serve customers with this data.
- Deleted conversations: This shows you how many conversations people had with your Page that they deleted, as well as the percentage change over the date range chosen.
- Marked as spam: This shows you both the number of conversations and percentage that was considered spam.
- Blocked conversation: This shows you both the number of conversations and percentage that were blocked.
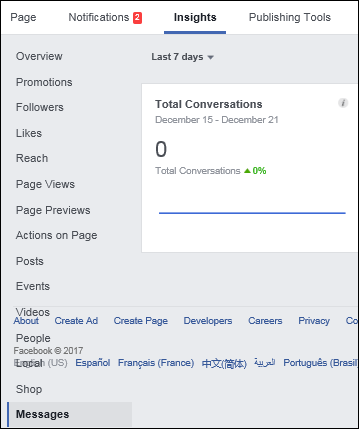
FIGURE 10-29: The Messages report.
Obviously, if you don’t have Messenger set up, the report will show zero conversations.
Exporting Insights Data
Facebook displays a limited amount of data in the native Facebook Insights tool, which we cover in the section “Exploring Facebook Page Insights,” earlier in this chapter. You can obtain additional data by exporting Insights data into a spreadsheet application, such as Microsoft Excel.
You can export either Page-level, post-level, or video data from Page Insights simply by choosing Insights ⇒ Overview and then clicking the Export button in the top-right corner of the Overview tab. After clicking Export, a pop-up window appears (see Figure 10-30).
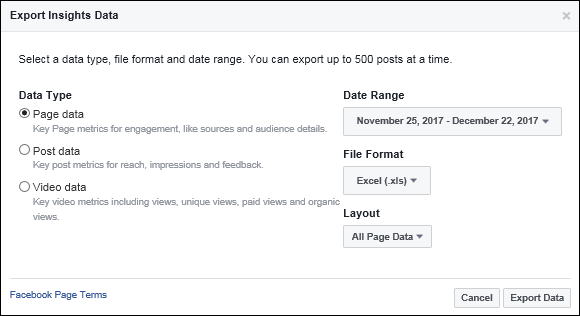
FIGURE 10-30: The Facebook Export Insights pop-up window.
From the Export pop-up window, select from the following:
- Data Type: Page-level, post-level, or video. (You can export only 500 posts at one time.) For example, the types of information that you can get from exported Page-level data include the number of people each day who saw your Page content and the number of people each day who engaged with your Page.
- Date Range: The amount of data you export has presets including yesterday, this month, and this quarter (see Figure 10-31). If you are doing comparisons, make sure to export enough data to make them meaningful.
- File Format: The choice of either the native Excel format (.xls) or comma-separated value (.csv) will allow you to view the report in Excel.
- Layout: Choose whether you want to create a custom report or export all the available data.
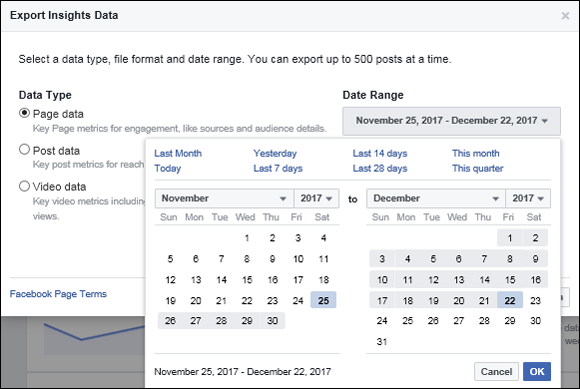
FIGURE 10-31: Selecting a data range to export.
When you’re ready, click the Export Data button, and the file will download to your device.
Using Third-Party Analytics
Although Facebook Insights is an invaluable tool for measuring your Page activity, sometimes you want to have additional information at your disposal, such as the keywords users entered to find your Page or the average amount of time people stay on your site.
Facebook made its Page Insights data available to third-party solutions through its Open API (Application Programming Interface). Several companies have already integrated this data into their existing services. Leading analytics companies such as Webtrends and IBM Digital Analytics have begun to roll out new offerings with Facebook data alongside their existing website analytics. The following list includes several such companies:
- Webtrends: You can use this detailed analytics package via self-installation or the Webtrends services team. This service is paid, and you must contact Webtrends for package pricing based on your needs. You can find more info on this product at
http://webtrends.com/solutions/campaign-optimization/facebook-campaign. - Post Planner: In addition to various Facebook Page publishing features, this tool includes a simple yet powerful analytics module that allows you to sort updates by comment, like, and engagement rate. For more information, see
www.postplanner.com. - Hootsuite: This social media management tool allows users to schedule posts on a variety of social media platforms (Facebook, Twitter, LinkedIn, and so on). This tool also includes a reporting module that allows you to select what Facebook Page Insights data you want to track. These reports are perfect for managers because the data is presented in a way that’s easy to understand. You can find more info about this tool at
https://hootsuite.com. - AgoraPulse: This suite of Facebook Page management tools allows you to export an easy-to-read Microsoft PowerPoint presentation about your Page Insights. Find out more at
www.agorapulse.com.
Keep in mind that these companies won’t be able to give you more data about your Facebook Page than what you already access through the Facebook Insights reports and the data export. What they will give you are different ways of presenting that data (graphs, charts, and so on), as well as additional resources for analyzing the data (consulting, educational webinars, and so on).