IF YOU WERE TO FIND yourself driving down a winding road along a steep cliff on a dark night, you’d want clearly marked guardrails to prevent you from getting too close to the edge. That’s the basic idea behind planetary boundaries. The human enterprise, as we’ve seen, is racing into the future at breakneck speed with hazards at every turn—hazards as dangerous and abrupt as plunging off a cliff. To avoid such disastrous outcomes for humanity we need to define planetary boundaries to act as guardrails to keep us from accidentally going over the edge. These boundaries won’t hinder growth or development, just as guardrails along a meandering road don’t slow down the progress of drivers. They’re there to prevent a catastrophe.
We didn’t need planetary boundaries in the 1980s, when we still lived in a small world on a big planet. We thought we could exploit minerals, living species, freshwater, land, oil, coal, and natural gas, without ever asking—not seriously, at least—whether infinite growth was possible on a finite planet. Now, all that has changed. Today we need a new framework for development that respects the true functioning of Earth’s climatic, geophysical, atmospheric, and ecological processes, a development paradigm in which human prosperity and economic growth occur within the safe operating space of a stable and resilient planet.
The starting point for this quest—to define a safe operating space for humanity on a stable planet—is to identify which of Earth’s processes are most important to maintaining the stability of the planet as we know it. As we saw in Chapter 1, there’s ample scientific evidence that the Holocene, the warm and stable inter-glacial period humanity has enjoyed for the past 10,000 years is the only biophysical state that can support the modern world as we know it. What must we do to maintain Holocene-like conditions on Earth, now that we, in the Anthropocene, have become a global force of change?
We know the Holocene well. We know how the ocean, land, and atmosphere interact, and how the climate system interacts with the biosphere. We understand the hydrological cycle, which regulates the global amount of biomass, together with land, nutrients, and energy from the sun. We understand the global cycles of carbon, nitrogen, and phosphorus. We know that to maintain our planet in its current state of balance, we depend on permanent ice sheets in the North and South poles, which reflect back into space a large proportion of heat from the sun. We know that living ecosystems determine the flux of oxygen, water, carbon, methane, and other elements in the Earth system through landscapes and oceans. By using the Holocene as a reference point for our future on Earth, in other words, we can scientifically quantify the boundaries we need to avoid pushing our planet out of its, for us, desired state.
In pursuit of this finding, our interdisciplinary group of scientists, including Hans Joachim Schellnhuber of the Potsdam Institute for Climate Impact Research, Will Steffen of the Australian National University, Katherine Richardson of the University of Copenhagen, Jonathan Foley of the University of Minnesota, Nobel Laureate Paul Crutzen of the Max Planck Institute for Chemistry, and many others, evaluated the forces that regulate the way Earth functions. We looked at one process after another, exploring interactions between them, and seeking to characterize the conditions needed to remain in a stable Holocene-like state. For each system, we made the best possible attempt, based on the latest scientific evidence at hand, to quantify the biophysical limits outside which the system might flip into a different, and for us undesired, state. These were the planetary boundaries.
This quantification had never been done before. Only during the past 10–15 years have scientists been able to explain the complex dynamics governing the way Earth operates. The first comprehensive overview of observations showing the exponential rise of human pressures on the planet during the past 50 years was published only eight years ago. But the groundwork for the planetary boundaries concept rests on more than 30 years of empirical research showing that ecosystems, from local lakes to forest biomes and large ice sheets, can abruptly cross tipping points and irreversibly shift from one stable state to another, unless they’re resilient enough to resist change. Whether we call them tipping elements, tipping points, regime-shifts, or thresholds is less important than the mountain of evidence showing that Earth’s resilience is what matters.
Sure, there were warnings in the past, from Rachel Carson’s Silent Spring in 1962 to the “Limits to Growth” analysis a decade later by Donella and Dennis Meadows, their colleagues, and the Club of Rome think tank. But these voices were drowned out by conventional economists, policymakers, and business leaders on the grounds that there was little or no evidence that humanity could push systems on Earth too far, or that we could exhaust the biosphere. Now, we know better. We have proof that human impacts on natural systems are hurting both our economies and our social welfare. We have evidence that critical thresholds are “hard-wired” into Earth’s environment and that we’d be wise to avoid triggering them.
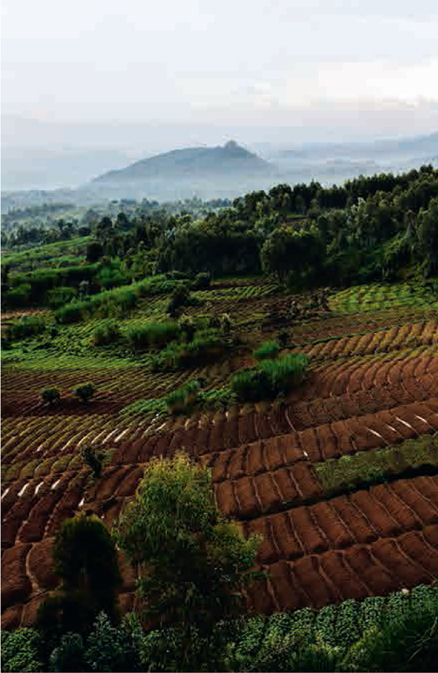
About 40 percent of all the land on Earth has been converted to agriculture, such as rice cultivation in Vietnam’s Mekong Delta.
The biophysical components of the Earth system—what we call nature for short—are full of surprises, we’ve discovered, and if we push systems too far, they can break and get stuck in an undesired state for humanity. If such tipping points occur in too many systems in too many places—such as the irreversible melting of ice sheets or the release of methane in steppe regions from thawing permafrost—then the combined effect could lead to the crossing of a planetary tipping point that takes us away from the Holocene.
We now know that the causes of planetary tipping points in the distant past were not limited to factors such as changes in Earth’s position relative to the sun or collisions with asteroids. They were also caused by interactions between external factors and responses from Earth itself. This is absolutely critical to recognize and something that science now understands with increasing precision. Earth is a complex and self-regulating system, in which everything is connected to everything else. This means, in very simple terms, that when nature is in good shape, Earth’s resilience is high. When the climate is stable, rains are adequate, soils and the air are intact, then biodiversity is rich and ecosystems thrive. Being resilient enables Earth to apply its biophysical processes to dampen external impacts. It’s like a boxer getting punched during a bout. In the first few rounds, when resilience is high, the boxer can absorb even strong punches without falling. But by the tenth round, as resilience is lost, the risk becomes much higher that the boxer, with the next punch, will cross a tipping point and get knocked out.
It’s the same with Earth. Oceans, land, water, and biodiversity, through flows and stocks of energy, nutrients, carbon, and other elements, can dampen or reinforce the impacts of external punches. In the geologic past, these “punches” came from outer space. Today they come from us humans. Fundamentally, it is the same thing. Our emissions of greenhouse gases prompt a planetary-scale energy imbalance. The grand question is how does Earth respond?
So far, Earth has applied its biophysical resilience to absorb disturbances, hiding away 90 percent of the heat from greenhouse gas emissions in the ocean, and soaking up more than 50 percent of our CO2 emissions in natural ecosystems. We call these negative feedbacks, since they reduce the impacts of disturbances. But as Earth’s resilience is gradually lost, critical systems are likely to ultimately cross thresholds when feedbacks change direction from negative (dampening) ones to positive (reinforcing) ones. Quite abruptly, Earth changes from friend to foe, from sweeping abuses under the carpet to becoming a reinforcing engine of change.
That’s why we need to respect planetary boundaries.
Having said that, defining safe boundaries is difficult because of the broad ranges of uncertainty involved. These are largely due to the difficulty of predicting how boundaries interact and respond to changes (such as what happens to the jet stream when the atmosphere traps more heat). With respect to human-induced climate change, for example, a vast majority of scientists now agree that we’re likely to cross a critical threshold in Earth’s climate somewhere between 350 to 450 ppm of CO2, beyond which we’ll very likely push the planet outside of our desired state.
The difference between 350 and 450 ppm encompasses a wide range of uncertainty. In the pre-industrial age (before 1750), the global atmospheric concentration of CO2 was 280 ppm, a level that hadn’t been exceeded for at least 100,000 years. Going beyond the range of uncertainty (higher than 450 ppm for CO2) will almost certainly push us outside Holocene stability. If that happens, we’re taking a big risk of triggering the irreversible melting of the Greenland and Arctic ice sheets, the West Antarctic ice sheet, the collapse of many tropical marine systems, the destabilizing of monsoon weather patterns, and so on. Having passed the 350 ppm mark around 1990, we’ve already seen some of the predicted consequences, such as the sudden reduction of ice cover in the Arctic Ocean, and the alarming findings in mid-2014 that several glaciers in West Antarctica have likely already crossed a threshold of irreversible melting, potentially adding another meter (3.3 ft) of sea level rise to the meter already expected by the end of this century.
And yet, despite such extremely troubling signals, science still cannot tell us precisely where the climate threshold lies. One reason is that our scientific understanding of how the Earth system operates is still incomplete, despite major advancements. Another reason is the fact that key processes interact with one another, which can affect their respective boundaries, such as the way that deforestation affects the global carbon sink, which in turn affects the safe level of CO2 concentration in the atmosphere. If the question is how far we can push these processes before we actually cross a dangerous threshold, science will never be able to give us exact answers. That makes it extremely difficult to say at exactly what point humanity crosses a dangerous line.
This is not surprising. In a complex world we rarely if ever know things for certain. Instead we act on the best available knowledge to make a sober judgment of the risks. This is what planetary boundaries are all about, presenting the best possible scientific estimate of how we can avoid unacceptable risks of triggering catastrophic shifts in the Earth system.
Our approach to uncertainty is to apply principles of precaution. As the editors of The Economist pointed out not long ago with razor-sharp British understatement, “when changes occur faster than theory stipulates it should, a certain degree of nervousness is a reasonable response.” In the same way, our group of scientists decided to place the safe boundaries for key processes at the lower end of scientific uncertainty—farther away from the cliff. In the case of climate change, that meant putting the boundary for CO2 concentration at 350 ppm. Placing the guardrail in such a cautious position, of course, involved a normative judgment about the level of risk the global community is willing to take—how close to the edge we’re all willing to drive our global economy. It also involved a judgment about how resilient we think societies might be to the consequences of crossing a tipping point, such as whether the world’s coastal cities will be able to cope with several meters of rising sea levels if the climate change boundary is ignored. As with any good management or governance system, of course, we assumed the planetary boundary framework needs to be adaptive, continuously updated, and fine-tuned as new information is gathered, as things change.
Intuitively, such an approach feels obvious to most people. We’re accustomed to operating within the confines of safe boundaries in our own lives. But so far we’ve remained remarkably negligent about doing so for the planet. We’ve never approached human development from the perspective of striving to remain in Holocene-like conditions. Rather than focusing on resource use, driving forces, or other direct aspects of human activity, we’ve never taken seriously the risk of abrupt or irreversible changes in the Earth system,
With respect to chemical or air pollution, for example, policymakers have customarily set targets at the local-to-regional scale, where they have attempted to define safe “critical loads,” or “minimum standards,” or “tolerable limits.” Communities and other localities have typically done the same thing with acceptable loads of heavy metals such as lead or cadmium in drinking water. Efforts like these have been aimed at determining how much we humans can cope with, a compromise based on an assessment of the costs and benefits to human health, or they’ve tried to establish a load limit to protect the environment, to preserve a sliver of land or water as an oasis.
The planetary boundaries approach does away with such compromises by focusing directly on biophysical processes—especially the role of thresholds in triggering abrupt and potentially catastrophic changes—rather than on resource use and demand, driving forces, or other aspects of human activity. Moreover, it avoids the trickiest issue of all—estimating the degree of human ingenuity. No assumptions are made about our capacity for innovation, for taking technological leaps that could transform our world, either decisively toward sustainability or away from the Holocene. Instead, it simply defines a safe operating space for humanity, marking the planetary playing field within which humanity can innovate, pursue social and economic aspirations, experiment with different technologies, and apply different governance and political systems. It leaves plenty of room for a myriad of options, as long as we live on a planet in good shape.
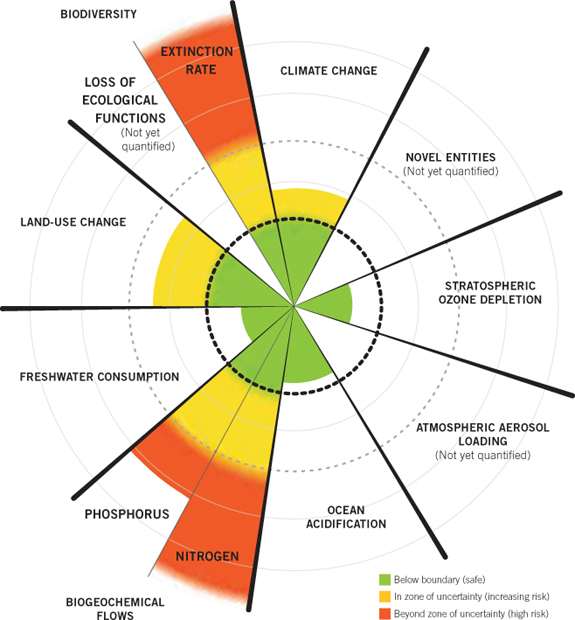
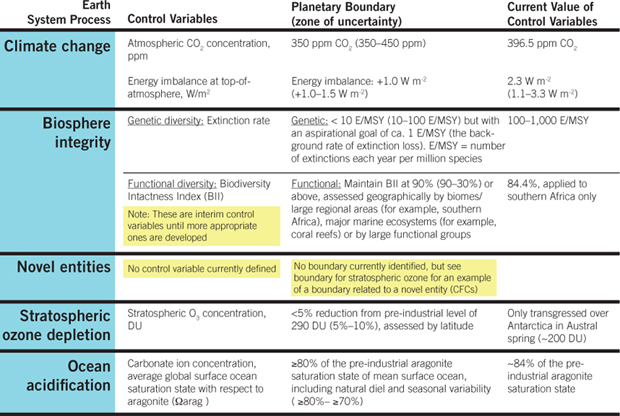
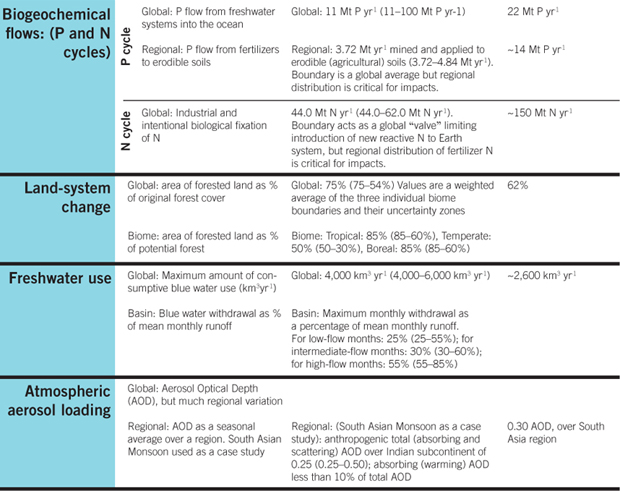
Figure 2.1 Planetary Boundaries, the 2014 Update. The nine boundaries proposed in the original 2009 study have been scientifically reconfirmed, with updated boundary estimates and a few important adjustments of phosphorus and land-use change. The analysis, drawing on decades of advancements in Earth system science and resilience research, identifies the biophysical “safe operating space” on Earth to maintain a stable and resilient “Holocene-like” planet, within which humanity stands a high chance of thriving in the future. The green wedges inside the dotted circle depict the “safe operating space.” When a boundary is transgressed beyond the safe operating space, we enter a danger zone of uncertainty, shown in yellow. Beyond the uncertainty range for science, we enter a high-risk zone for irreversible change, shown in orange. The wedges show the current position for each boundary.
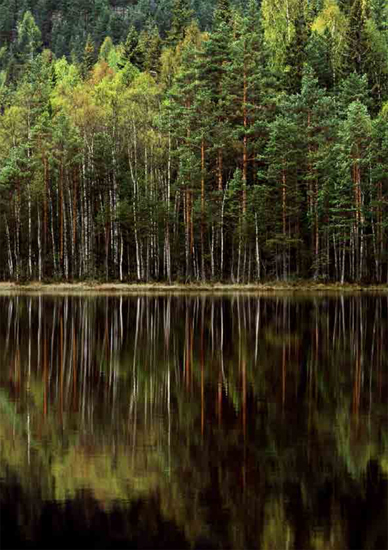
A lake reflects the autumn finery of a forest in Dalarna, Sweden. Boreal forests are sensitive to temperature variations as shown by long-term forest carbon studies.
Science has already been moving in this direction. With respect to climate change, for example, world leaders in 2009 agreed to limit global warming to 2°C above pre-industrial levels. This was a higher limit than our planetary boundary estimate of 1.5°C, but it was still a global climate boundary. Great research from colleagues at the Potsdam Institute for Climate Impact Research, the International Institute for Applied Systems Analysis, the Netherlands Environmental Assessment Agency, and the Environmental Change Institute at Oxford have subsequently translated this climate boundary to a global carbon budget. Their research has shown that we can emit no more than 1,000 billion tons of additional CO2 into the atmosphere to maintain a 66 percent chance of staying below 2°C. That leaves us with no more than 25–30 years to transition away from a fossil-fuel-based world economy. This is applying planetary boundary thinking to one of the nine boundaries.
The game has thus changed.
THE NINE PLANETARY BOUNDARIES
Following a comprehensive review, engaging global change scientists from different fields, our team identified a number of planetary boundaries. Given the complexities and interactions that exist between all living and non-living components, from bacteria to bedrock, you might have expected we’d end up with 50 or more processes. Instead our critical assessment identified the following nine:
Climate change
Stratospheric ozone depletion
Rate of biodiversity loss
Chemical pollution
Ocean acidification
Freshwater consumption
Land-use change
Nitrogen and phosphorus pollution
Air pollution or aerosol loading
We published our findings in 2009 as a challenge to the scientific community. Had we missed something? Had we included any processes that clearly were not planetary boundaries? We put our findings out for scrutiny by the international science community, and, exactly as we hoped, it triggered a wide engagement by scientists around the world, as well as among policymakers, business leaders, and individuals from civil society. Five years down the line, following many scientific articles assessing and improving our original work, we feel more confident about our choices than ever. In 2014 we prepared a scientific update on the planetary boundaries, in which we concluded that the nine boundary processes we identified are the correct ones.
Identifying the nine boundary processes was one thing. Quantifying safe boundary levels was another altogether. In our 2009 assessment, we proposed quantifications for seven of the nine boundaries. For a few of these, the science was so robust and well advanced that boundaries were already well established. This was the case with climate change, where we set the boundary at 350 ppm CO2 or 1 watt per square meter of additional human-caused climate forcing, and for stratospheric ozone depletion, where we proposed to keep the protective ozone layer intact by not allowing it to thin more than 5 percent compared to its pre-industrial thickness. For land-use change, global freshwater use, and ocean acidification, we felt relatively confident with otur proposed boundary levels, while recognizing that there was a very wide range of uncertainty, and therefore room for improved quantifications as science advances, and even for identification of better control variables. For the rate of biodiversity loss and human interference with the global nitrogen and phosphorus cycles, we were only able to provide first best guesses based on the evidence at hand. This has in turn resulted in important advancements in the science, which has resulted in greatly improved quantifications of these boundaries. Finally, we were never able to provide quantifications for the aerosol loading and chemical pollution boundaries. The reason was primarily because they depend on so many interacting factors, a myriad of different chemical compounds and pollutants.
Today, all the boundary quantifications have been updated based on the latest science, incorporating the key improvements proposed and published in peer-reviewed literature during the past five years by independent scientists around the world. We’ve made a first attempt at providing a good indicator for the aerosol loading boundary by quantifying a regional level of minimum optical depth of solar radiation for Southeast Asia. We’re still struggling with the chemical pollution boundary, which we’ve renamed “novel entities” to indicate that these are truly novel compounds in the Earth system, created entirely by us humans.
One way to think about the boundaries is to put them in three groups, according to how they operate. The first group includes processes with sharply defined global thresholds, such as the risk of melting the Greenland and Antarctic ice sheets—processes capable of sharp shifts from one state to another, with direct implications for the entire planet. We called these “The Big Three.” They are climate change, stratospheric ozone depletion, and ocean acidification. Thresholds for these processes are hard-wired into the Earth system and cannot be shifted by human actions (at a certain temperature the great ice sheets melt, and once this occurs, the planet will move away from its current Holocene equilibrium).
The second group includes boundaries based on slow planetary variables that contribute to the underlying resilience of the Earth system. We called them the four “slow boundaries.” They are land-use change, freshwater use, biodiversity loss, and interference with the global nitrogen and phosphorus cycles. Unlike the first group of boundaries, which impact the Earth system from the “top down,” the second group works from the “bottom up.” Rather than being associated with change at the global scale, they’re associated with local-to-regional scale thresholds. We see them as processes that operate “under the hood” of the planetary machinery to buffer the Earth system from harmful impacts and to strengthen its resilience.
Even though the boundary processes in this second group don’t appear to have their own thresholds at the large regional or global scale, that doesn’t mean there aren’t thresholds associated with them. On the contrary, there’s ample evidence that gradual changes in key variables such as biodiversity, harvesting of biomass, soil quality, freshwater flows, or nutrient cycles can trigger abrupt changes when critical thresholds are crossed in ecosystems such as lakes, forests, or coral reefs.
The question is: When do such tipping points become a global concern? When do they pose a threat to Earth’s ability to stay in a Holocene-like state? If overfishing and nutrient loading cause a few lakes in one region to collapse, that might not have any implications for a region or Earth as a whole. But if such tipping points occur simultaneously in thousands of lakes around the whole world due to similar unsustainable practices, then consequences such as the loss of carbon sinks, which will affect the global climate system, and the collapse of local economies could indeed become a global concern.
The third group of boundaries consists of two human-created threats: air pollution from soot (black carbon), nitrates, sulfates and other particles; and pollution of the biosphere by chemicals such as heavy metals and persistent organic pollutants. Because of the hazards they pose to human health and to the Earth system at local, regional, and global scales, our scientific team felt that both problems merited planetary boundaries. But because both are associated with a multitude of processes in a complex way, we haven’t yet managed to set safe boundaries for them. More research is needed.
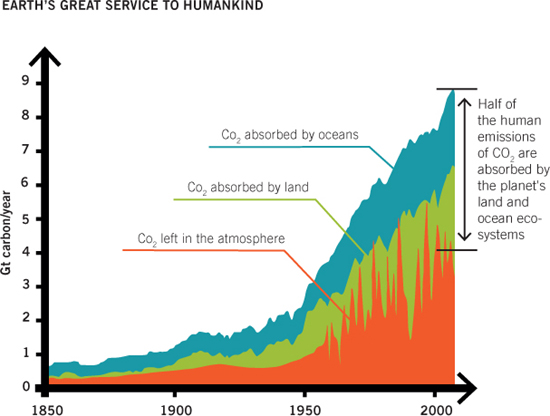
Figure 2.2 CO2 Absorbed by Earth. During the past 50 years, global CO2 emissions (in billion tons of carbon emissions per year) have roughly doubled. Because CO2 is a long-lived greenhouse gas that stays in the atmosphere for up to 1,000 years, one would expect that the entire amount of carbon dioxide emitted has contributed to the 1°C (1.8°F) warming observed during this period. However, the reality is that the ocean and land ecosystems of the biosphere each absorb roughly 25 percent of our emissions, leaving only half of the total in the atmosphere (the clouded area in the graph). This means that in the past half century, the amount of CO2 absorbed by nature has increased from 2 billion tons to 4 billion tons—proof of Earth resilience at play.
Since our original study, we’ve made two key advancements in the way we frame the planetary boundaries. The first was to recognize that there is a certain hierarchy among boundary processes. It is one thing to distinguish them based on whether we have evidence of planetary-scale tipping points (The Big Three), or whether the processes operate as resilience regulators (the slow variables). But an equally important question is whether some boundaries on their own can knock the Earth system away from the Holocene, or whether they only regulate the outcome of others?
Our analysis indicates that the climate system and the richness of biodiversity on Earth have a decisive role, on their own, in determining the outcome of the planetary state. The final state of our climate system and biodiversity is determined by the aggregate effects of how water flows, land use, and nutrient flows operate. In simple terms, if we get it right on climate and biodiversity, then we’re very likely to safeguard a desired state of the planet. We therefore call these two “core boundaries.” Conversely, the only way to succeed in ensuring that we stay within a safe operating space for climate and biodiversity, is to get it right on all the other boundaries, since these determine the life conditions for all species in the biosphere and regulate the final state of the climate system.
The second advancement of the boundaries framework resulted from a critique of the original proposal. In that proposal, we defined only global boundaries, which, as many rightly have pointed out, provided little guidance for “managing the boundaries” at the local and regional scales. The fact is, all of the processes operate locally: Emissions of greenhouse gases have local sources, just as land use, freshwater use, and deforestation all occur locally, even though they have global consequences. It makes sense, therefore, to couple the global boundaries with regional-scale boundary definitions, since the boundaries operate across scales. Each planetary boundary, where relevant and possible, now has a twin definition—a planetary scale and a regional scale boundary level. With respect to freshwater, for example, we have defined the global boundary as the maximum amount of global runoff we can use (less than 4,000 km3/yr). To this we have added a boundary for each river basin in the world, defined as the minimum amount of water that needs to be retained in each river in order to safeguard water-dependent ecosystem functions and resilience.
Small parcels of land in Rwanda’s Gishwati Forest Reserve (left) were given to returning refugees. In Sarawak (right) urban expansion crowds former coastal rainforest.
But back briefly to the core approach, and how we defined boundary levels. For each boundary process where we have enough scientific evidence, our team of scientists identified a parameter that determines or describes how well, or how poorly, each process is working. We called these measurable indicators “control variables.” The choice of a control variable for each boundary was based on our assessment of which indicator would provide the most comprehensive, aggregated, and quantifiable description of how the boundary process is operating. In the next chapter, we’ll dive deeper into the most urgent of these boundaries and the global risks they pose. But for now, here’s a brief description of how we proposed to track them.
For climate change, as we mentioned earlier, we suggested two control variables: atmospheric concentration of CO2 and radiative forcing. On the one hand, we proposed a boundary of no more than 350 ppm for atmospheric CO2 concentration, based on the fact that paleo-climatic data show that concentrations higher than that can result in the melting of the large polar ice sheets, with potentially disastrous consequences for humanity, from rising sea levels to the collapse of coral reef systems and rainforests. At the same time, it was necessary to complement this “simple” carbon dioxide boundary with a boundary that incorporates the effects of all greenhouse gases, both warming (methane and nitrous oxide) and cooling aerosols (nitrate and sulfate). The best parameter here is radiative forcing, which measures the net amount of energy at Earth’s surface added by human emissions of greenhouse gases. We proposed an increase of no more than 1 watt per square meter. This is generally understood to correspond to a rise in average global temperature of 1°C (1.8°F). Right now, these two variables closely follow one another, because the warming by all other gases other than CO2 (roughly 20 percent of the forcing so far) is cancelled out by the net effect of all cooling gases. But given the complexity of the atmosphere, including the interplay between greenhouse gases and cooling pollutants, this might not always be the case. So we felt it was prudent to measure both CO2 concentration and radiative forcing as markers for climate change.
We took a similarly pragmatic approach when choosing control variables for other planetary boundaries. For ocean acidification we proposed measuring the surface seawater saturation level of aragonite as a proxy indicator, since it’s a good indicator of overall ocean health with regards to ocean acidification. Aragonite is a type of calcium carbonate that dissolves when ocean water becomes too acidic. If the aragonite level were to drop below 80 percent of pre-industrial levels, we estimated, then corals reefs could also be endangered, potentially leading to a collapse of critical marine ecosystems.
With respect to the rate of biodiversity loss, we proposed to use the current extinction rate of species as a parameter of overall ecological impact. Studies of the fossil record have shown that the average extinction rate for both marine organisms and mammals in the past was 0.1–1 extinctions per million species per year. Since the advent of the Anthropocene, that rate has skyrocketed to more than 100 extinctions per million species per year—up to a 1,000-fold increase over the geological background rate. Today about a fourth of all species, among those that are well studied, are threatened with extinction.
Scientists have warned that if species loss continues at that scale it could undermine the ability of many ecosystems to keep functioning, which would be bad news for human societies that depend on them. It could even cause these ecosystems to tip into undesired states, such as savannahs turning into deserts, or rainforests into savannahs. But defining a safe level has remained extremely difficult. For one thing, every species isn’t equally important in the functioning of ecosystems. The loss of a top predator species such as sharks can be much more damaging to a reef system than the loss of other fishes. So, given that uncertainty, we proposed as an interim indicator a maximum of ten cases of extinction per million species per year—significantly higher than the background rate but one to two orders of magnitude less than the current rate. We’ve improved the biodiversity indicator further, by complementing the rate of species loss with an indicator that measures the capacity of ecosystems to deal with change. It does this by considering not only the number of species but also the different functions that species play, such as pollination and whether fish are predators or grazers. It also considers the number of species for each function that still exist in an ecosystem (as measured by indices such as the Means Species Abundance or the so-called Biosphere Integrity Index, or BII).
For stratospheric ozone depletion, which poses health hazards to humans in the high latitudes from damaging ultraviolet (UV) rays, we proposed a boundary of no more than a 5 percent loss in O3 concentration from pre-industrial levels. Greater losses than that could increase the likelihood of ozone “holes” reappearing over the polar regions each spring.
For global freshwater use, we proposed a boundary of no more than 4,000 km3 per year of consumptive use of runoff resources. That would essentially mean a leveling off in human exploitation of rivers and aquifers for irrigation and other uses to avoid thresholds that could lead to the collapse of terrestrial or aquatic ecosystems.
Conversion of rainforests and other ecosystems to cropland and cities represented another problem calling for a planetary boundary. To keep from crossing dangerous thresholds such as biodiversity loss, freshwater disruption, and reduction of carbon sinks, we proposed a boundary of no more than 15 percent of the planet’s ice-free land surface under cultivation or development—compared to the current figure of about 12 percent. We chose this control variable as it is well known and monitored at the global scale. We recognized that it was a rough simplification, as our real concern for land is to make sure that we maintain the most critical natural land-use types intact, such as the remaining forests, which play a key role in regulating carbon sinks, constitute habitats for biodiversity, and regulate water flows across regional scales. In our latest update we have therefore switched the boundary definition from one side of the coin (the maximum amount of crop land added) to the other side of the same coin (the minimum amount of forest areas necessary to maintain critical biomes). Our latest proposed assessment is that we need to maintain intact at least 85 percent of rainforests (in Amazonia, the Congo Basin, and Southeast Asia), 85 percent of the world’s boreal forests, and 50 percent of the world’s temperate forests.
With respect to the overuse of nitrogen and phosphorus, which threaten to eutrify marine ecosystems and trigger major anoxic events or “dead zones,” we proposed a boundary of no more than 35 million tons (or Mt) of N2 per year of industrial and agricultural fixation and no more than ten times the natural background weathering of phosphorus in the annual inflow to the world’s oceans. In our latest update we have improved the nitrogen boundary by including not only artificial nitrogen fixation by the Haber-Bosch process of producing fertilizers, but also the added biological fixation of nitrogen in modern agricultural systems (nitrogen uptake that would not occur if it had not been for our modern agricultural systems). This has led to an updated nitrogen boundary of no more than 44 Mt of nonreactive nitrogen gas extracted from the atmosphere and transformed to reactive nitrogen in the biosphere per year. Furthermore, for phosphorus, we were criticized, in our original analysis, for considering only catastrophic thresholds in the ocean. As Steve Carpenter and Elena Bennett clearly showed in a critical update on the phosphorus boundary, well before phosphorus causes damage downstream on marine systems, it causes tipping points in freshwater systems. Phosphorus leaching originates not only from land, particularly from fertilizer use in agriculture, but also from weathering and leakage from water-treatment plants. As phosphorus moves through landscapes, from land to the sea, it triggers thresholds in lakes and wetlands. We’ve therefore added a freshwater phosphorus boundary to the ocean phosphorus boundary.
By quantifying planetary boundaries in this way—as clearly marked guardrails for human impacts—our aim was to advance integrated science for global sustainability and provide policymakers, business leaders, and members of the public with practical tools to keep us from skidding off dangerous cliffs. (For more information about the nine planetary boundaries, their respective control variables, and the potential consequences of transgressing each, see tables on pages 50 and 61.) Viewed from a slightly different angle, though, the planetary boundaries also offer a hopeful, positive promise, laying out a safe path for humanity that gives us plenty of operating space for innovation, growth, learning, experimentation, and diversity. If we stay on the safe side of planetary boundaries, that is, we can continue to develop and prosper for many, many decades and centuries to come.
WHERE DO WE GO FROM HERE?
The purpose of our research, as we’ve said, is to map out a safe operating space for humanity in order to avoid crossing sudden catastrophic tipping points in the Earth system. Once a boundary is transgressed we enter a danger zone where crossing thresholds can no longer be excluded. As the data clearly show—see the chart on page 65—we’ve transgressed four of the nine planetary boundaries and are thus in a danger zone already: climate change, biodiversity loss, global land cover change, and nitrogen overload and the freshwater part of the phosphorus boundary.
The most recent observations of CO2 levels in the atmosphere show a monthly average concentration of 399 ppm, well beyond our planetary boundary of 350 ppm. In fact, the monthly CO2 average hasn’t been as low as 350 ppm since 1986, and it has climbed steadily every year by an average of 1.4 ppm. Although greenhouse gas emissions in the USA and other nations have recently showed modest reductions, the trend is still strongly in the wrong direction. In fact, despite US and Chinese promises in November 2014 to peak CO2 emissions by 2030, and the EU’s reduction target of 40 percent by 2020 (compared to 1990), the world continues to rush toward the 450 ppm CO2 boundary ceiling, beyond which catastrophic tipping points are, from a scientific perspective, very likely.
The same is true of the vast quantities of nitrogen being released into the biosphere, primarily through commercial fertilizers for modern agriculture. Excessive nitrogen loading in lakes, rivers, and wetlands threatens to trigger tipping points on local to regional levels, such as those we’ve seen in the Baltic Sea, where about a sixth of the water is now a “dead zone” with low-oxygen content. The current scientific assessment about the global nitrogen cycle is that a safe planetary boundary should be the production of no more than 44 Mt of nitrogen per year, a level we raced past in the early 1990s. To reach that level from the current one of about 150 Mt per year would require cutting back on more than two thirds of nitrogen production. Another tall order.
But the most dramatic transgression is what’s happening with the biodiversity boundary. The pace of species loss today is so great we’re literally in the midst of the planet’s sixth mass extinction, which is certain to cause massive and permanent changes in the functioning of Earth’s ecosystems. Especially troubling are the losses of top predators, species at the top of the food webs, which are rapidly changing the entire structure of natural life-support systems, including triggering major tipping points. These losses are tragic, because, unlike other planetary boundaries, they’re irreversible. A lost species cannot be brought back. That makes biodiversity loss a deep global concern.
Our most recent update shows that we are in a danger zone also on land-use change. We have cut down so much of the tropical rainforests and temperate and boreal forests that only about 60 percent of Earth’s original forest cover remains. Our estimate is that we need to keep at least 75 percent of Earth’s forest cover to safeguard the planet’s resilience.
Although we are still operating within a safe space in relation to the other four planetary boundaries (we cannot know for sure for novel entities), we see the same disturbing trend of rapid growth for all of them. This applies in particular for freshwater, where about a fourth of the world’s rivers no longer reach the oceans, and there have already been several freshwater-driven collapses at the regional scale, such as Lake Chad and the Aral Sea. The trend is looking very gloomy indeed.
One additional complicating factor is the way that planetary boundaries interfere with one another. If we transgress one, we can’t exclude the possibility that we’ll cause others to shift, most likely in a direction that further constrains our options. Rather than being permanently fixed goals, in other words, planetary boundaries are dynamic targets, constantly moving, which means they can’t be managed one at a time. That’s an important message for policymakers, investors, business leaders, scientists, and concerned members of the public. Our advice therefore is to think of the planetary boundaries as a comprehensive package that operates a bit like the “three musketeers:” one-for-all and all-for-one. To avoid slipping away on any single boundary, we need to stay within the safe operating space for all of them. Conversely, if one boundary is transgressed, such as climate change, it’s more likely that we’ll lose on others as well, such as biodiversity.
It’s becoming increasingly clear, in the end, that the “final battleground” over climate change is moving away from a focus on reducing emissions to a focus on managing the biosphere. Whether we’re able to achieve a low-or even zero-carbon society within 50 years (as challenging as that may be) won’t be the only factor determining whether we go over the climate cliff. We must also ensure that the biosphere, with its boundaries on land, water, biodiversity, and nutrients, continues to provide enough resilience to buffer global warming by sequestering carbon, keeping methane below ground, providing freshwater for bio-mass growth (which locks carbon), and maintaining resilient habitats of grasslands, savannahs, rainforests, and wetlands. If we transgress boundaries for all these ecosystem functions and services, we can’t count on the planet behaving as we want it to. We can’t expect it to maintain the negative feedbacks that have so far slowed global warming. If the planet goes from friend to foe, then our mitigation policies for emission reductions will make little difference. Because as impressive as they might be, human impacts on the climate system pale by comparison to the warming feedbacks the Earth system itself can trigger. If the carbon contained in just the top 50 cm (19.6 inches) of soil in the Arctic were to be released, for example, it would exceed all the carbon humans have emitted since the industrial revolution began 250 years ago.
We used to live in a small world on a big planet. Now we inhabit a big world—with big impacts—on a small planet.
That’s why we need to respect the planetary boundaries.