12
Cash Flow Shenanigan No. 3: Boosting Operating Cash Flow Using Unsustainable Activities
With local versions in more than 100 countries, the hit game show Who Wants to Be a Millionaire? has been one of the most successful television franchises of all time. The game is alluringly simple: contestants are asked up to 15 trivia questions. Answering all the questions correctly will win the grand prize; however, if the contestant gives one wrong answer, he or she goes home.
If a contestant is struggling with a question, the rules allow for the use of a “lifeline.” For example, one lifeline allows the contestant to ask a friend for help, and another lets the contestant poll the studio audience for its opinion. These lifelines can prove very valuable and often keep struggling contestants afloat. However, they must be used judiciously, since there are just three of them, and once they’re gone, they’re gone.
Similarly, struggling companies often use valuable “lifelines” to help them keep their cash flow afloat. Just as in the game show, it is often wise and certainly legitimate for companies to use these lifelines. Unlike in the game show, however, companies may fail to disclose the use of these nonrecurring cash flow lifelines. It is up to you to spot them, because once they’re gone, they’re gone.
In this chapter we discuss four unsustainable lifelines that companies use to boost their cash flow from operations.
Techniques to Boost Operating Cash Flow Using Unsustainable Activities
1. Boosting CFFO by Paying Vendors More Slowly
Want to save a little more cash this year? Use your “delay-payments” lifeline: wait until the beginning of January to pay your December bills. If you push your payments out a month, your end-of-year bank balance will be higher, and it will cosmetically seem as if you generated more cash this year. However, you certainly would not be under the delusion that you had found a recurring way to grow your cash flow each year; rather, you would realize that this was a one-time benefit. To grow your cash flow again next year, you would have to push two months’ worth of payments into the following January.
Your “delay-payments lifeline may be a helpful cash management strategy, and there is certainly nothing wrong with holding your money a month longer. In the same way, it is completely appropriate for a company to take longer to pay back its vendors and reap the immediate cash management benefits. However, just like you, companies cannot continue to delay payments into eternity. The cash benefit from pushing out payments (i.e., an increase in payables) should be considered a one-time activity, not a sign that the company has found a lasting way to generate more cash. While this may seem like common sense, you would be surprised at how many companies tout their CFFO strength and forget to mention their little secret: that they increased CFFO by stringing out vendors and not paying them in a timely fashion.
Home Depot Squeezes Its Vendors
Just days after losing an internal management succession battle to replace the legendary Jack Welch at GE, Bob Nardelli earned a consolation prize: the top job at Home Depot. Appointed in December 2000, Nardelli immediately was hailed as the master operating executive that the struggling home improvement retail chain desperately needed. The board loved his GE pedigree and rewarded him right off the bat with an extremely generous compensation package. And Nardelli certainly knew how to please. In his first year on the job, he more than doubled CFFO—from $2.8 billion to nearly $6 billion. Investors who were not too worried about the details of its climb were thrilled.
This cash flow growth, however, would prove to be unsustainable and unrelated to increasing sales at the business. In that first year, Nardelli did a masterful job of redefining the way Home Depot did business with its vendors. Specifically, the company started treating suppliers very badly by paying them much more slowly. By the end of fiscal 2001, Home Depot had successfully stretched out accounts payable to 34 days from 22 the year earlier. The company’s Statement of Cash Flows (shown in Table 12-1) reveals that this seemingly minor change in accounts payable was the primary driver of the company’s impressive cash flow growth. Another large component of CFFO growth was a decrease in the amount of inventory held at each store (as we will discuss later in this chapter).
Table 12-1 Home Depot Statement of Cash Flows, 2000–2002
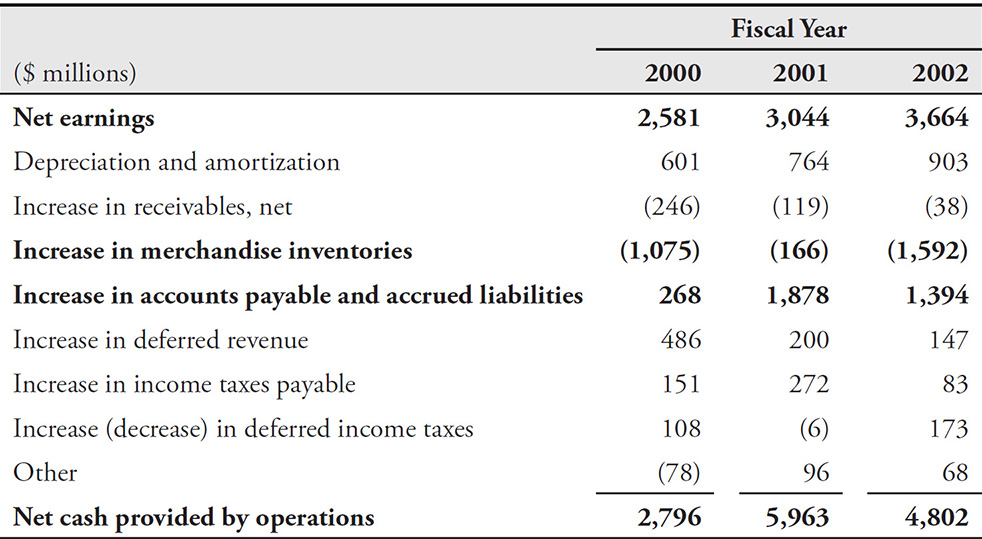
Okay, mission accomplished for 2001. The next year, Home Depot was faced with the challenge of improving upon an incredible 2001. To grow CFFO again, however, the company first would have to replicate the 2001 boost it would no longer receive in 2002. The company could stretch payables again in 2002, but not to the extent of the prior year (as payables reached 41 days from 34 days). CFFO for 2002 fell to $4.8 billion from $6.0 billion in 2001.
Accounting Capsule: Days Payable Outstanding
Days payable outstanding (DPO) is generally calculated as follows:

Investors should analyze payables in terms of days outstanding in much the same way that they analyze receivables (days’ sales outstanding, or DSO) and inventory (days’ sales of inventory, or DSI). An increase in DPO means that the company is paying off its payables over a longer period. A decrease in DPO means that the company is paying its bills more quickly.
Investors should note that Nardelli’s cash management techniques certainly were not inappropriate and seemed beneficial to the company’s operations. The takeaway here, however, is that the $3 billion increase in CFFO during 2001 should have been viewed as nonrecurring. Alert investors would have correctly anticipated that CFFO would shrink in 2002.
Watch for Large and Suspicious Increases in Payables An increase in payables relative to cost of goods sold tells you the company has probably stretched out its payments to vendors. Assess the extent to which CFFO growth is derived from stretching out payments to vendors and consider that amount an unsustainable boost that is unrelated to improved business activities.
Look for Large Positive Swings on the Statement of Cash Flows A quick review of Home Depot’s CFFO in 2001 shows that improvements in accounts payable and inventory were the primary drivers of CFFO growth. (See Table 12-1.) In the following year, it is evident that Home Depot’s inability to sustain that improvement was the primary source of CFFO deterioration.
Be Alert When Companies Use Accounts Payable “Financing” Some companies choose to “finance” their accounts payable by getting a bank involved in their transactions with vendors. In these so-called vendor financing arrangements, a company does not pay its vendors directly; rather, a bank pays off the vendor invoice, and the company reimburses the bank at a later date. These transactions result in the creation of bank debt on the company’s Balance Sheet in place of accounts payable. Since the repayment of bank debt is categorized on the Statement of Cash Flows as a financing activity, the cash paid for this inventory would never be shown as an operating outflow.
Wireless carrier T-Mobile, for example, offered vendor financing arrangements for its handset and network equipment suppliers. In 2015 alone, T-Mobile repaid $564 million in short-term debt that was used for purchases of handset inventory and network equipment. Conveniently, this cash outflow was buried on T-Mobile’s Statement of Cash Flows as a financing activity.
This anecdote shows the enormous management discretion available in classifying a straightforward transaction on the Statement of Cash Flows. To properly compare cash flow generation at these competitors, investors must adjust for this difference in policy. Each company provided sufficient disclosure to understand its SCF classification. Diligent investors would have used these disclosures to reflect both sides of the loan transaction (inflows and outflows) as financing, not operating.
TIP
Accounts payable is a relatively straightforward account. If you see a discussion of accounts payable that is longer than a couple of sentences, there is probably something in there that you want to know (for example, accounts payable financing arrangements).
Watch for Swings in Other Payables Accounts Accounts payable is not the only obligation that companies can use to manage their cash flow. CFFO can be influenced by the timing of payments on many liability accounts, including tax payments, payroll or bonus payments, and pension plan contributions. Consider how Callaway Golf Company’s tax situation resulted in unsustainably strong CFFO in 2005.
Callaway spent the off-season working on its long game. The dedication seemed to pay off. In 2005, Callaway drove its CFFO up to $70.3 million—quite an improvement from the meager $8.5 million reported in 2004. A quick check of the Statement of Cash Flows reveals that CFFO growth came from an improved swing—that is, a $55.8 million “swing” in the impact of tax payables and receivables (apparently because of net tax refunds and settlements). It should not have been too rough for investors to spot this tax swing on the Statement of Cash Flows and deduce that Callaway’s strong CFFO growth would not recur.
2. Boosting CFFO by Collecting from Customers More Quickly
Another way in which companies can generate a nonrecurring CFFO boost would be to convince customers to pay them more quickly. This certainly would not be considered a bad thing, and it may even speak well of a company’s significant leverage over its customers. However, as in our discussion about stretching out payables, companies cannot continue to collect at a faster rate in perpetuity. As a result, the growth in CFFO that results from accelerated collections should be deemed unsustainable.
Watch for CFFO Boosts from Higher Prepayments
For high-end electric automaker Tesla Motors, liquidity and cash flow have been particularly important metrics for investors and lenders. Since its founding in 2003, Tesla had never posted a full year of positive free cash flow, and therefore the company had become entirely reliant on debt financing and equity issuances to continue funding its operations. In 2016, Tesla’s operating cash outflows appeared to have improved, amounting to net outflows of $124 million, down from outflows of $524 million in 2015. However, what changed most significantly in terms of cash flow that year was that the company began accepting orders and refundable customer deposits for its Model 3 sedan, which had been introduced only in concept. These deposits accounted for $350 million of additional inflows, or 88 percent of the reported improvement in 2016. Skeptical investors would have noted that fundamentally the business continued to burn cash at historical rates, but because of a successful marketing campaign, it was able to “borrow” from future periods and accelerate customer payments to report better results.
Watch for Elaborate Strategies to Influence the Timing of Cash Flow
Warning signs about accelerated collections could certainly have been spotted at Silicon Graphics several quarters before its May 2006 bankruptcy. The company was burdened with debt and did everything in its power to portray a stronger liquidity position to investors. Unlike companies that may use a position of power with customers to accelerate collections, Silicon Graphics’ diminished health compelled it to offer discounts to induce early payments. Consider the disclosure shown here from the company’s September 2005 10-Q. Also, notice another cash management trick that Silicon Graphics was playing—holding vendor payments and buying inventory at the end of the quarter—to show cash on its Balance Sheet at its highest point on the last day of the quarter. Diligent investors would have noticed these issues and known that disaster was not far away.
Be Wary of Dramatic Improvements in CFFO
Chinese telecom equipment manufacturer UTStarcom reported markedly improved CFFO in early 2008. After a dismal 2007, in which it logged four consecutive quarters of negative CFFO (for a total cash burn of $218 million), the company suddenly reported positive cash flow of $97 million in March 2008. Investors could have readily noticed that the cash flow turnaround resulted from a variety of particularly aggressive working capital actions. A quick peek at the Balance Sheet revealed a $65 million drop in accounts receivable and a $66 million increase in accounts payable. The 10-Q gave more insight and mentioned one of those “management decisions” we warned you about in Chapter 10, “Cash Flow Shenanigan No. 1, Shifting Financing Cash Inflows to the Operating Section,” with the infamous Computer Associates. (See the accompanying disclosure from UTStarcom’s March 2008 10-Q.)
UTStarcom proceeded to report negative operating cash flow throughout the rest of 2008. Despite the $97 million in positive CFFO during the first quarter, the company ended the year in a hole, having burned through $55 million in operating cash flow.
TIP
While many investors are pleased when management says that it is “aggressively managing working capital,” you should take this as a warning sign that recent CFFO growth may not be sustainable.
3. Boosting CFFO by Purchasing Less Inventory
Home Depot, as you recall, received an unsustainable CFFO boost in 2001 from stretching out payments to vendors. Well, the company had another CFFO-improving trick up its sleeve: purchasing less inventory.
Earlier in this chapter, we discussed how Bob Nardelli doubled Home Depot’s operating cash flow in his first year on the job by stretching out vendor payables and reducing the amount of inventory at each store. Home Depot lowered its inventory levels simply by not restocking shelves after goods had been sold. In other words, the company just did not purchase as much inventory from vendors as in previous years.
In much the same way that Nardelli’s Home Depot “cosmetically” improved CFFO (by paying vendors more slowly), a company choosing to purchase less inventory would also provide an artificial and unsustainable boost to CFFO. Let’s revisit Home Depot’s Statement of Cash Flows in Table 12-1 to see the inventory swing from an outflow of $1.1 billion in 2000 to an outflow of only $166 million in 2001 (and then back to an outflow of $1.6 billion in 2002 as the benefit reversed).
To be fair, Home Depot was very clear in its disclosure under the Liquidity and Capital Resources section of its 10-K filing, stating that CFFO growth primarily had been driven by an extension of payables and a decrease in inventory per store (see the disclosure in the accompanying box). Investors would be well served by reading through the entire document, because such important nuggets of information can be found deep inside the filing.
In the next year, Home Depot did not benefit from a decrease in inventory. However, it provided a good spin on this in the Liquidity and Capital Resources section, suggesting that it had pared back inventory too much in the previous year.
TIP
Buried in the 10-Qs and 10-Ks is some extra insight about the drivers of cash flow. It is one of the most important sections of the filing, but many investors don’t know it exists. To find it, turn to the Management Discussion and Analysis (MD&A)—in a section often called “Liquidity and Capital Resources.” This section is a must-read for every company you analyze.
Watch for Disclosure About Timing of Inventory Purchases Within Each Quarter
Silicon Graphics purchased inventory at the very beginning of each quarter and then worked it down as much as possible by the end of the period, only to purchase more once the quarter closed. (See the 10-Q disclosure in our earlier discussion on Silicon Graphics.) As with its receivables and payables management schemes, the company used this strategy to manipulate investor perceptions that its liquidity was adequate while it was teetering on the brink of bankruptcy.
4. Boosting CFFO with One-Time Benefits
Microsoft doled out billions of dollars to settle antitrust litigation between 2004 and 2007. One of the largest recipients, Sun Microsystems, pocketed nearly $2 billion from Microsoft in 2004 ($1.6 billion of which was immediately recognized as income). Sun presented this large one-time item in plain view on its Statement of Operations, listing it separately as “settlement income.” Sun’s disclosure made it very easy for investors to understand that the income from this settlement was nonrecurring and unrelated to its normal operations; it was reported “below the line” as nonoperating income.
Sun’s Statement of Cash Flows, however, was less clear. The company recorded the $2 billion in cash as an operating inflow (as is appropriate under the indirect method), but it was not listed separately on the SCF; rather, it was simply bundled with net income. As you would imagine, a $2 billion settlement was quite material to Sun’s results—CFFO for all of 2004 was $2.2 billion, up from $1.0 billion in 2003. Diligent investors would have noticed this settlement reflected on the Statement of Operations and immediately realized that it was an unsustainable source of CFFO.
TIP
Nonrecurring boosts to CFFO often are not plainly disclosed on the Statement of Cash Flows. Whenever you spot any kind of one-time earnings benefit, ask yourself, “How does this boost affect the Statement of Cash Flows?”
Looking Ahead
This completes our unit on Cash Flow Shenanigans—techniques used to inflate operating cash flows. In aggregate, Parts Two and Three focused on gimmicks that impress investors with either higher reported earnings or operating cash flows. In Part Four, we show how accounting tricks may also contaminate management’s non-GAAP metrics and key performance indicators.