You can be right on every one of the factors in the last six chapters, but if you’re wrong about the direction of the general market, and that direction is down, three out of four of your stocks will plummet along with the market averages, and you will lose money big time, as many people did in 2000 and again in 2008. Therefore, in your analytical tool kit, you absolutely must have a proven, reliable method to accurately determine whether you’re in a bull (uptrending) market or a bear (downtrending) market. Very few investors or stockbrokers have such an essential tool. Many investors depend on someone else to help them with their investments. Do these other advisors or helpers have a sound set of rules to determine when the general market is starting to get into trouble?
That’s not enough, however. If you’re in a bull market, you need to know whether it’s in the early stage or a later stage. And more importantly, you need to know what the market is doing right now. Is it weak and acting badly, or is it merely going through a normal intermediate decline (typically 8% to 12%)? Is it doing just what it should be, considering the basic current conditions in the country, or is it acting abnormally strong or weak? To answer these and other vital questions, you’ll want to learn to analyze the overall market correctly, and to do that, you must start at the most logical point.
The market direction method we discovered and developed many years ago is such a key element in successful investing you’ll want to reread this chapter several times until you understand and can apply it on a day-to-day basis for the rest of your investment life. If you learn to do this well, you should never in the future find your investment portfolio down 30% to 50% or more in a bad bear market.
The best way for you to determine the direction of the market is to look carefully at, follow, interpret, and understand the daily charts of the three or four major general market averages and what their price and volume changes are doing on a day-to-day basis. This might sound intimidating at first, but with patience and practice, you’ll soon be analyzing the market like a true pro. This is the most important lesson you can learn if you want to stop losing and start winning. Are you ready to get smarter? Are your future peace of mind and financial independence worth some extra effort and determination on your part?
Don’t ever let anyone tell you that you can’t time the market. This is a giant myth passed on mainly by Wall Street, the media, and those who have never been able to do it, so they think it’s impossible. We’ve heard from thousands of readers of this chapter and Investor’s Business Daily’s The Big Picture column who have learned how to do it. They took the time to read the rules and do their homework so that they were prepared and knew exactly what facts to look for. As a result, they had the foresight and understanding to sell stocks and raise cash in March 2000 and from November 2007 to January 2008 and June 2008, protecting much of the gains they made during 1998 and 1999 and in the strong five-year Bush bull market in stocks that lasted from March 2003 to June 2008.
The erroneous belief that you can’t time the market—that it’s simply impossible, that no one can do it—evolved more than 40 years ago after a few mutual fund managers tried it unsuccessfully. They had to both sell at exactly the right time and then get back into the market at exactly the right time. But because of their asset size problems, and because they had no system, it took a number of weeks for them to believe the turn and finally reenter the market. They relied on their personal judgments and feelings to determine when the market finally hit bottom and turned up for real. At the bottom, the news is all negative. So these managers, being human, hesitated to act. Their funds therefore lost some relative performance during the fast turnarounds that frequently happen at market bottoms.
For this reason, and despite the fact that twice in the 1950s, Jack Dreyfus successfully raised cash in his Dreyfus Fund at the start of a bear market, top management at most mutual funds imposed rigid rules on money managers that required them to remain fully invested (95% to 100% of assets). This possibly fits well with the sound concept that mutual funds are truly long-term investments. Also, because funds are typically widely diversified (owning a hundred or more stocks spread among many industries), in time they will always recover when the market recovers. So owning them for 15 or 20 years has always been extremely rewarding in the past and should continue to be in the future. However, you, as an individual investor owning 5, 10, or 20 stocks, don’t have a large size handicap. Some of your stocks can drop substantially and maybe never come back or take years to do so. Learning when it’s wise to raise cash is very important for you … so study and learn how to successfully use this technique to your advantage.
The general market is a term referring to the most commonly used market indexes. These broad indexes tell you the approximate strength or weakness in each day’s overall trading activity and can be one of your earliest indications of emerging trends. They include
• The Standard & Poor’s (S&P) 500. Consisting of 500 companies, this index is a broader, more modern representation of market action than the Dow.
• The Nasdaq Composite. This has been a somewhat more volatile and relevant index in recent years. The Nasdaq is home to many of the market’s younger, more innovative, and faster-growing companies that trade via the Nasdaq network of market makers. It’s a little more weighted toward the technology sector.
• The Dow Jones Industrial Average (DJIA). This index consists of 30 widely traded big-cap stocks. It used to focus primarily on large, cyclical, industrial issues, but it has broadened a little in recent years to include companies such as Coca-Cola and Home Depot. It’s a simple but rather out-of-date average to study because it’s dominated by large, established, old-line companies that grow more slowly than today’s more entrepreneurial concerns. It can also be easily manipulated over short time periods because it’s limited to only 30 stocks.
• The NYSE Composite. This is a market-value-weighted index of all stocks listed on the New York Stock Exchange.
All these key indexes are shown in Investor’s Business Daily in large, easy-to-analyze charts that also feature a moving average and an Accumulation/Distribution Rating (ACC/DIS RTG®) for each index. The Accumulation/Distribution Rating tells you if the index has been getting buying support recently or is undergoing significant selling. I always try to check these indexes every day because a key change can occur over just a few weeks, and you don’t want to be asleep at the switch and not see it. IBD’s “The Big Picture” column also evaluates these indexes daily to materially help you in deciphering the market’s current condition and direction.
A Harvard professor once asked his students to do a special report on fish. His scholars went to the library, read books about fish, and then wrote their expositions. But after turning in their papers, the students were shocked when the professor tore them up and threw them in the wastebasket.
When they asked him what was wrong with the reports, the professor said, “If you want to learn anything about fish, sit in front of a fishbowl and look at fish.” He made his students sit and watch fish for hours. Then they rewrote their assignment solely on their observations of the objects themselves.
Being a student of the market is like being a student in this professor’s class: if you want to learn about the market, you must observe and study the major indexes carefully. In doing so, you’ll come to recognize when the daily market averages are changing at key turning points—such as major market tops and bottoms—and learn to capitalize on this with real knowledge and confidence.
There’s an important lesson here. To be highly accurate in any pursuit, you must observe and analyze the objects themselves carefully. If you want to know about tigers, you need to watch tigers—not the weather, not the vegetation, and not the other animals on the mountain.
Years ago, when Lou Brock set his mind to breaking baseball’s stolen base record, he had all the big-league pitchers photographed with high-speed film from the seats behind first base. Then he studied the film to learn what part of each pitcher’s body moved first when he threw to first base. The pitcher was the object that Brock was trying to beat, so it was the pitchers themselves that he studied in great detail.
In the 2003 Super Bowl, the Tampa Bay Buccaneers were able to intercept five Oakland Raider passes by first studying and then concentrating on the eye movements and body language of Oakland’s quarterback. They “read” where he was going to throw.
Christopher Columbus didn’t accept the conventional wisdom about the earth being flat because he himself had observed ships at sea disappearing over the horizon in a way that told him otherwise. The government uses wiretaps, spy planes, unmanned drones, and satellite photos to observe and analyze objects that could threaten our security. That’s how we discovered Soviet missiles in Cuba.
It’s the same with the stock market. To know which way it’s going, you must observe and analyze the major general market indexes daily. Don’t ever, ever ask anyone: “What do you think the market’s going to do?” Learn to accurately read what the market is actually doing each day as it is doing it.
Recognizing when the market has hit a top or has bottomed out is frequently 50% of the whole complicated investment ball game. It’s also the key investing skill virtually all investors, whether amateur or professional, seem to lack. In fact, Wall Street analysts completely missed calling the market top in 2000, particularly the tops in every one of the high-technology leaders. They didn’t do much better in 2008.
We conducted four surveys of IBD subscribers in 2008 and also received hundreds of letters from subscribers that led us to believe that 60% of IBD readers sold stock and raised cash in either December 2007 or June 2008 with the help of “The Big Picture” column and by applying and acting on our rule about five or six distribution days over any four- or five-week period. They preserved their capital and avoided the brunt of the dramatic and costly market collapse in the fall of 2008 that resulted from excessive problems in the market for subprime mortgage real estate loans (which had been sponsored and strongly encouraged by the government). You may have seen some of our subscribers’ comments in IBD at the top of a page space titled “You Can Do It Too.” You’ll learn exactly how to apply IBD’s general market distribution rules later in this chapter.
The winning investor should understand how a normal business cycle unfolds and over what period of time. The investor should pay particular attention to recent cycles. There’s no guarantee that just because cycles lasted three or four years in the past, they’ll last that long in the future.
Bull and bear markets don’t end easily. It usually takes two or three tricky pullbacks up or down to fake out or shake out the few remaining speculators. After everyone who can be run in or run out has thrown in the towel, there isn’t anyone left to take action in the same market direction. Then the market will finally turn and begin a whole new trend. Most of this is crowd psychology constantly at work.
Bear markets usually end while business is still in a downtrend. The reason is that stocks are anticipating, or “discounting,” all economic, political, and worldwide events many months in advance. The stock market is a leading economic indicator, not a coincident or lagging indicator, in our government’s series of key economic indicators. The market is exceptionally perceptive, taking all events and basic conditions into account. It will react to what is taking place and what it can mean for the nation. The market is not controlled by Wall Street. Its action is determined by lots of investors all across the country and thousands of large institutions and is a consensus conclusion on whether it likes or doesn’t like what it foresees—such as what our government is doing or about to do and what the consequences could be.
Similarly, bull markets usually top out and turn down before a recession sets in. For this reason, looking at economic indicators is a poor way to determine when to buy or sell stocks and is not recommended. Yet, some investment firms do this very thing.
The predictions of many economists also leave a lot to be desired. A few of our nation’s presidents have had to learn this lesson the hard way. In early 1983, for example, just as the economy was in its first few months of recovery, the head of President Reagan’s Council of Economic Advisers was concerned that the capital goods sector was not very strong. This was the first hint that this advisor might not be as sound as he should be. Had he understood historical trends, he would have seen that capital goods demand has never been strong in the early stage of a recovery. This was especially true in the first quarter of 1983, when U.S. plants were operating at a low percentage of capacity.
You should check earlier cycles to learn the sequence of industry-group moves at various stages of the market cycle. If you do, you’ll see that railroad equipment, machinery, and other capital goods industries are late movers in a business or stock market cycle. This knowledge can help you get a fix on where you are now. When these groups start running up, you know you’re near the end. In early 2000, computer companies supplying Internet capital goods and infrastructure were the last-stage movers, along with telecommunications equipment suppliers.
Dedicated students of the market who want to learn more about cycles and the longer-term history of U.S. economic growth may want to write to Securities Research Company, 27 Wareham Street, #401, Boston, MA 02118, and purchase one of the company’s long-term wall charts. Also, in 2008, Daily Graphs, Inc., created a 1900 to 2008 stock market wall chart that shows major market and economic events.
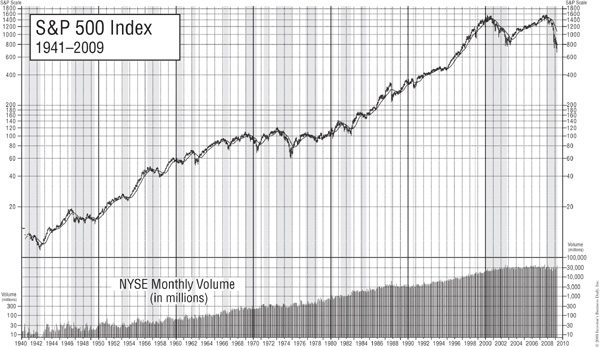
Some charts of market averages also include major news events over the last 12 months. These can be very valuable, especially if you keep and review back copies. You then have a history of both the market averages and the events that have influenced their direction. It helps to know, for example, how the market has reacted to new faces in the White House, rumors of war, controls on wages and prices, changes in discount rates, or just loss of confidence and “panics” in general. The accompanying chart of the S&P 500 Index shows several past cycles with the bear markets shaded.
In bear markets, stocks usually open strong and close weak. In bull markets, they tend to open weak and close strong. The general market averages need to be checked every day, since reverses in trends can begin on any given few days. Relying on these primary indexes is a more direct, practical, and effective method for analyzing the market’s behavior and determining its direction.
Don’t rely on other, subsidiary indicators because they haven’t been proven to be effective at timing. Listening to the many market newsletter writers, technical analysts, or strategists who pore over 30 to 50 different technical or economic indicators and then tell you what they think the market should be doing is generally a very costly waste of time. Investment newsletters can create doubt and confusion in an investor’s mind. Interestingly enough, history shows that the market tends to go up just when the news is all bad and these experts are most skeptical and uncertain.
When the general market tops, you must sell to raise at least some cash and to get off margin (the use of borrowed money) to protect your account. As an individual investor, you can easily raise cash and get out in one or two days, and you can likewise reenter later when the market is finally right. If you don’t sell and raise cash when the general market tops, your diversified list of former market leaders can decline sharply. Several of them may never recover to their former levels.
Your best bet is to learn to interpret daily price and volume charts of the key general market averages. If you do, you can’t get too far off-track, and you won’t need much else. It doesn’t pay to argue with the market. Experience teaches that second-guessing the market can be a very expensive mistake.
The combination of the Watergate scandal and hearings and the 1974 oil embargo by OPEC made 1973–1974 the worst stock market catastrophe up to that time since the 1929–1933 depression. The Dow corrected 50%, but the average stock plummeted more than 70%.
This was a big lesson for stockholders and was almost as severe as the 90% correction the average stock showed from 1929 to 1933. However, in 1933, industrial production was only 56% of the 1929 level, and more than 13 million Americans were unemployed. The peak unemployment rate in the 1930s was 25%. It remained in double digits throughout the entire decade and was 20% in 1939.
The markets were so demoralized in the prolonged 1973–1974 bear market that most members on the floor of the New York Stock Exchange were afraid the exchange might not survive as a viable institution. This is why it’s absolutely critical that you study the market averages and learn how to protect yourself against catastrophic losses, for the sake of your health as well as your portfolio.
The critical importance of knowing the change in direction of the general market cannot be overemphasized. If you have a 33% loss in a stock portfolio, you need a 50% gain just to get back to breakeven. If, for example, you let a $10,000 portfolio drop to $6,666 (a 33% decline), it has to rise $3,333 (or 50%) just to get you back where you started. In the 2007–2009 bear market, the S&P 500 fell 58%, meaning that a 140% rebound will be needed for the index to fully recover. And how easy is it for you to make 140%? Maybe it’s time for you to learn what you’re doing, adopt new selling rules and methods, and stop doing the things that create 50% losses.
You positively must always act to preserve as much as possible of the profit you’ve built up during a bull market rather than ride your investments back down through difficult bear market periods. To do this, you must learn historically proven stock and general market selling rules. (See Chapters 10 and 11 for more on selling rules.)
Many investors like to think of, or at least describe, themselves as “long-term investors.” Their strategy is to stay fully invested through thick and thin. Most institutions do the same thing. But such an inflexible approach can have tragic results, particularly for individual investors. Individuals and institutions alike may get away with standing pat through relatively mild (25% or less) bear markets, but many bear markets are not mild. Some, such as 1973–1974, 2000–2002, and 2007–2008, are downright devastating.
The challenge always comes at the beginning, when you start to sense an impending bear market. In most cases, you cannot project how bad economic conditions might become or how long those bad conditions could linger. The war in Vietnam, inflation, and a tight money supply helped turn the 1969–1970 correction into a two-year decline of 36.9%. Before that, bear markets averaged only nine months and took the averages down 26%.
Most stocks fall during a bear market, but not all of them recover. If you hold on during even a modest bear correction, you can get stuck with damaged merchandise that may never see its former highs. You definitely must learn to sell and raise at least some cash when the overall environment changes and your stocks are not working.
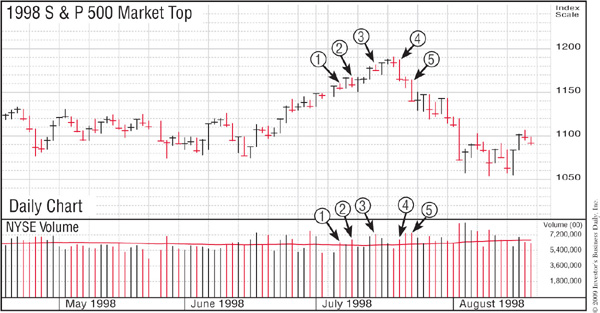
Buy-and-hold investors fell in love with Coca-Cola during the 1980s and 1990s. The soft-drink giant chugged higher year after year, rising and falling with the market. But it stopped working in 1998, as did Gillette, another favorite of long-term holders. When the market slipped into its mild bear correction that summer, Coke followed along. Two years later—after some of the market’s most exciting gains in decades—Coke was still stuck in a downtrend. In some instances, stocks of this kind may come back. But this much is certain: Coke investors missed huge advances in 1998 and 1999 in names such as America Online and Qualcomm.
The buy-and-hold strategy was also disastrous to anyone who held technology stocks from 2000 through 2002. Many highfliers lost 75% to 90% of their value, and some may never return to their prior highs. Take a look now at Time Warner, Corning, Yahoo!, Intel, JDS Uniphase, and EMC, former market leaders in 1998–2000.
Napoleon once wrote that never hesitating in battle gave him an advantage over his opponents, and for many years he was undefeated. In the battlefield that is the stock market, there are the quick and there are the dead!
After you see the first several definite indications of a market top, don’t wait around. Sell quickly before real weakness develops. When market indexes peak and begin major downside reversals, you should act immediately by putting 25% or more of your portfolio in cash, selling your stocks at market prices. The use of limit orders (buying or selling at a specific price, rather than buying or selling at market prices using market orders) is not recommended. Focus on your ability to get into or out of a stock when you need to. Quibbling over an eighth- or quarter-point (or their decimal equivalents) could make you miss an opportunity to buy or sell a stock.
Lightning-fast action is even more critical if your stock account is on margin. If your portfolio is fully margined, with half of the money in your stocks borrowed from your broker, a 20% decline in the price of your stocks will cause you to lose 40% of your money. A 50% decline in your stocks could wipe you out! Never, ever try to ride through a bear market on margin.
In the final analysis, there are really only two things you can do when a new bear market begins: sell and retreat or go short. When you retreat, you should stay out until the bear market is over. This usually means five or six months or more. In the prolonged, problem-ridden 1969–1970 and 1973–1974 periods, however, it meant up to two years. The bear market that began in March 2000 during the last year of the Clinton administration lasted longer and was far more severe than normal. Nine out of ten investors lost a lot of money, particularly in high-tech stocks. It was the end of a period of many excesses during the late 1990s, a decade when America got careless and let down its guard. It was the “anything goes” period, with stocks running wild.
Selling short can be profitable, but be forewarned: it’s a very difficult and highly specialized skill that should be attempted only during bear markets. Few people make money at it. Short selling is discussed in more detail in Chapter 12.
If you use stop-loss orders or mentally record a selling price and act upon it, a market that is starting to top out will mechanically force you, robotlike, out of many of your stocks. A stop-loss order instructs the specialist in the stock on the exchange floor that once the stock has dropped to your specified price, the order becomes a market order, and the stock will be sold out on the next transaction.
It’s usually better not to enter stop-loss orders. In doing so, you and other similarly minded investors are showing your hand to market makers, and at times they might drop the stock to shake out stop-loss orders. Instead, watch your stocks closely and know ahead of time the exact price at which you will immediately sell to cut a loss. However, some people travel a lot and aren’t able to watch their stocks closely, and others have a hard time making sell decisions and getting out when they are losing. In such cases, stop-loss orders help compensate for distance and indecisiveness.
If you use a stop-loss order, remember to cancel it if you change your mind and sell a stock before the order is executed. Otherwise, you could later accidentally sell a stock that you no longer own. Such errors can be costly.
To detect a market top, keep a close eye on the daily S&P 500, NYSE Composite, Dow 30, and Nasdaq Composite as they work their way higher. On one of the days in the uptrend, volume for the market as a whole will increase from the day before, but the index itself will show stalling action (a significantly smaller price increase for the day compared with the prior day’s much larger price increase). I call this “heavy volume without further price progress up.” The average doesn’t have to close down for the day, but in most instances it will, making the distribution (selling) much easier to see, as professional investors liquidate stock. The spread from the average’s daily high to its daily low may in some cases be a little wider than on previous days.
Normal liquidation near the market peak will usually occur on three to six specific days over a period of four or five weeks. In other words, the market comes under distribution while it’s advancing! This is one reason so few people know how to recognize distribution. After four or five days of definite distribution over any span of four or five weeks, the general market will almost always turn down.
Four days of distribution, if correctly spotted over a two- or three-week period, are sometimes enough to turn a previously advancing market into a decline. Sometimes distribution can be spread over six weeks if the market attempts at some point to rally back to new highs. If you are asleep or unaware and you miss the topping signals given off by the S&P 500, the NYSE Composite, the Nasdaq, or the Dow (which is easy to do, since they sometimes occur on only a few days), you could be wrong about the market direction and therefore wrong on almost everything you do.
One of the biggest problems is the time it takes to reverse investors’ positive personal opinions and views. If you always sell and cut your losses 7% or 8% below your buy points, you may automatically be forced to sell at least one or two stocks as a correction in the general market starts to develop. This should get you into a questioning, defensive frame of mind sooner. Following this one simple but powerful rule of ours saved a lot of people big money in 2000’s devastating decline in technology leaders and in the 2008 subprime loan bear market.
It takes only one of the indexes to give you a valid repeated signal of too much distribution. You don’t normally need to see several of the major indexes showing four, five, or six distribution days. Also, if one of the indexes is down for the day on volume larger than the prior day’s volume, it should decline more than 0.2% for this to be counted as a distribution day.
After the required number of days of increased volume distribution around the top and the first decline resulting from this, there will be either a poor rally in the market averages, followed by a rally failure, or a positive and powerful follow-through day up on price and volume. You should learn in detail exactly what signals to look for and remain unbiased about the market. Let the day-by-day averages tell you what the market has been doing and is doing. (See “How You Can Spot Stock Market Bottoms” later in this chapter for a further discussion of market rallies.)
After the market does top out, it typically will rally feebly and then fail. After the first day’s rebound, for instance, the second day will open strongly but suddenly turn down near the end of the session. The abrupt failure of the market to follow through on its first recovery attempt should probably be met with further selling on your part.
You’ll know that the initial bounce back is feeble if (1) the index advances in price on the third, fourth, or fifth rally day, but on volume that is lower than that of the day before, (2) the average makes little net upward price progress compared with its progress the day before, or (3) the market average recovers less than half of the initial drop from its former absolute intraday high. When you see these weak rallies and failures, further selling is advisable.
In October 1999, the market took off on a furious advance. Fears of a Y2K meltdown on January 1, 2000, had faded. Companies were announcing strong profits for the third quarter just ended. Both leading tech stocks and speculative Internet and biotechnology issues racked up huge gains in just five months. But cracks started to appear in early March 2000.
On March 7, the Nasdaq closed lower on higher volume, the first time it had done so in more than six weeks. That’s unusual action during a roaring bull market, but one day of distribution isn’t significant on its own. Still, it was the first yellow flag and was worth watching carefully.
Three days later, the Nasdaq bolted up more than 85 points to a new high in the morning. But it reversed in the afternoon and finished the day up only 2 points on heavy volume that was 13% above average. This was the second warning sign. That churning action (a lot of trading but no real price progress—a clear sign of distribution) was all the more important because leading stocks started showing their own symptoms of hitting climax tops—action that will be discussed in Chapter 11. Just two days later, on March 14, the market closed down 4% on a large volume increase. This was the third major warning signal of distribution and one where you should have been taking some selling action.
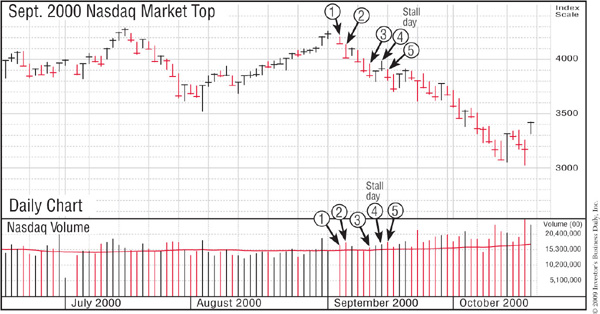
The index managed to put together a suspect rally from March 16 to 24, then stalled again for a fourth distribution day. It soon ran out of steam and rolled over on heavier volume two days later for a fifth distribution day and a final, definite confirmation of the March 10 top. The market itself was telling you to sell, raise cash, and get out of your stocks. All you had to do was read it right and react, instead of listening to your or other people’s opinions. Other people are too frequently wrong and are probably clueless about recognizing or understanding distribution days.
During the next two weeks, the Nasdaq, along with the S&P 500 and the Dow, suffered repeated bouts of distribution as the indexes sold off on heavier volume than on the prior day. Astute CAN SLIM investors who had read, studied, and prepared themselves by knowing exactly what to watch for had long since taken their profits.
Study our chart examples of this and other market tops. History repeats itself when it comes to the stock market; you’ll see this type of action again and again in the future. So get with it.
As mentioned earlier, several surveys showed that approximately 60% of IBD subscribers sold stock in 2008 before the rapid stock market break occurred. IBD’s “The Big Picture” column clearly pointed out in its special Market Pulse box when the market indexes had five distribution days and the outlook had switched to “Market in correction,” and then the column suggested that it was time to raise cash. I’m sure most of those people had read and studied this chapter, including our description of how we retreated from the market in March 2000. They were finally able to use and apply IBD’s general market rules to preserve their gains and not have to undergo the severe declines that can occur when you have no protective rules or methods. And hopefully, those who didn’t follow the rules will be able to better apply them in the future.
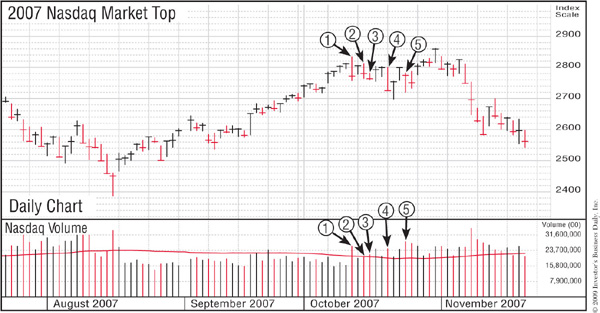
Not much happens by accident in the market. It takes effort on your part to learn what you must know in order to spot each market top. Here’s what Apple CEO Steve Jobs said about effort: “The things I’ve done in my life have required a lot of years of work before they took off.” Annotated market topping charts for the period from the 1976 top to the 2007 top start on page 214. Study them … if you want to survive and win.
Historically, intermediate-term distribution tops (those that are usually followed by 8% to 12% declines in the general market averages) occur as they did during the first week of August 1954. First, there was increased New York Stock Exchange volume without further upward price progress on the Dow Jones Industrials. That was followed the next day by heavy volume without further price progress up and with a wide price spread from high to low on the Dow. Another such top occurred in the first week of July 1955. It was characterized by a price climax with a wide price spread from the day’s low to its high, followed the next day by increased volume with the Dow closing down in price, and then, three days later, increased NYSE volume with the Dow again closing down.
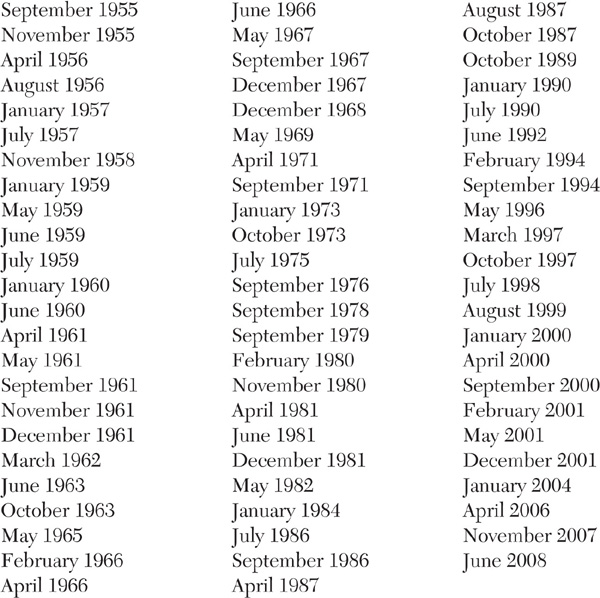
Other bear market and intermediate-term tops for study include
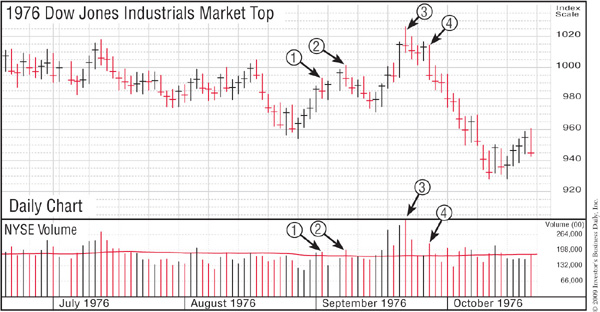
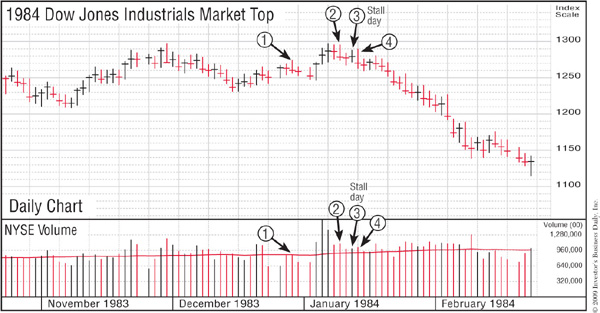
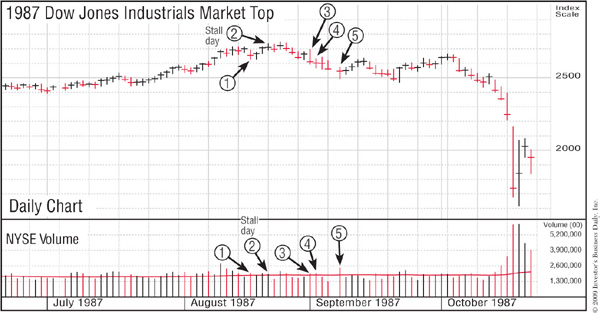
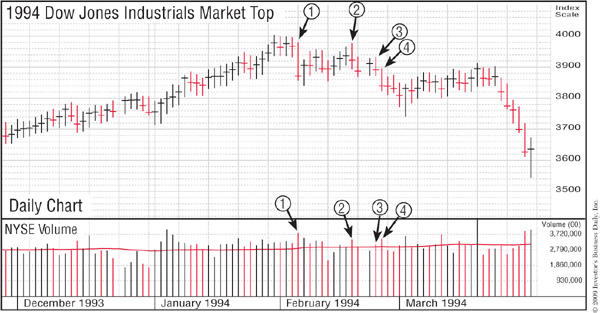
If you study the following daily market average graphs of several tops closely and understand how they came about, you’ll come to recognize the same indications as you observe future market environments. Each numbered day on these charts is a distribution day.
The second most important indicator of a primary change in market direction, after the daily averages, is the way leading stocks act. After the market has advanced for a couple of years, you can be fairly sure that it’s headed for trouble if most of the individual stock leaders start acting abnormally.
One example of abnormal activity can be seen when leading stocks break out of third-or fourth-stage chart base formations on the way up. Most of these base structures will be faulty, with price fluctuations appearing much wider and looser. A faulty base (wide, loose, and erratic) can best be recognized and analyzed by studying charts of a stock’s daily or weekly price and volume history.
Another sign of abnormal activity is the “climax” top. Here, a leading stock will run up more rapidly for two or three weeks in a row, after having advanced for many months. (See Chapter 11 on selling.)
A few leaders will have their first abnormal price break off the top on heavy volume but then be unable to rally more than a small amount from the lows of their correction. Still others will show a serious loss of upward momentum in their most recent quarterly earnings reports.
Shifts in market direction can also be detected by reviewing the last four or five stock purchases in your own portfolio. If you haven’t made a dime on any of them, you could be picking up signs of a new downtrend.
Investors who use charts and understand market action know and understand that very few leading stocks are attractive around market tops. There simply aren’t any stocks coming out of sound, properly formed chart bases. The best merchandise has been bought, played, and well picked over.
Most bases will be wide and loose—a big sign of real danger that you must learn to understand and obey. All that’s left to show strength at this stage are laggard stocks. The sight of sluggish or low-priced, lower-quality laggards strengthening is a signal to the wise market operator the up market may be near its end. Even turkeys can try to fly in a windstorm.
During the early phase of a bear market, certain leading stocks will seem to be bucking the trend by holding up in price, creating the impression of strength, but what you’re seeing is just a postponement of the inevitable. When they raid the house, they usually get everyone, and eventually all the leaders will succumb to the selling. This is exactly what happened in the 2000 bear market. Cisco and other high-tech leaders all eventually collapsed in spite of the many analysts who incorrectly said that they should be bought.
That’s also what happened at the top of the Nasdaq in June and July of 2008. The steels, fertilizers, and oils that had led the 2003–2007 bull market all rolled over and finally broke down after they appeared to be bucking the overall market top that actually began with at least five distribution days in October of 2007. U.S. Steel tanked even though its next two quarterly earnings reports were up over 100%. Potash topped when its current quarter was up 181% and its next quarter was up 220%. This fooled most analysts, who were focused on the big earnings that had been reported or were expected. They had not studied all past historical tops and didn’t realize that many past leaders had topped when earnings were up 100%. Why did these stocks finally cave in? They were in a bear market that had begun eight months earlier, in late 2007.
Market tops, whether intermediate (8% to 12% declines) or primary bull market peaks, sometimes occur five, six, or seven months after the last major buy point in leading stocks and in the averages. Thus, top reversals (when the market closes at the bottom of its trading range after making a new high that day) are usually late signals—the last straw before a cave-in. In most cases, distribution, or selling, has been going on for days or even weeks in individual market leaders. Use of individual stock selling rules, which we’ll discuss in Chapters 10 and 11, should already have led you to sell one or two of your holdings on the way up, just before the market peak.
If the original market leaders begin to falter, and lower-priced, lower-quality, more-speculative stocks begin to move up, watch out! When the old dogs begin to bark, the market is on its last feeble leg. Laggards can’t lead the market higher. Among the telltale signs are the poor-quality stocks that start to dominate the most-active list on market “up” days. This is simply a matter of weak leadership trying to command the market. If the best ones can’t lead, the worst certainly aren’t going to do so for very long.
Many top reversals have occurred between the third and the ninth day of a rally after the averages moved into new high ground off short chart bases (meaning that the time span from the start to the end of the pattern was really too short). It’s important to note that the conditions under which the tops occurred were all about the same.
At other times, a topping market will recover for a couple of months and get back nearly to its old high or even above it before breaking down in earnest. This occurred in December 1976, January 1981, and January 1984. There’s an important psychological reason for this: the majority of people in the market can’t be exactly right at exactly the right time. In 1994, the Nasdaq didn’t top until weeks after the Dow did. A similar thing happened in early 2000.
The majority of people in the stock market, including both professional and individual investors, will be fooled first. It’s all about human psychology and emotions. If you were smart enough to sell or sell short in January 1981, the powerful rebound in February and March probably forced you to cover your short sales at a loss or buy some stocks back during the strong rally. It was an example of how treacherous the market really can be at turning points.
I didn’t have much problem recognizing and acting upon the early signs of the many bear markets from 1962 through 2008. But a few times I made the mistake of buying back too early. When you make a mistake in the stock market, the only sound thing to do is to correct it. Don’t fight it. Pride and ego never pay off; neither does vacillation when losses start to show up.
The typical bear market (and some aren’t typical) usually has three separate phases, or legs, of decline interrupted by a couple of rallies that last just long enough to convince investors to begin buying. In 1969 and 1974, a few of these phony, drawn-out rallies lasted up to 15 weeks. Most don’t last that long.
Many institutional investors love to “bottom fish.” They’ll start buying stocks off a supposed bottom and help make the rally convincing enough to draw you in. You’re better off staying on the sidelines in cash until a new bull market really starts.
Once you’ve recognized a bear market and have scaled back your stock holdings, the big question is how long you should remain on the sidelines. If you plunge back into the market too soon, the apparent rally may fade, and you’ll lose money. But if you hesitate at the brink of the eventual roaring recovery, opportunities will pass you by. Again, the daily general market averages provide the best answer by far. Markets are always more reliable than most investors’ emotions or personal opinions.
At some point in every correction—whether that correction is mild or severe—the stock market will always attempt to rally. Don’t jump back in right away. Wait for the market itself to confirm the new uptrend.
A rally attempt begins when a major market average closes higher after a decline that happened either earlier in the day or during the previous session. For example, the Dow plummets 3% in the morning but then recovers later in the day and closes higher. Or the Dow closes down 2% and then rebounds the next day. We typically call the session in which the Dow finally closes higher the first day of the attempted rally, although there have been some exceptions. For example, the first day of the early October market bottom in 1998 was actually down on heavy volume, but it closed in the upper half of that day’s price range. Sit tight and be patient. The first few days of improvement can’t tell you whether the rally will succeed.
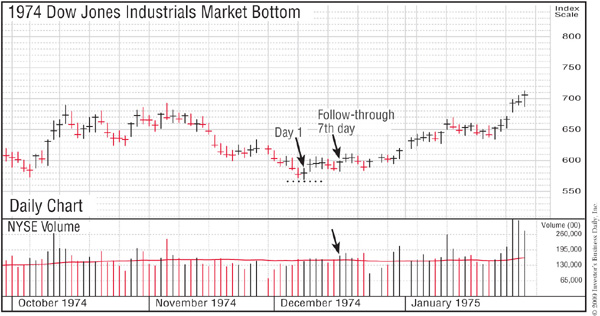
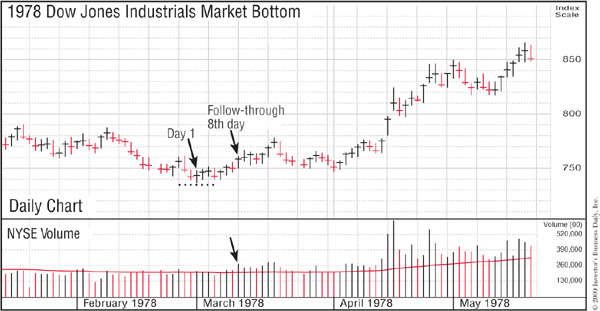
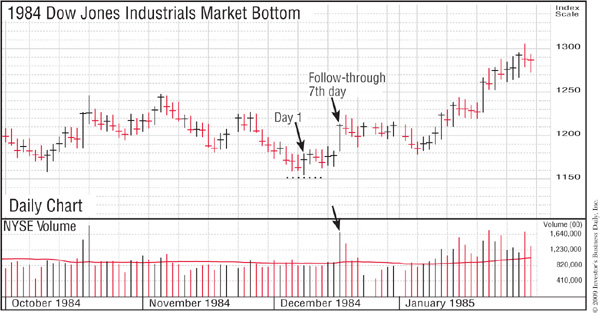
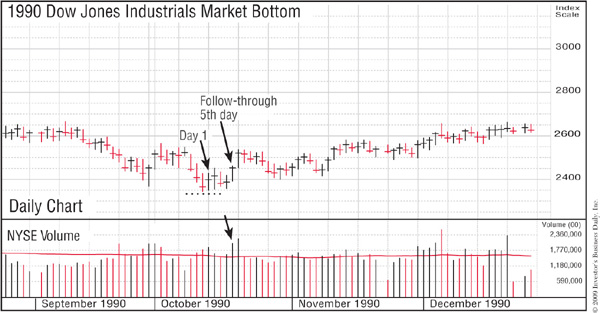
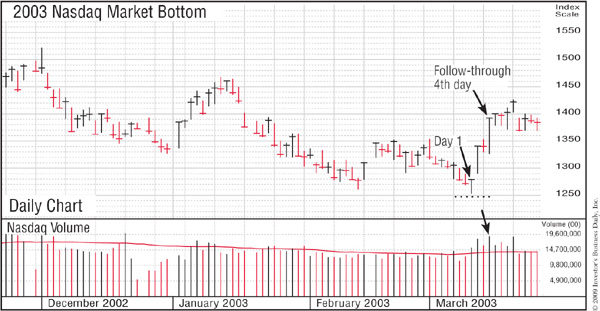
Starting on the fourth day of the attempted rally, look for one of the major averages to “follow through” with a booming gain on heavier volume than the day before. This tells you the rally is far more likely to be real. The most powerful follow-throughs usually occur on the fourth to seventh days of the rally. The 1998 bottom just mentioned followed through on the sixth day of the attempted rally. The market was up 2.1%. A follow-through day should give the feeling of an explosive rally that is strong, decisive, and conclusive—not begrudging and on the fence or barely up 1½%. The market’s volume for the day should in most cases be above its average daily volume, in addition to always being higher than the prior day’s trading.
Occasionally, but rarely, a follow-through occurs as early as the third day of the rally. In such a case, the first, second, and third days must all be very powerful, with a major average up 1½% to 2% or more each session in heavy volume.
I used to consider 1% to be the percentage increase for a valid follow-through day. However, in recent years, as institutional investors have learned of our system, we’ve moved the requirement up a significant amount for the Nasdaq and the Dow. By doing this, we are trying to minimize the possibility that professionals will manipulate a few of the 30 stocks in the Dow Jones average to create false or faulty follow-through days.
There will be cases in which confirmed rallies fail. A few large institutional investors, armed with their immense buying power, can run up the averages on a particular day and create the impression of a follow-through. Unless the smart buyers are getting back on board, however, the rally will implode—sometimes crashing on heavy volume within the next several days.
However, just because the market corrects the day after a follow-through doesn’t mean the follow-through was false. When a bear market bottoms, it frequently pulls back and settles above or near the lows made during the previous few weeks. It is more constructive when these pullbacks or “tests” hold at least a little above the absolute intraday lows made recently in the market averages.
A follow-through signal doesn’t mean you should rush out and buy with abandon. It just gives you the go-ahead to begin buying high-quality stocks with strong sales and earnings as they break out of sound price bases, and it is a vital second confirmation the attempted rally is succeeding.
Remember, no new bull market has ever started without a strong price and volume follow-through confirmation. It pays to wait and listen to the market and act on what it tells you. The following graphs are examples of seven bottoms in the stock market between 1974 and 2003.
The really big money is usually made in the first one or two years of a normal new bull market cycle. It is during this period that you must always recognize, and fully capitalize upon, the golden opportunities presented.
The rest of the “up” cycle usually consists of back-and-forth movement in the market averages, followed by a bear market. The year 1965 was one of the few exceptions, but that strong market in the third year of a new cycle was caused by the beginning of the Vietnam War.
In the first or second year of a new bull market, there should be a few intermediate-term declines in the market averages. These usually last a couple of months, with the market indexes dropping by from 8% to an occasional 12% or 15%. After several sharp downward adjustments of this nature, and after at least two years of a bull market have passed, heavy volume without further upside progress in the daily market averages could indicate the early beginning of the next bear market.
Since the market is governed by supply and demand, you can interpret a chart of the general market averages about the same way you read the chart of an individual stock. The Dow Jones Industrial Average and the S&P 500 are usually displayed in the better publications. Investor’s Business Daily displays the Nasdaq Composite, the New York Stock Exchange Composite, and the S&P 500, with large-size daily price and volume charts stacked one on top of the other for ease of comparing the three. These charts should show the high, low, and close of the market averages day by day for at least six months, together with the daily NYSE and Nasdaq volume in millions of shares traded.
Incidentally, when I began in the market about 50 years ago, an average day on the New York Stock Exchange was 3.5 million shares. Today, 1.5 billion shares are traded on average each day—an incredible 150-fold increase that clearly demonstrates beyond any question the amazing growth and success of our free enterprise, capitalist system. Its unparalleled freedom and opportunity have consistently attracted millions of ambitious people from all around the world who have materially increased our productivity and inventiveness. It has led to an unprecedented increase in our standard of living, so that the vast majority of Americans and all areas of our population are better off than they were before. There are always problems that need to be recognized and solved. But our system is the most successful in the world, and it offers remarkable opportunities to grow and advance to those who are willing to work, train, and educate themselves. The 100 charts in Chapter 1 are only a small sample of big past investment opportunities.
Normal bear markets show three legs of price movement down, but there’s no rule saying you can’t have four or even five down legs. You have to evaluate overall conditions and events in the country objectively and let the market averages tell their own story. And you have to understand what that story is.
Several averages should be checked at market turning points to see if there are significant divergences, meaning that they are moving in different directions (one up and one down) or that one index is advancing or declining at a much greater rate than another.
For example, if the Dow is up 100 and the S&P 500 is up only the equivalent of 20 on the Dow for the day (the S&P 500 being a broader index), it would indicate the rally is not as broad and strong as it appears. To compare the change in the S&P 500 to that in the Dow, divide the S&P 500 into the Dow average and then multiply by the change in the S&P 500.
For example, if the Dow closed at 9,000 and the S&P 500 finished at 900, the 9,000 Dow would be 10 times the S&P 500. Therefore, if the Dow, on a particular day, is up 100 points and the S&P 500 is up 5 points, you can multiply the 5 by 10 and find that the S&P 500 was up only the equivalent of 50 points on the Dow.
The Dow’s new high in January 1984 was accompanied by a divergence in the indexes: the broader-based, more significant S&P 500 did not hit a new high. This is the reason most professionals plot the key indexes together—to make it easier to spot nonconfirmations at key turning points. Institutional investors periodically run up the 30-stock Dow while they liquidate the broader Nasdaq or a list of technology stocks under cover of the Dow run-up. It’s like a big poker game, with players hiding their hands, bluffing, and faking.
Now that trading in put and call options is the get-rich-quick scheme for many speculators, you can plot and analyze the ratio of calls to puts for another valuable insight into crowd temperament. Options traders buy calls, which are options to buy common stock, or puts, which are options to sell common stock. A call buyer hopes prices will rise; a buyer of put options wishes prices to fall.
If the volume of call options in a given period of time is greater than the volume of put options, a logical assumption is that option speculators as a group are expecting higher prices and are bullish on the market. If the volume of put options is greater than that of calls, speculators hold a bearish attitude. When option players buy more puts than calls, the put-to-call ratio index rises a little above 1.0. Such a reading coincided with general market bottoms in 1990, 1996, 1998, and April and September 2001, but you can’t always expect this to occur. These are contrary indicators.
The percentage of investment advisors who are bearish is an interesting measure of investor sentiment. When bear markets are near the bottom, the great majority of advisory letters will usually be bearish. Near market tops, most will be bullish. The majority is usually wrong when it’s most important to be right. However, you cannot blindly assume that because 65% of investment advisors were bearish the last time the general market hit bottom, a major market decline will be over the next time the investment advisors’ index reaches the same point.
The short-interest ratio is the amount of short selling on the New York Stock Exchange, expressed as a percentage of total NYSE volume. This ratio can reflect the degree of bearishness shown by speculators in the market. Along bear market bottoms, you will usually see two or three major peaks showing sharply increased short selling. There’s no rule governing how high the index should go, but studying past market bottoms can give you an idea of what the ratio looked like at key market junctures.
An index that is sometimes used to measure the degree of speculative activity is the Nasdaq volume as a percentage of NYSE volume. This measure provided a helpful tip-off of impending trouble during the summer of 1983, when Nasdaq volume increased significantly relative to the Big Board’s (NYSE). When a trend persists and accelerates, indicating wild, rampant speculation, you’re close to a general market correction. The volume of Nasdaq trading has grown larger than that on the NYSE in recent years because so many new entrepreneurial companies are listed on the Nasdaq, so this index must be viewed differently now.
Some technical analysts religiously follow advance-decline (A-D) data. These technicians take the number of stocks advancing each day versus the number that are declining, and then plot that ratio on a graph. Advance-decline lines are far from precise because they frequently veer sharply lower long before a bull market finally tops. In other words, the market keeps advancing toward higher ground, but it is being led by fewer but better stocks.
The advance-decline line is simply not as accurate as the key general market indexes because analyzing the market’s direction is not a simple total numbers game. Not all stocks are created equal; it’s better to know where the real leadership is and how it’s acting than to know how many more mediocre stocks are advancing and declining.
The NYSE A-D line peaked in April 1998 and trended lower during the new bull market that broke out six months later in October. The A-D line continued to fall from October 1999 to March 2000, missing one of the market’s most powerful rallies in decades.
An advance-decline line can sometimes be helpful when a clear-cut bear market attempts a short-term rally. If the A-D line lags the market averages and can’t rally, it’s giving an internal indication that, despite the strength of the rally in the Dow or S&P, the broader market remains frail. In such instances, the rally usually fizzles. In other words, it takes more than just a few leaders to make a new bull market.
At best, the advance-decline line is a secondary indicator of limited value. If you hear commentators or TV market strategists extolling its virtues bullishly or bearishly, they probably haven’t done their homework. No secondary measurements can be as accurate as the major market indexes, so you don’t want to get confused and overemphasize the vast array of other technical measures that most people use, usually with lackluster or damaging results.
Among fundamental general market indicators, changes in the Federal Reserve Board’s discount rate (the interest rate the FRB charges member banks for loans), the fed funds rate (the interest rate banks with fund reserves charge for loans to banks without fund reserves), and occasionally stock margin levels are valuable indicators to watch.
As a rule, interest rates provide the best confirmation of basic economic conditions, and changes in the discount rate and the fed funds rate are by far the most reliable. In the past, three successive significant hikes in Fed interest rates have generally marked the beginning of bear markets and impending recessions.
Bear markets have usually, but not always, ended when the rate was finally lowered. On the downside, the discount rate increase to 6% in September 1987, just after Alan Greenspan became chairman, led to the severe market break that October.
Money market indicators mirror general economic activity. At times I have followed selected government and Federal Reserve Board measurements, including 10 indicators of the supply and demand for money and indicators of interest-rate levels. History proves that the direction of the general market, and also that of several industry groups, is often affected by changes in interest rates because the level of interest rates is usually tied to tight or easy Fed monetary policy.
For the investor, the simplest and most relevant monetary indicators to follow and understand are the changes in the discount rate and fed funds rate.
With the advent of program trading and various hedging devices, some funds now hedge portions of their portfolio in an attempt to provide some downside protection during risky markets. The degree to which these hedges are successful again depends greatly on skill and timing, but one possible effect for some managers may be to lessen the pressure to dump portfolio securities on the market.
Most funds operate with a policy of being widely diversified and fully or nearly fully invested at all times. This is because most fund managers, given the great size of today’s funds (billions of dollars), have difficulty getting out of the market and into cash at the right time and, most importantly, then getting back into the market fast enough to participate in the initial powerful rebound off the ultimate bottom. So they may try to shift their emphasis to big-cap, semidefensive groups.
The Fed Crushes the 1981 Economy. The bear market and the costly, protracted recession that began in 1981, for example, came about solely because the Fed increased the discount rate in rapid succession on September 26, November 17, and December 5 of 1980. Its fourth increase, on May 8, 1981, thrust the discount rate to an all-time high of 14%. That finished off the U.S. economy, our basic industries, and the stock market for the time being.
Fed rate changes, however, should not be your primary market indicator because the stock market itself is always your best barometer. Our analysis of market cycles turned up three key market turns that the discount rate did not help predict.
Independent Fed actions are typically very constructive, as the Fed tries to counteract overheated excesses or sharp contractions in our economy. However, its actions and results clearly demonstrate how much our overall federal government, not our stock markets reacting to all events, can and does at times significantly influence our economic future, for good or bad.
The 2008 Financial Collapse. The subprime mortgage meltdown and financial credit crisis that led to the 2008 market collapse can be easily traced to moves in 1995 by the then-current administration to substantially beef up the Community Reinvestment Act (CRA) of 1977. These actions mandated banks to make more higher-risk loans in lower-income areas than they would otherwise have made. Failure to comply meant stiff penalties, lawsuits, and limits on getting approvals for mergers and branch expansion.
Our government, in effect, encouraged and coerced major banks to lower their long-proven safe-lending standards. Most of the more than $1 trillion of new subprime CRA loans had adjustable rates. Many such loans eventually came to require no documentation of the borrower’s income and in some cases little or no down payment.
In addition, for the first time, new regulatory rules not only allowed but encouraged lenders to bundle the new, riskier subprime loans with prime loans and sell these assumed government-sponsored loan packages to other institutions and countries that thought they were buying safe AAA bonds. The first of these bundled loans hit the investment market in 1997. That action allowed loan originators and big banks to make profits faster and eliminate future risk and responsibility for many of those lower-quality loans. It let the banks turn around and make even more CRA-type loans, then sell them off in packages again, with little future risk or responsibility.
The unintended result was a gigantic government-sponsored and aggressively promoted pyramiding device, with Fannie Mae and Freddie Mac providing the implied government backing by buying, at government’s direction, vast quantities of far more subprimes; this led to their facing bankruptcy and needing enormous government bailouts. Freddie and Fannie’s management also received huge bonuses and were donors to certain members of Congress, who repeatedly defended the highly leveraged, extremely risky lending against any sound reforms.
Bottom line: it was a Big Government program that started with absolutely good, worthy social intentions, but with little judgment and absolutely zero foresight that over time resulted in severe damage and enormous unintended consequences that affected almost everything and everyone, including, sadly, the very lower-income people this rather inept government operation was supposed to be helping. It put our whole financial system in jeopardy. Big Wall Street firms got involved after the rescinding of the Glass-Steagall Act in 1998, and both political parties, Congress, and the public all played key parts in creating the great government financial fiasco.
The 1962 Stock Market Break. Another notable stock market break occurred in 1962. In the spring, nothing was wrong with the economy, but the market got skittish after the government announced an investigation of the stock market and then got on the steel companies for raising prices. IBM dropped 50%. That fall, after the Cuban missile showdown with the Russians, a new bull market sprang to life. All of this happened with no change in the discount rate.
There have also been situations in which the discount rate was lowered six months after the market bottom was reached. In such cases, you would be late getting into the game if you waited for the discount rate to drop. In a few instances, after Fed rate cuts occurred, the markets continued lower or whipsawed for several months. This also occurred dramatically in 2000 and 2001.
At key turning points, an active market operator can watch the market indexes and volume changes hour by hour and compare them to volume in the same hour of the day before.
A good time to watch hourly volume figures is during the first attempted rally following the initial decline off the market peak. You should be able to see if volume is dull or dries up on the rally. You can also see if the rally starts to fade late in the day, with volume picking up as it does, a sign that the rally is weak and will probably fail.
Hourly volume data also come in handy when the market averages reach an important prior low point and start breaking that “support” area. (A support area is a previous price level below which investors hope that an index will not fall.) What you want to know is whether selling picks up dramatically or by just a small amount as the market collapses into new low ground. If selling picks up dramatically, it represents significant downward pressure on the market.
After the market has undercut previous lows for a few days, but on only slightly higher volume, look for either a volume dry-up day or one or two days of increased volume without the general market index going lower. If you see this, you may be in a “shakeout” area (when the market pressures many traders to sell, often at a loss), ready for an upturn after scaring out weak holders.
The short-term overbought/oversold indicator has an avid following among some individual technicians and investors. It’s a 10-day moving average of advances and declines in the market. But be careful. At the start of a new bull market, the overbought/oversold index can become substantially “overbought.” This should not be taken as a sign to sell stocks.
A big problem with indexes that move counter to the trend is that you always have the question of how bad things can get before everything finally turns. Many amateurs follow and believe in overbought/oversold indicators.
Something similar can happen in the early stage or first leg of a major bear market, when the index can become unusually oversold. This is really telling you that a bear market may be imminent. The market was “oversold” all the way down during the brutal market implosion of 2000.
I once hired a well-respected professional who relied on such technical indicators. During the 1969 market break, at the very point when everything told me the market was getting into serious trouble, and I was aggressively trying to get several portfolio managers to liquidate stocks and raise large amounts of cash, he was telling them that it was too late to sell because his overbought/oversold indicator said that the market was already very oversold. You guessed it: the market then split wide open.
Needless to say, I rarely pay attention to overbought/oversold indicators. What you learn from years of experience is usually more important than the opinions and theories of experts using their many different favorite indicators.
Upside/downside volume is a short-term index that relates trading volume in stocks that close up in price for the day to trading volume in stocks that close down. This index, plotted as a 10-week moving average, may show divergence at some intermediate turning points in the market. For example, after a 10% to 12% dip, the general market averages may continue to penetrate into new low ground for a week or two. Yet the upside/downside volume may suddenly shift and show steadily increasing upside volume, with downside volume easing. This switch usually signals an intermediate-term upturn in the market. But you’ll pick up the same signals if you watch the changes in the daily Dow, Nasdaq, or S&P 500 and the market volume.
Some services measure the percentage of new money flowing into corporate pension funds that is invested in common stocks and the percentage that is invested in cash equivalents or bonds. This opens another window into institutional investor psychology. However, majority—or crowd—thinking is seldom right, even when it’s done by professionals. Every year or two, Wall Street seems to be of one mind, with everyone following each other like a herd of cattle. Either they all pile in or they all pile out.
An index of “defensive” stocks—more stable and supposedly safer issues, such as utilities, tobaccos, foods, and soaps—may often show strength after a couple of years of bull market conditions. This may indicate the “smart money” is slipping into defensive positions and that a weaker general market lies ahead. But this doesn’t always work. None of these secondary market indicators is anywhere near as reliable as the key general market indexes.
Another indicator that is helpful at times in evaluating the stage of a market cycle is the percentage of stocks in defensive or laggard categories that are making new price highs. In pre-1983 cycles, some technicians rationalized their lack of concern with market weakness by citing the number of stocks that were still making new highs. But analysis of new-high lists shows that a large percentage of preferred or defensive stocks signals possible bear market conditions. Superficial knowledge can hurt you in the stock market.
To summarize this complex but vitally important chapter: learn to interpret the daily price and volume changes of the general market indexes and the action of individual market leaders. Once you know how to do this correctly, you can stop listening to all the costly, uninformed, personal market opinions of amateurs and professionals alike. As you can see, the key to staying on top of the stock market is not predicting or knowing what the market is going to do. It’s knowing and understanding what the market has actually done in the past few weeks and what it is currently doing now. We don’t want to give personal opinions or predictions; we carefully observe market supply and demand as it changes day by day.
One of the great values of this system of interpreting the price and volume changes in the market averages is not just the ability to better recognize market top and bottom areas but also the ability to track each rally attempt when the market is on its way down. In most instances, waiting for powerful follow-through days keeps you from being drawn prematurely into rally attempts that ultimately end in failure. In other words, you have rules that will continue to keep you from getting sucked into phony rallies. This is how we were able to stay out of the market and in money market funds for most of 2000 through 2002, preserve the majority of the gains we had made in 1998 and 1999, and help those who read and followed our many basic rules. There is a fortune for you in this paragraph.
It isn’t enough just to read. You need to remember and apply all of what you’ve read. The CAN SLIM system will help you remember what you’ve read so far. Each letter in the CAN SLIM system stands for one of the seven basic fundamentals of selecting outstanding stocks. Most successful stocks have these seven common characteristics at emerging growth stages, so they are worth committing to memory. Repeat the formula until you can recall and use it easily. Keep it with you when you invest.
C = Current Quarterly Earnings per Share. Quarterly earnings per share must be up at least 18% or 20%, but preferably up 40% to 100% or 200% or more—the higher, the better. They should also be accelerating at some point in recent quarters. Quarterly sales should also be accelerating or up 25% or more.
A = Annual Earnings Increases. There must be significant (25% or more) growth in each of the last three years and a return on equity of 17% or more (with 25% to 50% preferred). If return on equity is too low, pretax profit margin must be strong.
N = New Products, New Management, New Highs. Look for new products or services, new management, or significant new changes in industry conditions. And most important, buy stocks as they emerge from sound, properly formed chart bases and begin to make new highs in price.
S = Supply and Demand—Shares Outstanding plus Big Volume Demand. Any size capitalization is acceptable in today’s new economy as long as a company fits all the other CAN SLIM rules. Look for big volume increases when a stock begins to move out of its basing area.
L = Leader or Laggard. Buy market leaders and avoid laggards. Buy the number one company in its field or space. Most leaders will have Relative Price Strength Ratings of 80 to 90 or higher and composite ratings of 90 or more in bull markets.
I = Institutional Sponsorship. Buy stocks with increasing sponsorship and at least one or two mutual fund owners with top-notch recent performance records. Also look for companies with management ownership.
M = Market Direction. Learn to determine the overall market direction by accurately interpreting the daily market indexes’ price and volume movements and the action of individual market leaders. This can determine whether you win big or lose. You need to stay in gear with the market. It doesn’t pay to be out of phase with the market.
I’m not even sure what “momentum investing” is. Some analysts and reporters who don’t understand anything about how we invest have given that name to what we talk about and do. They say it’s “buying the stocks that have gone up the most in price” and that have the strongest relative price strength. No one in their right mind invests that way. What we do is identify companies with strong fundamentals—large sales and earnings increases resulting from unique new products or services—and then buy their stocks when they emerge from properly formed price consolidation periods and before they run up dramatically in price during bull markets.
When bear markets are beginning, we want people to protect themselves and nail down their gains by knowing when to sell and start raising cash. We are not investment advisors. We do not write and disseminate any research reports. We do not call or visit companies. We do not make markets in stocks, deal in derivatives, do underwritings, or arrange mergers. We don’t manage any public or institutional money.
We are historians, studying and discovering how stocks and markets actually work and teaching and training people everywhere who want to make money investing intelligently and realistically. These are ordinary people from all walks of life, including professionals. We do not give them fish. We teach them how to fish for their whole future so that they too can capitalize on the American Dream.
On Wall Street, wise men can be drawn into booby traps just as easily as fools. From what I’ve seen over many years, the length and quality of one’s education and the level of one’s IQ have very little to do with making money investing in the market. The more intelligent people are—particularly men—the more they think they really know what they’re doing, and the more they may have to learn the hard way how little they really know about outsmarting the markets.
We’ve all now witnessed firsthand the severe damage that supposedly bright, intelligent, and highly educated people in New York and Washington, D.C., caused this country in 2008. U.S. senators, heads of congressional committees, political types working for government-sponsored entities such as Fannie Mae and Freddie Mac, plus heads of top New York–based brokerage firms, lending banks, and mortgage brokers all thought they knew what they were doing, with many of them using absurd leverage of 50 to 1, and even higher, to invest in subprime real estate loans.
They created sophisticated derivatives and insurance to justify such incredible risks. No one group was solely to blame, since both Democrats and Republicans were involved. However, it all began as a well-intended government program that top politicians accelerated in 1995, 1997, and 1998, when Glass-Steagall was rescinded, and things kept escalating out of control. Politicians accept no blame, just blame others.
So maybe it’s time for you to take more control of your investing and make up your mind that you’re going to learn how to save and invest your hard-earned money more safely and wisely than Washington and Wall Street have done since the late 1990s. If you really want to do it, you certainly can. Anyone can.
The few people I’ve known over the years who’ve been unquestionably successful investing in America were decisive individuals without huge egos. The market has a simple way of whittling all excessive pride and overblown egos down to size. After all, the whole idea is to be completely objective and recognize what the marketplace is telling you, rather than trying to prove that what you said or did yesterday or six weeks ago was right. The fastest way to take a bath in the stock market is to try to prove that you are right and the market is wrong. Humility and common sense provide essential balance.
Sometimes, listening to quoted and accepted experts can get you into trouble. In the spring and summer of 1982, a well-known expert insisted that government borrowing was going to crowd out the private sector and that interest rates and inflation would soar back to new highs. Things turned out exactly the opposite: inflation broke and interest rates came crashing down. Another expert’s bear market call in the summer of 1996 came only one day before the market bottom.
Week after week during the 2000 bear market, one expert after another kept saying on CNBC that it was time to buy high-tech stocks—only to watch the techs continue to plummet further. Many high-profile analysts and strategists kept telling investors to capitalize on these once-in-a-lifetime “buying opportunities” on the way down! Buying on the way down can be a very dangerous pastime.
Conventional wisdom or consensus thinking in the market is seldom right. I never pay any attention to the parade of experts voicing their personal opinions on the market in print or on TV. It creates entirely too much confusion and can cost you a great deal of money. In 2000, some strategists were telling people to buy the dips (short-term declines in price) because the cash position of mutual funds had increased greatly and all this money was sitting on the sidelines waiting to be invested. To prove this wrong, all anyone had to do was look at the General Markets & Sectors page in Investor’s Business Daily. It showed that while mutual fund cash positions had indeed risen, they were still significantly below their historical highs and even below their historical averages.
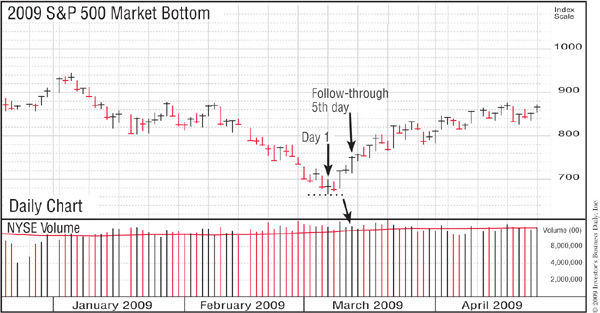
On the flip side, market bottoms are often accompanied by overwhelming negativity from the “experts.” For example, in March 2009 investors had just faced a financial crisis, 17-month bear market, and the president warning of the possibility of another Great Depression. Most people, understandably, were afraid to jump back into the market despite the follow-through day on March 12 (see chart below).
You can’t go by how you feel in the market. The only thing that works well is to let the market indexes tell you when it’s time to enter and exit. Never fight the market—it’s bigger than you are.
