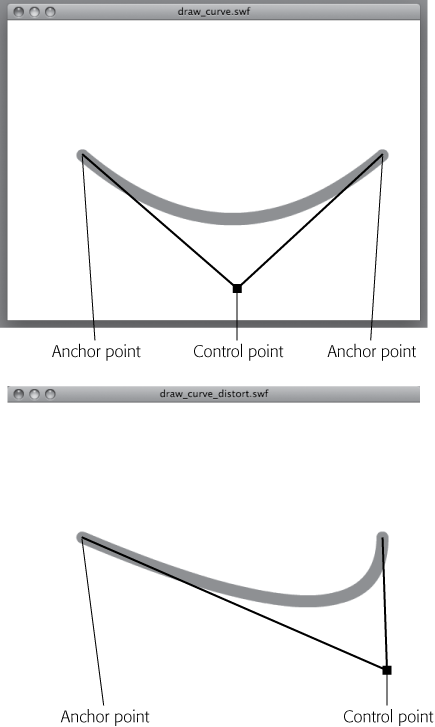
When you draw a curve using ActionScript, you need to add one more point to the mix. Think about the way you draw curves in Flash or Adobe Illustrator. You have a line with two anchor points, and you drag control handles from the anchors to create a curve. The line doesn't travel through the control handles, it's just geometrically influenced by the position of the handles. ActionScript uses a similar method to create curves, but you have to imagine that there's a single control point connected to both endpoints. Figure 18-4 shows the concept. By repositioning that control point, you change the shape of the curve. The curveTo() method is similar to the lineTo() method described in the previous section. You're creating a line from the current position of the virtual pen (one anchor point) to the end point of the curve (another anchor point). The shape of that line is influenced by a control point.
When you draw a curve in ActionScript, the control point isn't visible; it's defined but doesn't get displayed on the stage. In the code example here, the control point is marked with an X, and it's displayed in a text field. It shares the control point's x and y values. This code appears in 18-3_Draw_Curve.fla in the Missing CD (www.missingmanuals.com/cds).
1  var shpLine:Shape = new Shape();
2  var ptAnchor1:Point = new Point();
3  var ptAnchor2:Point = new Point();
4  var ptControl:Point = new Point();
5  var tfControl:TextField = new TextField();
6
7  ptAnchor1.x = 100;
8  ptAnchor1.y = 180;
9  ptAnchor2.x = 500;
10 ptAnchor2.y = 180;
11 ptControl.x = 500;
12 ptControl.y = 350;
13
14 tfControl.text = "X";
15 tfControl.x = ptControl.x;
16 tfControl.y = ptControl.y;
17 addChild(tfControl);
18
19 shpLine.graphics.lineStyle(16,0x00FF00);
20 shpLine.graphics.moveTo(ptAnchor1.x,ptAnchor1.y);
21 shpLine.graphics.curveTo(ptControl.x,ptControl.y,ptAnchor2.x,ptAnchor2.y);
22 addChild(shpLine);
23
24 shpLine.graphics.moveTo(0,0);
Figure 18-4. ActionScript's curveTo() method draws curves using a quadratic Bezier equation, but you don't have to remember that. Just keep in mind that there are two anchor points and one control point. You change the shape of the curve by repositioning the control point, using ActionScript code, naturally.
The first line in this example creates a shape. You can create vector drawings in Sprites, Shapes, and MovieClips. Shapes use even less space than Sprites in your Flash animation. The three lines from 2 through 4 create points. The names could be anything, but in this example there's a hint that two of them are going to serve as anchor points and one will serve as a control point. Line 5 creates a text field that's named tfControl. Lines 7 through 12 position the three points. You can tell from their y values that ptAnchor1 and ptAnchor2 appear on the same horizontal axis. The ptControl y value is quite a bit below that axis. Line 14 stores an X in the text property of tfControl. (Think X marks the spot.) Then, the code assigns x and y values of the text box the same values that are in ptControl.x and ptControl.y. Line 17 displays the tfControl text field when it's added to the Display List using the addChild() method. Line 19 defines a lineStyle(). The moveTo() method on line 20 positions the virtual pen at the first anchor point for the line. Then the curveTo() method is used. The first anchor point was already established by the preceding moveTo() method, so the curveTo() method needs two points. The x and y values of the control point come first, and then come the x and y values of the second anchor point. The addChild() method in line 22 displays the curve. When you test the curve code, it draws a curve similar to the one at bottom in Figure 18-4. If you want to experiment, you can go ahead and change the x and y values of ptControl in lines 11 and 12. That changes the shape of the curve, and it also moves the x in the text field to mark the new position of the control point.
