Imagine, for an instant, that your animation isn't behaving the way you think it should. Testing it on the stage or in Flash Player, and then eyeballing the results, as described in the previous section, is a good place to start tracking down the problem. But if you've added ActionScript to your animation, chances are you need more firepower. You need to be able to examine the inner workings of your ActionScript code—the variables, instance names, methods, and so on—to help you figure out what's wrong. Debugging is one of those activities that's part art, part craft, and part science. Flash and ActionScript provide several tools that help you track down and eliminate those pesky bugs of all types. These are some of the tools at your disposal:
The Check syntax button catches the most obvious typos. If you've got too many parentheses in a line or you misplaced a comma or semicolon, the syntax checker is likely to notice. Still, it lets lots of the bad guys through.
The Compiler Errors panel is the next layer of defense against bugs. If there's a flaw in your code's logic (for example, a reference to some object that doesn't exist or is misnamed), a message is likely to appear in the Compiler Errors panel. Sometimes your animation will run anyway; other times it won't.
The Output panel displays messages. Using the trace() statement, you can display the values of variable and object properties in the Output panel. So, you get to tell ActionScript what to report on.
The Debugger is your debugging power tool. It's kind of like the diagnostic machine your mechanic connects to your car to see what's going on inside. The debugger combines the usefulness of the other tools with the all-important ability to stop your animation and code in its tracks. That gives you an opportunity to examine the critical variables, property settings, and values.
Note
The debugger for ActionScript 3.0 is different in a few ways from the debugger for ActionScript 2.0 and 1.0 code. For details on the older debugger, see Flash CS3: The Missing Manual.
You're likely to use the first three tools as you're writing and testing your animation. As your code gets more complex, with multiple timelines, multiple objects, and multiple functions and methods, you'll turn to the debugger. This section starts off with the quick and easy bug squashers, and then moves on to the more complex. The troublesome program attached to that diagnostic machine is called 19-1_Debug_Code.fla, and you can download it from the Missing CD page at www.missingmanuals.com/cds. If you'd like to see how the program is supposed to behave, check out 19-2_Debug_Code_done.fla.
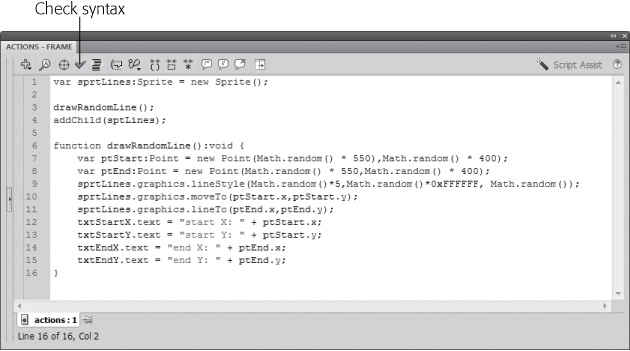
The animation 19-1_Debug_Code.fla isn't behaving the way it should—pretty ornery for a snippet of code that's only 20 lines long. It's supposed to draw lines on the screen from one random point to another. The lines are supposed to randomly vary in thickness, color, and transparency. There are four text fields in the display that are supposed to flash the x/y coordinates of the points used to draw the lines. If you try to test the program with Ctrl+Enter (⌘-Return on a Mac), nothing much happens. The first step to putting things on track is to use the "Check syntax" button in the Actions panel, as shown in Figure 19-11.
Figure 19-11. The Check syntax button looks like a check. One click, and Flash proofreads your code to find typos and punctuation errors.
With 19-1_Debug_Code.fla open in Flash, select Window→Actions.
The Actions panel opens. The Actions panel can look different depending on how you've set up your workspace. It also remembers some of the settings, like which panels are open and closed, from the last time you used it.
If you don't see code in the Actions panel, then in the animation's timeline, click Frame 1 in the "actions" layer.
The Actions panel shows the code associated with particular frames in the timeline. It's not a problem with this little snippet, but with larger animations if you don't see the actions you want to debug, make sure you've selected the frame that holds the code.
In the Actions panel, click the "Check syntax" button.
The "Check syntax" button looks like a checkmark. After a little deep thinking, you hear a ding, which occurs whether there's an error or not.
Click the Compiler Errors panel, and look for an error message.
If everything is okay, you won't see any message. If "Check syntax" found an error, a message appears in the panel. The Compiler Errors panel's location may vary depending on how you've organized your workspace. If you're using the Essentials workspace, it appears beneath your animation. (And if you're wondering what the heck a compiler is, see the box on What's a Compiler and Why Does It Err?.)
For this animation, the message in the Compiler Errors panel looks like Figure 19-12. As helpful as these details are, sometimes your view of the issue and the compiler's view aren't coming from the same direction, so the messages may seem a bit cryptic. In this case, you're told the error is on Line 11. The error's description is:
1086: Syntax error: expecting semicolon before dot.
That's a little on the cryptic side, but it means there's probably something wrong with the way the line is punctuated. Double-clicking the error message puts your cursor in the offending line in the Actions panel.
Examine the highlighted line for a syntax error.
Here's where you get into the grunt work of debugging, looking through your code to find out where there might be a problem. Flash is a lot fussier than your third-grade teacher about punctuation, so double-check to make sure there are commas between parameters and a semicolon at the end of the line. Parentheses are another place where it's easy to make a mistake. In any statement (from the beginning of the line to the semicolon), there should be an equal number of left parentheses and right parentheses. And yes, they all need to be in the right spots, too. But it's so easy to mess up on parentheses that counting is a legitimate debugging technique. In the code in line 11, there's one extra closing parenthesis before the comma.
var ptStart:Point = new Point(Math.random() * 550),Math.random() * 400);
Delete the error, and then click "Check syntax" again.
This time, you hear the ding, but there's no error message. That's fine as far as it goes. With ActionScript 3.0 code, all the syntax checker does is check the punctuation and a few other details of your code. The Syntax checker works quickly because it doesn't actually compile your code. That means it doesn't catch nearly as many errors as you find when you test your animation using Ctrl+Enter (⌘-Return on a Mac).
When you test your animation using Control→Test Movie or by pressing Ctrl+Enter (⌘-Return on a Mac), Flash creates an .swf file. That's the same as the finished file you distribute or put on a website so the world can see your animation. In the process, your ActionScript code is translated into a computer language that's smaller and faster than your ActionScript. The process of compiling your code is likely to catch mistakes that the "Check syntax" button misses. (See the box above for more details.)
Note
This example continues debugging the file 19-1_Debug_Code.fla. The entire process began on Checking with the Syntax Checker.
Test your animation using Ctrl+Enter (⌘-Return on a Mac).
An error appears in the Compiler Errors panel, as shown in Figure 19-13. (It could be worse; sometimes you see seven or eight errors stacked up in the panel.) This error didn't appear when you clicked the "Check syntax" button in the previous exercise, because "Check syntax" doesn't compile the code. Obviously, the compiler choked on something you're trying to feed it. The Compiler Errors panel reports that the location of the error is "Scene 1, Layer 'actions', Frame 1, Line 7." That's very helpful information, and what's more, when you double-click the error message in the panel, Flash zips you to the Actions panel and finds that point in your code. But before you double-click, read the description of the error:
1120: Access of undefined property sptLines.
That's also a good clue, which explains the problem, at least as far as the compiler sees it. The compiler thinks you're trying to make a change to a property that doesn't exist. That property has something to do with sptLines.
Double-click the error message in the Compiler Errors panel.
Flash zips you to the Actions panel and highlights line 4, which reads:
addChild(sptLines);
Examine the highlighted line for a syntax error.
At first this might seem a little puzzling. It's a simple statement that adds sptLines to the Display List, which should make its contents visible on the stage. The compiler error said something about a property, but this line doesn't seem to be changing a property. You know, however, that the compiler sees something it can't identify, and that's sptLines. It makes sense to check the code that precedes the error for previous references to sptLines. There aren't any, and that's exactly the problem. The variable sprtLines is defined in the first line of the code, and the reference to sptLines is a typo.
In line 7, correct the spelling of sprtLines, and then test the animation.
This time, 19-1_Debug_Code.fla is a little more entertaining. The animation draws random lines on the stage. The lines vary in thickness, color, and transparency. But the text boxes, like the one that reads start X, don't change or provide any other information. Sounds like there's more debugging to do.
Note
The animation 19-1_Debug_Code.fla uses a very slow frame rate of 2 fps so that each line appears slowly on the screen. If you want to speed up the action, go to Modify→Document and change the frame rate.
Stop the 19-1_Debug_Code.fla when you're sufficiently entertained. Because there's no automatic end to the animation, Flash can conceivably draw so many lines that your computer will run out of memory trying to display them.
The ActionScript trace() statement is one of the easiest ways to debug your programs—and it delivers a lot of bang for your debugging buck. You get to tell ActionScript exactly what variable value or object you want to keep track of, and Flash obligingly sends the details to the Output panel. Trace() is such an important code-writing tool that it's used throughout the ActionScript examples in this book. Here's another good example of the way you can use trace() to understand why your program isn't behaving as expected.
Note
This example continues debugging the file 19-1_Debug_Code.fla. The entire process begins on Checking with the Syntax Checker.
When you tested 19-1_Debug_Code.fla in the last step on Using the Output Panel and trace() Statement, the drawing lines part of the program worked, but the text fields didn't display information about the points used to start and end the lines. Text fields display strings of text in your animation. There are a few different types of text fields, and you can format them in a number of ways. (For all the details, see Text Questions.) In this case, the text fields show some of the information that you want displayed, but not all of it.
The trace() statement works kind of like a text field. You put the information that you want displayed inside the trace() statement's parentheses. If you want to display a string of text, put it inside quotes, like this:
trace("show this text");When your ActionScript code gets to that line, the words "show this text" appear in the Output panel (without the quotes). If you have a variable named strMsg, and its value is "show this text", then you can write a trace() statement like this:
trace(strMsg);
This statement would also send the words "show this text" to the Output panel. The Output panel isn't at all fussy about the data types. Put the name of a variable, an instance of an object, or just about anything inside a trace() statement, and something is bound to appear in the Output panel. If the value is a number, that's what you see. If it's a reference to an object, you see the object's name.
Following are some steps to gain a little insight into the problem with the text fields in the file 19-1_Debug_Code.fla.
Test the animation as it worked at the end of the previous section.
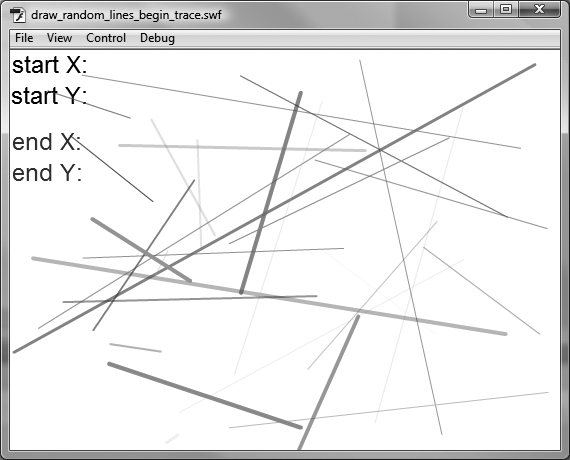
When you test the animation, you see the random lines drawn properly, but you see only part of the text that should be displayed in text fields, as shown in Figure 19-14. Don't forget to stop the animation (Control→Stop) or close the window (File→Close).
On the stage, click the text fields, and then, in the Properties panel, check the names of the text fields.
In your Flash document, the text fields on the stage show text, like "start X" and "start Y." When you select a text field, you see its name at the top of the Properties panel. For example, the text field with the text "start X" is named txtStartX. The others are named txtStartY, txtEndX, and txtEndY. These are the names of misbehaving text fields, so you'll look for references to them in your code.
Select Window→Actions to open the Actions panel.
The Actions panel displays this code, which amounts to only 20 lines:
1  import flash.display.Sprite;
2  import flash.geom.Point;
3
4  var sprtLines:Sprite = new Sprite;
5
6  drawRandomLine();
7  addChild(sprtLines);
8
9  function drawRandomLine():void
10 {
11     var ptStart:Point = new Point(Math.random() * 550,Math.random() * 400);
12     var ptEnd:Point = new Point(Math.random() * 550,Math.random() * 400);
13     sprtLines.graphics.lineStyle(Math.random() *5,Math.
         random()*0xFFFFFF,Math.random());
14     sprtLines.graphics.moveTo(ptStart.x,ptStart.y);
15     sprtLines.graphics.lineTo(ptEnd.x,ptEnd.y);
16     txtStartX.text = "start X: " + ptStart.x;
17     txtStartY.text = "start Y: " + ptStart.y;
18     txtEndX.text = "end X: " + ptEnd.x;
19     txtEndY.text = "end Y: " + ptEnd.y;
20 }
Search for lines with references to the misbehaving text fields: txtStartX, txtStartY, txtEndX, and txtEndY.
In lines 16 through 19, values are assigned to the text fields' properties. Each value is made of two parts, a string literal with text like "start X:" and then the string concatenation operator (+) and a reference to an object's property, like ptStart.x. Looking back up in the code, you see on line 11 that the data type for ptStart is Point. The reference ptStart.x is a reference to the x property of a point. That value is a number. Still, there's nothing apparently wrong with the code.
Insert a line after line 15, and then type the following trace() statement:
trace("start X: " + ptStart.x);The text inside the parentheses is exactly the text that's supposed to appear in the text field. In fact, you can copy and paste to create the line. Using copy and paste is a good technique for an operation like this, because you'll be sure the text in the two statements is identical.
Test your animation using Ctrl+Enter (⌘-Return on a Mac) and examine the Output panel.
When you run your animation, the Output window starts to fill up with lines like:
start X: 549.6419722447172
start X: 499.13692246191204
start X: 239.57312640268356
start X: 64.5334855420515
Comparing the Output panel details, you see that your text fields display the string literals, like start X:, but they aren't displaying the numbers with all those decimal places. Those long numbers are generated by the random() method used earlier in the code. For example, the value for ptStart.x is created in line 11 with the statement:
var ptStart:Point = new Point(Math.random() * 550,Math.random() * 400);
This line creates a new variable called ptStart. Its data type is Point, which includes x and y properties. At the same time that the new instance of Point is being created, values are assigned to those x and y properties. Instead of providing specific numbers, you want to provide random numbers that change every time the drawRandomLine() method runs. So the statement uses a method that's provided by the Math class. The section of the statement that reads Math.random() * 550 is in effect saying, give me a random number between zero and 550 (the width of the stage). Likewise, the next bit of code is providing a number for the y property that matches the height of the stage. Math.random() is providing a number with a little more precision than is necessary for this snippet of a program. In fact, the number is too long to fit in the text field.
Select the txtStartX text field on the stage, and then in the Properties panel change the width to 550.
The width of the text field expands so it's the length of the stage.
Test your animation using Ctrl+Enter (⌘-Return on a Mac).
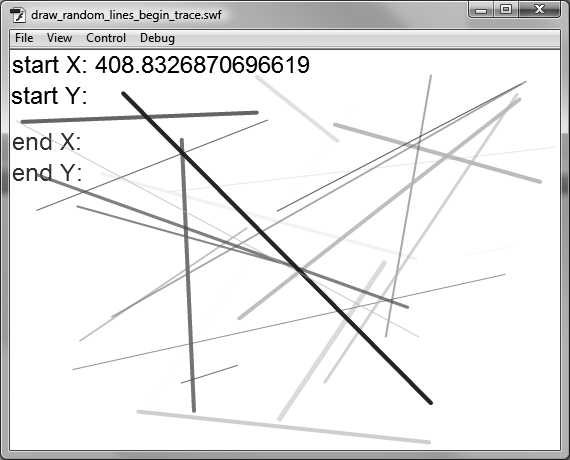
When the animation runs, the entire number is displayed in the txtStartX text field, as shown in Figure 19-15. The x and y properties aren't displayed in the other text fields.
Figure 19-15. After changing the width of the text field, Flash displays the very long number that represents the x property for your line's starting point.
Mystery solved. You figured out what's gone wrong with the code. The solution is a little less than satisfactory—you don't really need a number that long for this animation. Fortunately, that gives you an opportunity to explore the Debugger in action, as you'll see in the next section.
You can delete the trace() statement from your code or you can temporarily leave it in. It doesn't change the appearance of the animation in any way. A third alternative is to use a handy programmer's trick called commenting out; see the box on Comment Me Out.


