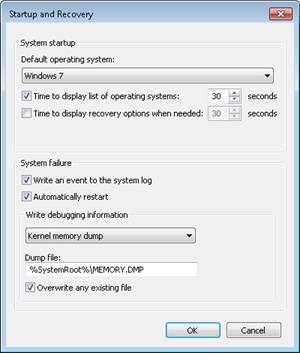
By default, all Windows systems are configured to attempt to record information about the state of the system when the system crashes. You can see these settings by opening the System Properties tool in Control Panel (under System, Advanced System Settings), clicking the Advanced tab, and then clicking the Settings button under Startup And Recovery. The default settings for a Windows system are shown in Figure 14-4.
Three levels of information can be recorded on a system crash:
Complete memory dump A complete memory dump contains all physical memory accessible by Windows at the time of the crash. This type of dump requires that a page file be at least the size of physical memory plus 1 MB for the header. Device drivers can add up to 256 MB for secondary crash dump data, so to be safe, it’s recommended to increase the size of the page file by an additional 256 MB. Because it can require an inordinately large page file on large memory systems, this type of dump file is the least common setting. If the system has more than 2 GB of RAM, this option will be disabled in the UI, but you can manually enable it by running the following command from an elevated command prompt:
wmic recoveros set DebugInfoType=1
When using Wmic.exe to enable a complete dump, the WMI Win32 Provider sets the CrashDumpEnabled value to 1 in the HKLM\SYSTEM\CurrentControlSet\Control\CrashControl registry key. At initialization time, Windows will check whether the page-file size is large enough for a complete dump and automatically switch to creating a small memory dump if not.
Kernel memory dump A kernel memory dump contains only the kernel-mode pages allocated by the operating system and device drivers that are present in physical memory at the time of the crash. This type of dump doesn’t contain pages belonging to user processes. Because only kernel-mode code can directly cause Windows to crash, however, it’s unlikely that user process pages are necessary to debug a crash. In addition, all data structures relevant for crash dump analysis—including the list of running processes, the kernel-mode stack of the current thread, and list of loaded drivers—are stored in nonpaged memory that saves in a kernel memory dump. There is no way to predict the size of a kernel memory dump because its size depends on the amount of kernel-mode memory allocated by the operating system and drivers present on the machine. This is the default setting for both Windows client and server systems.
Small memory dump A small memory dump, which is typically between 128 KB and 1 MB in size and is also called a minidump or triage dump, contains the stop code and parameters, the list of loaded device drivers, the data structures that describe the current process and thread (called the EPROCESS and ETHREAD—described in Chapter 5, “Processes, Threads, and Jobs,” in Part 1), the kernel stack for the thread that caused the crash, and additional memory considered potentially relevant by crash dump heuristics, such as the pages referenced by processor registers that contain memory addresses and secondary dump data added by drivers.
Note
Device drivers can register a secondary dump data callback routine by calling KeRegisterBugCheckReasonCallback. The kernel invokes these callbacks after a crash and a callback routine can add additional data to a crash dump file, such as device hardware memory or device information for easier debugging. Up to 256 MB can be added systemwide by all drivers, depending on the space required to store the dump and the size of the file into which the dump is written, and each callback can add at most one-eighth of the available additional space. Once the additional space is consumed, drivers subsequently called are not offered the chance to add data.
The debugger indicates that it has limited information available to it when it loads a minidump, and basic commands like !process, which lists active processes, don’t have the data they need. Here is an example of !process executed on a minidump:
Microsoft (R) Windows Debugger Version 6.12.0002.633 AMD64 Copyright (c) Microsoft Corporation. All rights reserved. Loading Dump File [C:\Windows\Minidump\100911-22965-01.dmp]Mini Kernel Dump File: Only registers and stack trace are available... 0: kd> !process 0 0 **** NT ACTIVE PROCESS DUMP ****GetPointerFromAddress: unable to read from fffff800030c5000Error in reading nt!_EPROCESS at 0000000000000000
A kernel memory dump includes more information, but switching to a different process’s address space mappings won’t work because required data isn’t in the dump file. Here is an example of the debugger loading a kernel memory dump, followed by an attempt to switch process address spaces:
Microsoft (R) Windows Debugger Version 6.12.0002.633 AMD64 Copyright (c) Microsoft Corporation. All rights reserved. Loading Dump File [C:\Windows\MEMORY.DMP]Kernel Summary Dump File: Only kernel address space is available... 0: kd> !process 0 0 explorer.exe PROCESS fffffa8009b47540 ... 0: kd> .process fffffa8009b47540Process fffffa80`09b47540 has invalid page directories
While a complete memory dump is a superset of the other options, it has the drawback that its size tracks the amount of physical memory on a system and can therefore become unwieldy. Because user-mode code and data are not used during the analysis of most crashes (because crashes originate as a result of problems in kernel memory, and system data structures reside in kernel memory), much of the data stored in a complete memory dump is not relevant to crash analysis and therefore contributes wastefully to the size of a dump file. A final disadvantage is that the paging file must be at least as large as the amount of physical memory on the system plus 1 MB for the dump header, plus up to an additional 256 MB for secondary crash dump data. Because the size of the paging files required, in general, inversely tracks the amount of physical memory present, this requirement can force the paging file to be unnecessarily large. You should therefore consider the advantages offered by the small and kernel memory dump options.
An advantage of a minidump is its small size, which makes it convenient for exchange via e-mail, for example. In addition, each crash generates a file in the directory %SystemRoot%\Minidump with a unique file name consisting of the date, the number of milliseconds that have elapsed since the system was started, and a sequence number (for example, 040712-24835-01.dmp). If there’s a conflict, the system will attempt to create additional unique file names by calling the Windows GetTickCount function to return an updated system tick count, and it will also increment the sequence number. By default, Windows saves the last 50 minidumps. The number of minidumps saved is configurable by modifying the MinidumpsCount value under the HKLM\SYSTEM\CurrentControlSet\Control\CrashControl registry key.
A disadvantage of minidumps is that to analyze them, you must have access to the exact images used on the system that generated the dump at the time of analysis. (At a minimum, a copy of the matching Ntoskrnl.exe is needed to perform the most basic analysis.) This can be problematic if you want to analyze a dump on a system different from the system that generated the dump. However, the Microsoft symbol server contains images (and symbols) for all recent Windows versions, so you can set the symbol path in the debugger to point to the symbol server, and the debugger will automatically download the needed images. (Of course, the Microsoft symbol server won’t have images for third-party drivers you have installed.)
A more significant disadvantage is that the limited amount of data stored in the dump can hamper effective analysis. You can also get the advantages of minidumps even when you configure a system to generate kernel or complete crash dumps by opening the larger crash with WinDbg and using the .dump /m command to extract a minidump. Note that a minidump is automatically created even if the system is set for full or kernel dumps.
Note
You can use the .dump command from within LiveKd to generate a memory image of a live system that you can analyze offline without stopping the system. This approach is useful when a system is exhibiting a problem but is still delivering services, and you want to troubleshoot the problem without interrupting service. To prevent creating crash images that aren’t necessarily fully consistent because the contents of different regions of memory reflect different points in time, LiveKd supports the –m flag. The mirror dump option produces a consistent snapshot of kernel-mode memory by leveraging the memory manager’s memory mirroring APIs, which give a point-in-time view of the system. For information about using LiveKd with Hyper-V guests, refer to the “Dumping Hyper-V Guests Using LiveKd” experiment later in the chapter.
The kernel memory dump option offers a practical middle ground. Because it contains all of kernel-mode-owned physical memory, it has the same level of analysis-related data as a complete memory dump, but it omits the usually irrelevant user-mode data and code, and therefore can be significantly smaller. As an example, on a system running a 64-bit version of Windows with 4 GB of RAM, a kernel memory dump was 294 MB in size.
When you configure kernel memory dumps, the system checks whether the paging file is large enough, as described earlier. Some general recommendations follow in Table 14-1, but these are only estimated sizes because there is no way to predict the size of a kernel memory dump. The reason you can’t predict the size of a kernel memory dump is that its size depends on the amount of kernel-mode memory in use by the operating system and drivers present on the machine at the time of the crash.
Therefore, it is possible that at the time of the crash, the paging file is too small to hold a kernel dump, in which case the system will switch to generating a minidump. If you want to see the size of a kernel dump on your system, force a manual crash either by configuring the option to allow you to initiate a manual system crash from the console or by using the Notmyfault tool. (Both Notmyfault and initiating a crash are described later in the chapter.) When you reboot, you can check to make sure that a kernel dump was generated and check its size to gauge how large to make your paging file. To be conservative, on 32-bit systems you can choose a page file size of 2 GB plus up to 256 MB, because 2 GB is the maximum kernel-mode address space available (unless you are booting with the increaseuserva boot option, in which case this can be as low as 1 GB). If you do not have enough space on the boot volume for saving the Memory.dmp file, you can choose a location on any other local hard disk through the dialog box shown earlier in Figure 14-4.
To limit the amount of disk space that is taken up by crash dumps, Windows needs to determine whether it should maintain a copy of the last kernel or complete dump. After reporting the kernel fault (described later), Windows uses the following algorithm to decide if it should keep the Memory.dmp file. If the system is a server, Windows will always store the dump file. On a Windows client system, only domain-joined machines will store a crash dump by default. For a non-domain-joined machine, Windows will maintain a copy of the crash dump only if there is more than 25 GB of free disk space on the destination volume—that is, the volume where the system is configured to write the Memory.dmp file. If the system, due to disk space constraints, is unable to keep a copy of the crash dump file, an event is written to the System event log indicating that the dump file was deleted, as shown in Figure 14-5. This behavior can be overridden by creating the DWORD registry value HKLM\SYSTEM\CurrentControlSet\Control\CrashControl\AlwaysKeepMemoryDump and setting it to 1, in which case Windows will always keep a crash dump, regardless of the amount of free disk space.

When the system boots, it checks the crash dump options configured by reading the HKLM\SYSTEM\CurrentControlSet\Control\CrashControl registry key. If a dump is configured, it makes a copy of the disk miniport driver used to write to the volume in memory and gives it the same name as the miniport with the word “dump_” prefixed. The system also queries the DumpFilters value for any filter drivers that are required for writing to the volume, an example being Dumpfve.sys, the BitLocker Drive Encryption Crashdump Filter driver. (See Chapter 9, for more details on BitLocker Drive Encryption.) It also collects information related to the components involved with writing a crash dump—including the name of the disk miniport driver, the I/O manager structures that are necessary to write the dump, and the map of where the paging file is on disk—and saves two copies of the data in dump-context structures.
When the system crashes, the crash dump driver (%SystemRoot%\System32\Drivers\Crashdmp.sys) verifies the integrity of the two dump-context structures obtained at boot by performing a memory comparison. If there’s not a match, it does not write a crash dump, because doing so would likely fail or corrupt the disk. Upon a successful verification match, Crashdmp.sys, with support from the disk miniport driver and any required filter drivers, writes the dump information directly to the sectors on disk occupied by the paging file, bypassing the file system driver and storage driver stack (which might be corrupted or even have caused the crash).
Note
Because the page file is opened early during system startup for crash dump use, most crashes that are caused by bugs in system-start driver initialization result in a dump file. Crashes in early Windows boot components such as the HAL or the initialization of boot drivers occur too early for the system to have a page file, so using another computer to debug the startup process is the only way to perform crash analysis in those cases. (See the EXPERIMENT: Attaching a Kernel Debugger experiment later in the chapter.)
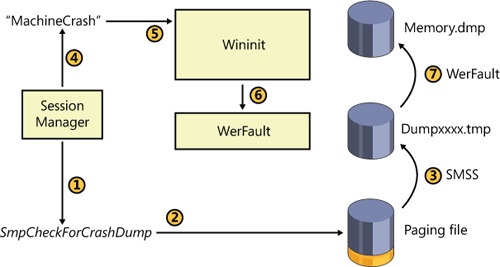
During the boot process, the Session Manager (Smss.exe) checks the registry value HKLM\SYSTEM\CurrentControlSet\Control\Session Manager\Memory Management\ExistingPageFiles for a list of existing page files from the previous boot. (See Chapter 10, for more information on page files.) It then cycles through the list, calling the function SmpCheckForCrashDump on each file present, looking to see whether it contains crash dump data. It checks by searching the header at the top of each paging file for the signature PAGEDUMP or PAGEDU64 on 32-bit or 64-bit systems, respectively. (A match indicates that the paging file contains crash dump information.) If crash dump data is present, the Session Manager then reads a set of crash parameters from the HKLM\SYSTEM\CurrentControlSet\Control\CrashControl registry key, one of which contains the name of the target dump file (typically %SystemRoot%\Memory.dmp, unless configured otherwise).
Smss.exe then checks whether the target dump file is on a different volume than the paging file. If so, it checks whether the target volume has enough free disk space (the size required for the crash dump is stored in the dump header of the page file) before truncating the paging file to the size of the crash data and renaming it to a temporary dump file name. (A new page file will be created later when the Session Manager calls the NtCreatePagingFile function.) The temporary dump file name takes the format DUMPxxxx.tmp, where xxxx is the current low-word value of the system’s tick count. (The system will attempt 100 times to find a nonconflicting value.) After renaming the page file, the system removes both the hidden and system attributes from the file and sets the appropriate security descriptors to secure the crash dump.
Next the Session Manager creates the volatile registry key HKLM\SYSTEM\CurrentControlSet\Control\CrashControl\MachineCrash and stores the temporary dump file name in the value DumpFile. It then writes a DWORD to the TempDestination value indicating whether the dump file location is only a temporary destination. If the paging file is on the same volume as the destination dump file, a temporary dump file isn’t used, because the paging file is truncated and directly renamed to the target dump file name. In this case, the DumpFile value will be that of the target dump file and TempDestination will be 0.
Later in the boot, Wininit checks for the presence of the MachineCrash key, and if it exists, Wininit launches WerFault (described in the next section), which reads the TempDestination and DumpFile values. If the TempDestination value is set to 1, which indicates a temporary file was used, WerFault moves the temporary file to its target location and secures the target file by allowing only the System account and the local Administrators group access. WerFault then writes the final dump file name to the FinalDumpFileLocation value in the MachineCrash key. These steps are shown in Figure 14-6.
To provide more control over where the dump file data is written to, for example on systems that boot from a SAN or systems with insufficient disk space on the volume where the paging file is configured, Windows also supports the use of a dedicated dump file that is configured in the DedicatedDumpFile and DumpFileSize values under the HKLM\SYSTEM\CurrentControlSet\Control\CrashControl registry key. When a dedicated dump file is specified, the crash dump driver creates the dump file of the specified size and writes the crash data there instead of to the paging file. If no DumpFileSize value is given, Windows creates a dedicated dump file using the largest file size that would be required to store a complete dump. Windows calculates the required size as the size of the total number of physical pages of memory present in the system plus the size required for the dump header (one page on 32-bit systems, and two pages on 64-bit), plus the maximum value for secondary crash dump data, which is 256 MB. If a full or kernel dump is configured but there is not enough space on the target volume to create the dedicated dump file of the required size, the system falls back to writing a minidump.