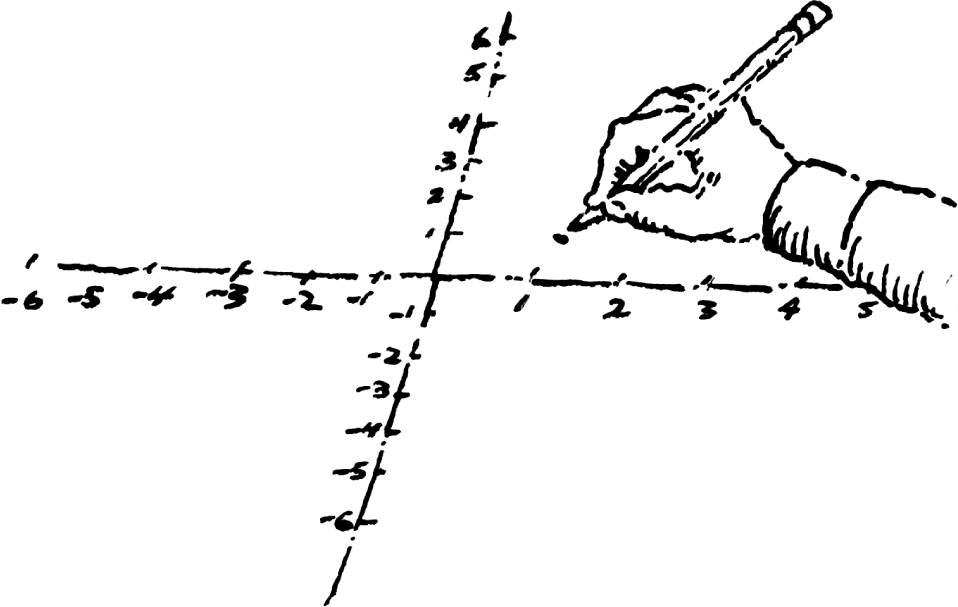
Points, lines, polygons, circles, and a variety of other figures can be graphed on a plane. To graph these figures, a grid is drawn. The grid, called a coordinate plane, shows where different points are located on the plane. Start by drawing a horizontal number line called the x-axis. Draw a vertical number line, called the y-axis, perpendicular to the x-axis.
Notice:
The x-axis and y-axis intersect at the origin.
Every point on the x-axis to the right of the y-axis is positive.
Every point on the x-axis to the left of the y-axis is negative.
Every point on the y-axis above the x-axis is positive.
Every point on the y-axis below the x-axis is negative.

Coordinate points are used to graph points on the coordinate plane. Coordinate points are written by placing two numbers, x and y, in parentheses, (x, y).
The first number, x, tells where the point is on the x-axis. Positive numbers are located to the right of the y-axis while negative numbers are located to the left of the y-axis. The second number, y, indicates where the point lies on the y-axis. Positive numbers move up above the x-axis, and negative numbers move down below the x-axis.
To graph a coordinate point, follow these four painless steps:
Step 1:Put your pencil at the origin.
Step 2:Look at the x-coordinate. If the number is negative, move the pencil to the left the same number of spaces as the x-coordinate. If the number is positive, move the pencil to the right the same number of spaces as the x-coordinate.
Step 3:Look at the y-coordinate, and move your pencil the same number of spaces as the y-coordinate. If the y-coordinate is negative move down, but if the y-coordinate is positive move up.
Step 4:Put a dot at this point.
Graph the point (3, 1).
Step 1:Put your pencil at the origin.
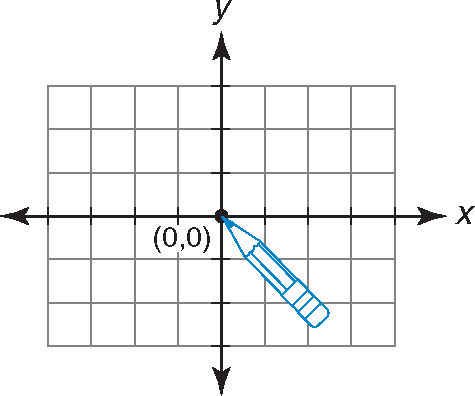
Step 2:Move your pencil right or left along the x-axis based on the x-coordinate.
Since the x-coordinate is 3, move your pencil to the right 3 spaces.
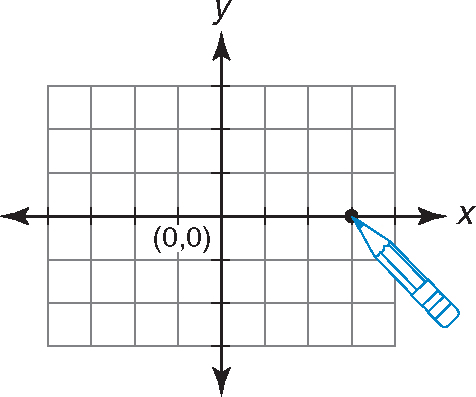
Step 3:Move your pencil up or down based on the y-coordinate. Since the y-coordinate is 1, move up 1 space.
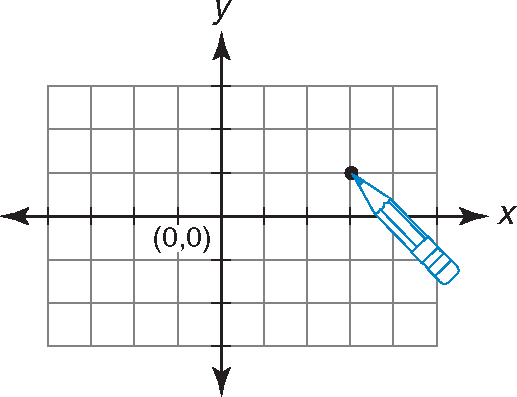
Step 4:Put a dot at this point.
Label the point (3, 1).

EXAMPLE:
Graph the point (0, –3).
Step 1:Put your pencil at the origin.

Step 2:Move your pencil right or left along the x-axis based on the x-coordinate. Since the x-coordinate is zero, keep your pencil at the origin.

Step 3:Move your pencil up or down based on the y-coordinate. Since the y-coordinate is –3, move down three spaces.
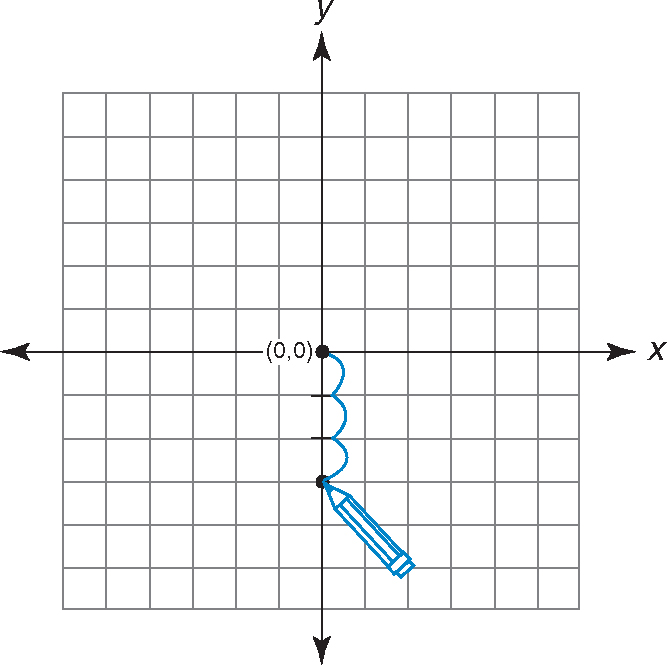
Step 4:Put a dot at this point.
Label the point (0, –3).
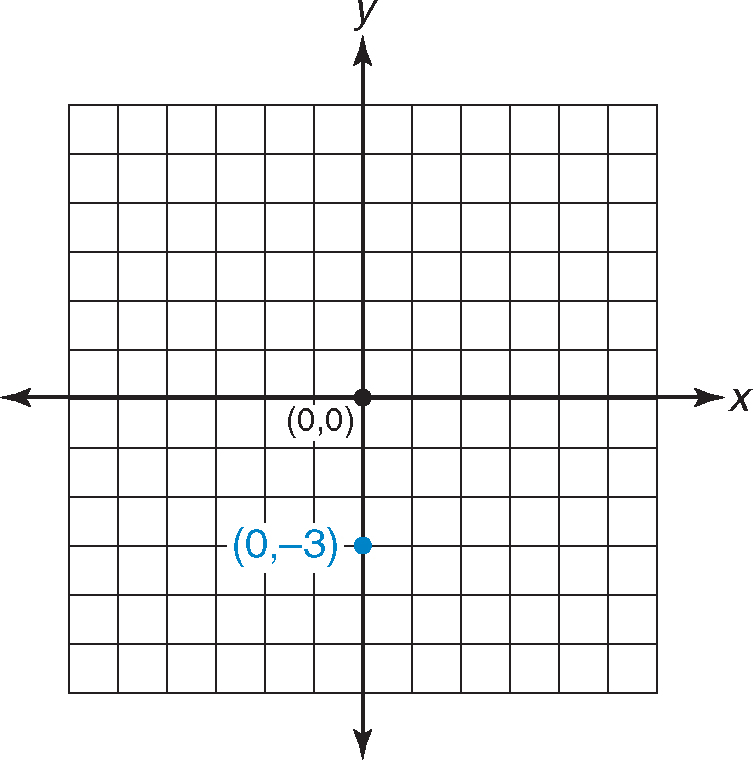

Graph the following points on the coordinate axis below.
1.(1, –3)
2.(–1, 2)
3.(4, 1)
4.(–2, –2)
5.(5, 0)
(Answers)
The coordinate plane is divided into four quadrants.

It’s possible to determine in which quadrant a point is located just by looking at the coordinates.
Points that contain both a positive x and a positive y are located in quadrant I.
Points that contain a negative x and a positive y are located in quadrant II.
Points that contain both a negative x and a negative y are located in quadrant III.
Points that contain a positive x and a negative y are located in quadrant IV.


In which quadrant are the following points located?
1.(–3, 4)
2.(2, 2)
3.(100, –4)
4.(–2, –2)
5.(0, 0)
(Answers)
The midpoint of a line segment is the single point equidistant from both endpoints. It’s easy to find the midpoint of the segment with the endpoints (0, 0) and (2, 0). Just graph the two points and connect them.
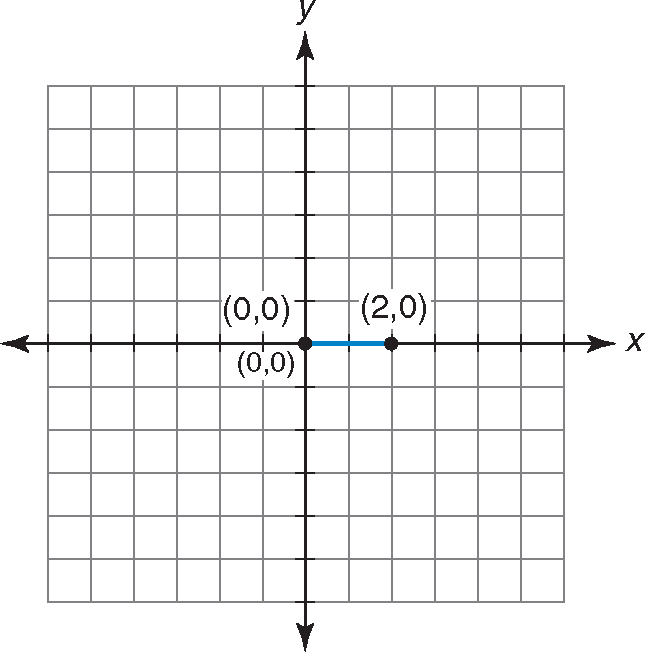
It’s obvious that the midpoint is (1, 0) since this segment is just 2 units long. But finding the midpoint of other segments is not so easy. You have to use the midpoint formula.
Midpoint Formula
The midpoint of the line segment with endpoints (x1, y1) and (x2, y2) is
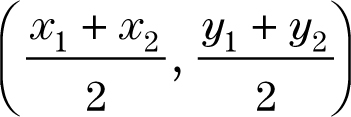
The midpoint formula uses subscripts, which are the small numbers written after the letters x and y. The small letters after the x and y are used to tell the difference between the different x’s and y’s used in the equation.
x1 is read x sub one.
x2 is read x sub two.
y1 is read y sub one.
y2 is read y sub two.
To find the midpoint of a line segment, just follow these painless steps:
Step 1:Find the endpoints of the line segment.
Step 2:Add the two x-coordinates and divide by 2.
Step 3:Add the two y-coordinates and divide by 2.
Step 4:The answers to Step 2 and Step 3 are the coordinates of the midpoint.
EXAMPLE:
Find the midpoint of the segment that connects the points (3, 2) and (1, 6).
Step 1:Find the coordinates of the endpoints of the segment. The endpoints are given as (3, 2) and (1, 6).
Step 2:Add the x-coordinates and divide by 2.

Step 3:Add the y-coordinates and divide by 2.

Step 4:The coordinates of the midpoint are (2, 4).
EXAMPLE:
Find the midpoint of the segment that connects the points (0, –3) and (4, –1).
Step 1:Find the coordinates of the endpoints of the segment. The endpoints are given as (0, –3) and (4, –1).
Step 2:Add the x-coordinates and divide by 2.

Step 3:Add the y-coordinates and divide by 2.

Step 4:The coordinates of the midpoint are (2, –2).
Experiment
Find the midpoint of the line segment.
Materials
Graph paper
Pencil
Ruler

Procedure
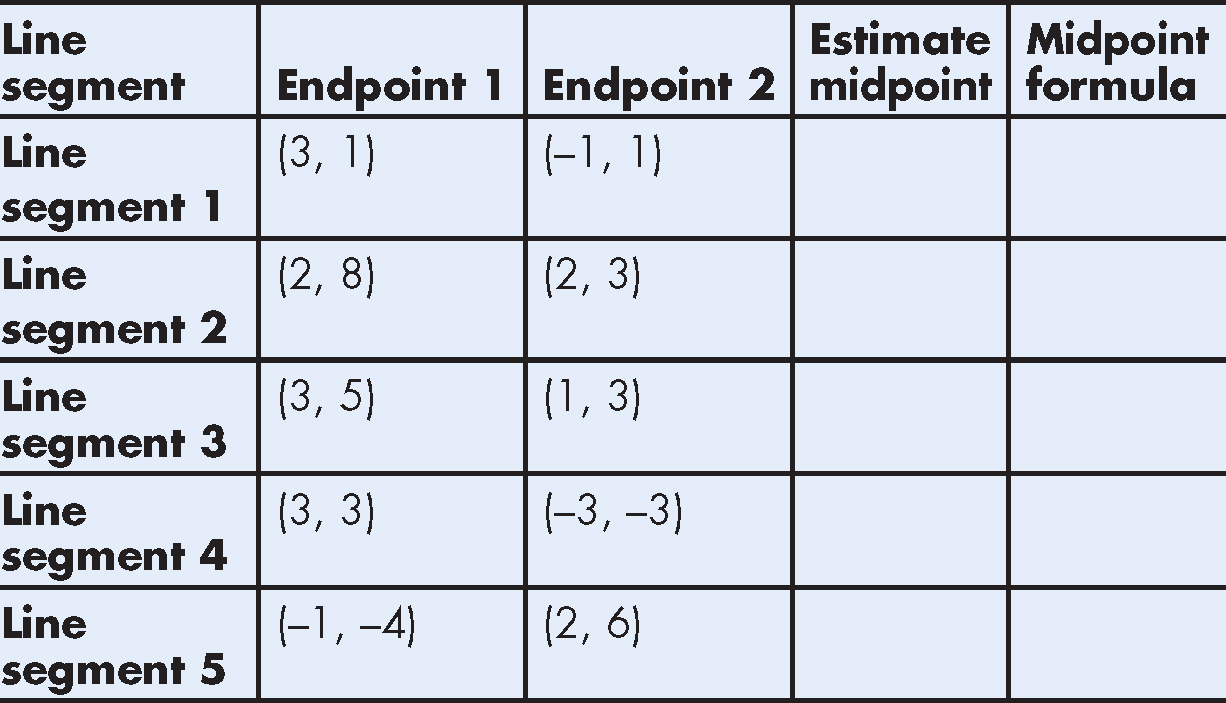
1.Graph each of the line segments.
2.Estimate the midpoint of each segment by examining the line segment. Enter your estimate in the chart.
3.Determine the midpoint of each segment using the midpoint formula:
Enter the results in the chart.
Something to think about . . .
What is the difference between your estimate and using the midpoint formula?

Find the midpoint of each of the segments formed by connecting the following pairs of points.
1.(6, 4) and (–2, 6)
2.(2, 2) and (8, 8)
3.(–3, –3) and (5, 5)
4.(0, –2) and (4, 0)
(Answers)
The length of a line segment is the distance from one end of the segment to the other. Distance is measured in units (i.e., inches, feet, meters).
To find the length of a line segment, just follow these painless steps:
Step 1:Find the endpoints of the line segment.
Step 2:Subtract the smaller x-coordinate from the larger x-coordinate.
Step 3:Square the difference.
Step 4:Subtract the smaller y-coordinate from the larger y-coordinate.
Step 5:Square the difference.
Step 6:Add Step 3 and Step 5.
Step 7:Take the square root of Step 6. That’s the distance from one end of the segment to the other.
EXAMPLE:
What is the distance between the points (5, 5) and (1, 2)?
Step 1:Find the endpoints of the line segment. The endpoints of the segment are given as (5, 5) and (1, 2).
Step 2:Subtract the smaller x-coordinate from the larger x-coordinate.
5 – 1 = 4
Step 3:Square the difference.
4 × 4 = 16
Step 4:Subtract the smaller y-coordinate from the larger y-coordinate.
5 – 2 = 3
Step 5:Square the difference.
3 × 3 = 9
Step 6:Add Step 3 and Step 5.
16 + 9 = 25
Step 7:Take the square root of Step 6.

The distance between the points (1, 2) and (5, 5) is 5.
Find the length of a line segment using the Pythagorean theorem.
Materials
Graph paper
Pencil
Ruler

Procedure
1.Draw a set of coordinate axes on a piece of graph paper.
2.Pick any two points and connect them.
3.Make a right triangle using the two points as two of the vertices of the triangle.
Draw a line parallel to the x-axis through the point with the lower y value.
Draw a line parallel to the y-axis through the point with the higher y value. Where the two lines intersect is the right angle of the right triangle.
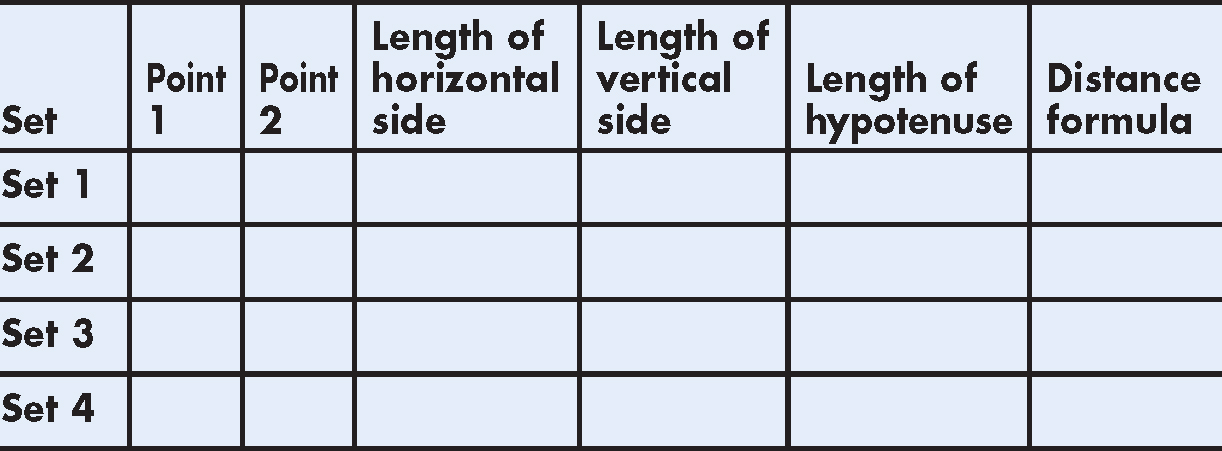
4.Count the squares to determine the length of each side of the triangle. Enter the results in the chart.
5.Compute the length of the hypotenuse. Use the Pythagorean theorem. Enter the results in the chart.
6.Compute the distance between the two points using the distance formula. Enter the results in the chart.
7.Repeat steps 1 to 6, picking another set of 2 points.
8.Repeat steps 1 to 6 until the chart is complete.
Something to think about . . .
Compare the answers you found using the distance formula to the length of the hypotenuse. Are they different?

Find the distance between these two points.
1.(4, 2) and (1, 6)
2.(0, 6) and (1, 4)
3.(–3, 2) and (4, –1)
4.(–2, 0) and (0, 1)
(Answers)
GRAPHING A LINE BY PLOTTING POINTS
An equation of a line has x- and/or y-variables. The following equations are lines.
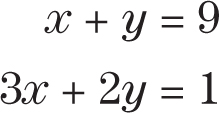
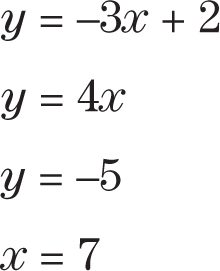
These are not equations of a line, since these equations have an x2 term and/or a y2 term.
3x2 + 5y = 7
2x + 9y2 = 1
3x2 – 2y2 = 4
There are several ways to graph a line. The easiest way is plotting points. You can graph a line with only two points, since two points determine a line. But it is best to plot three points to make sure you didn’t make a mistake. You can pick any numbers you want. Why not pick numbers that make the calculations easy?
To plot points, just follow these five painless steps:
Step 1:Substitute 0 for x and solve for y.
Step 2:Substitute 1 for x and solve for y.
Step 3:Substitute –1 for x and solve for y.
Step 4:Graph the three points.
Step 5:Connect the three points to form a line. Label the line.
If the three points do not lie in a straight line, you have solved one of the equations incorrectly or graphed one of the three points incorrectly.
EXAMPLE:
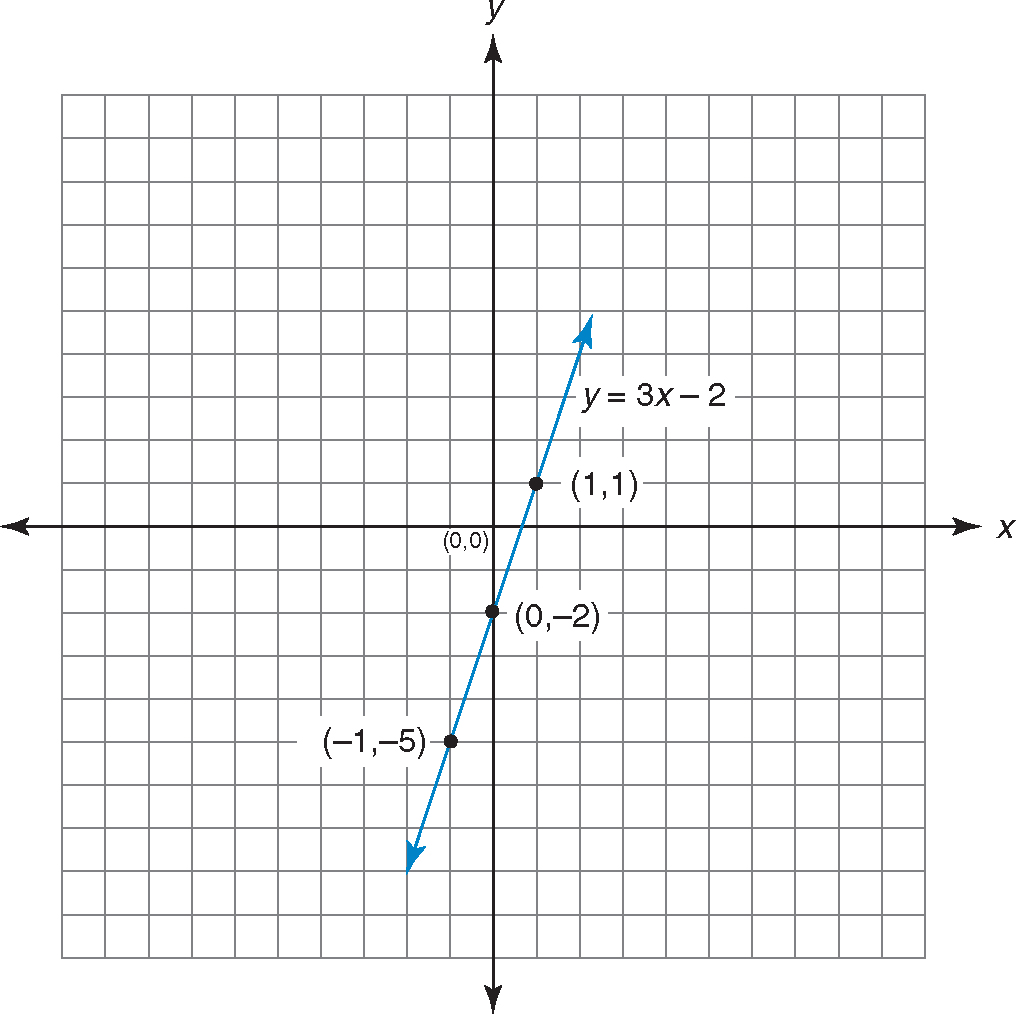
Graph the equation y = 3x – 2.
Step 1:Substitute 0 for x and solve for y.
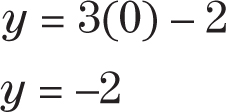
The first point is (0, –2).
Step 2:Substitute 1 for x in the equation and solve for y.
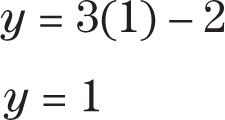
The second point is (1, 1).
Step 3:Substitute –1 for x in the equation and solve for y.
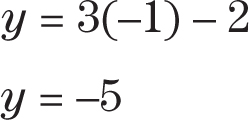
The third point is (–1, –5).
Step 4:Graph the points.

Step 5:Connect the points to form the line y = 3x – 2. Label the line.

Graph the following lines.
1.y = 4x – 6
2.2x + 2y = 10
3.x = y
(Answers)
GRAPHING HORIZONTAL AND VERTICAL LINES
Horizontal and vertical lines are exceptions to the graphing rule. Horizontal lines do not have an x term. They are written in the form y = some number. y = 3, y = 0, and y = –7 are all horizontal lines.
EXAMPLE:
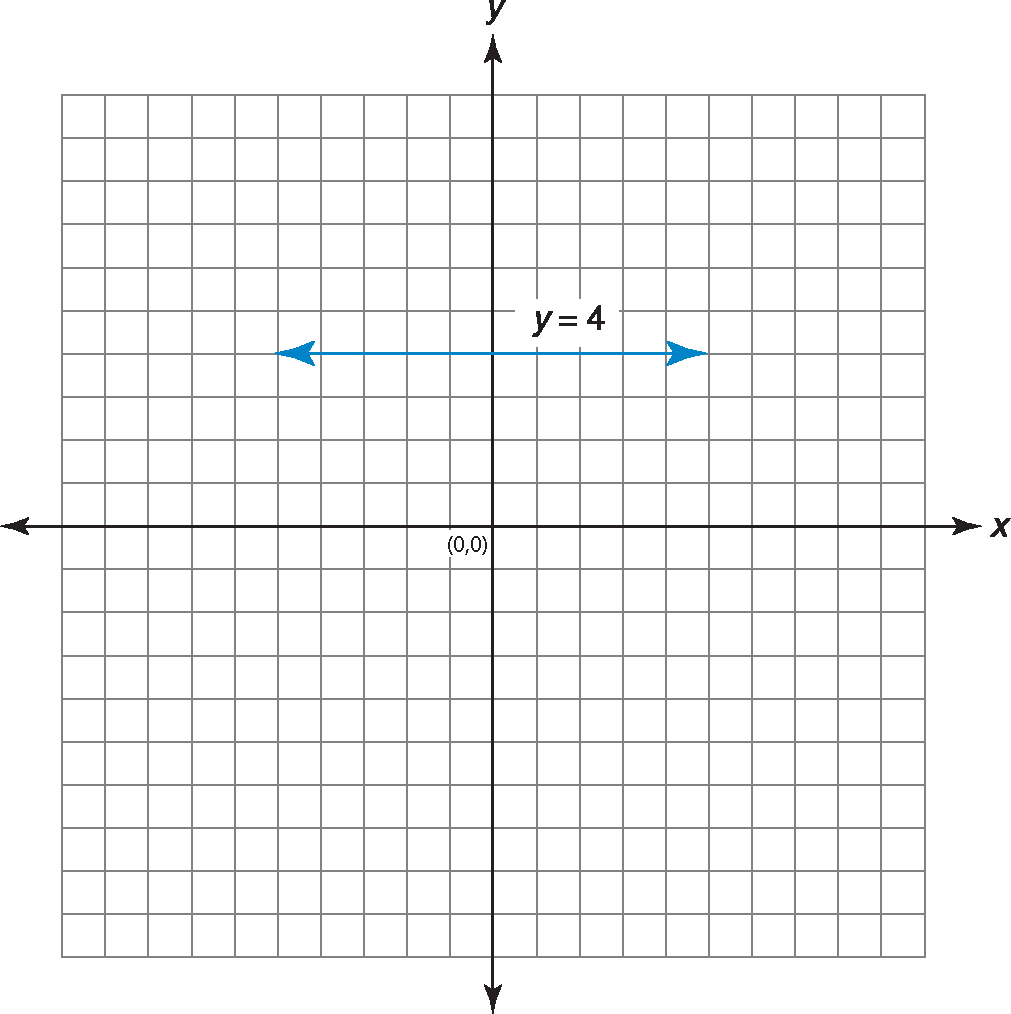
Graph the equation y = 4.
Just plot points.
If x is 0, y is 4.
If x is 1, y is 4
If x is –1, y is 4.
No matter what number x is, y is always 4.
The graph of y = 4 is a horizontal line that intersects the y-axis at 4.
Graph the line y = –2. Just draw a horizontal line at y = –2 parallel to the x-axis, since no matter what x is, y = –2.

Vertical lines do not have a y term. They are parallel to the y-axis. These lines are parallel to the y-axis: x = 1, x = –5, and x = 0.
EXAMPLE:
Graph the equation x = –2.
Just plot points.
If y = 1, x = –2.
If y = –1, x = –2.
If y = 0, x = –2.
No matter what number y is, x is always –2.
The graph of x = –2 is a vertical line that intersects the x-axis at –2.
EXAMPLE:
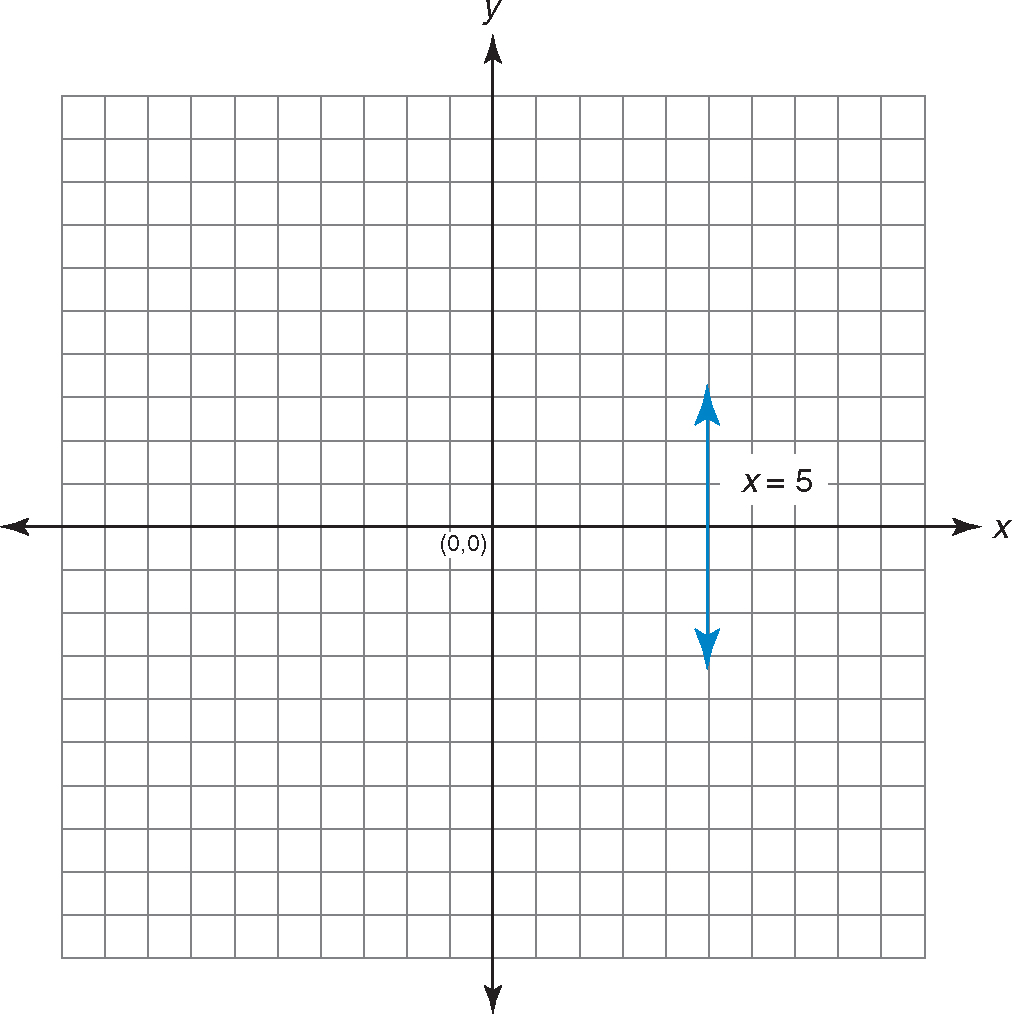
Graph the equation x = 5. Just graph a line parallel to the y-axis at x = 5, since no matter what y is, x is always 5.

Decide whether each of the following statements is true or false.
1.The line y = 4 is parallel to the x-axis.
2.The line x = –1 intersects the x-axis.
3.The line y = 3 intersects the y-axis.
4.The line y = 0 is the x-axis.
5.The line x = 0 is the x-axis.
6.The line x = 3 is parallel to the y-axis.
(Answers)
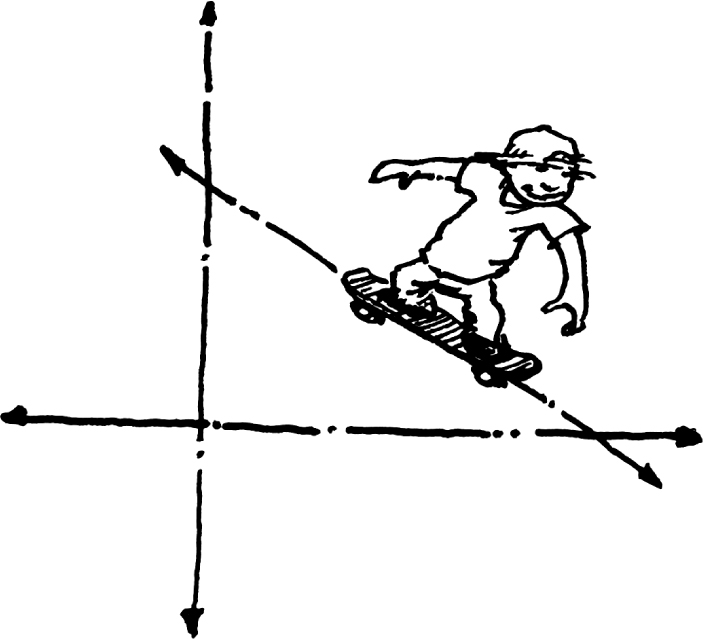
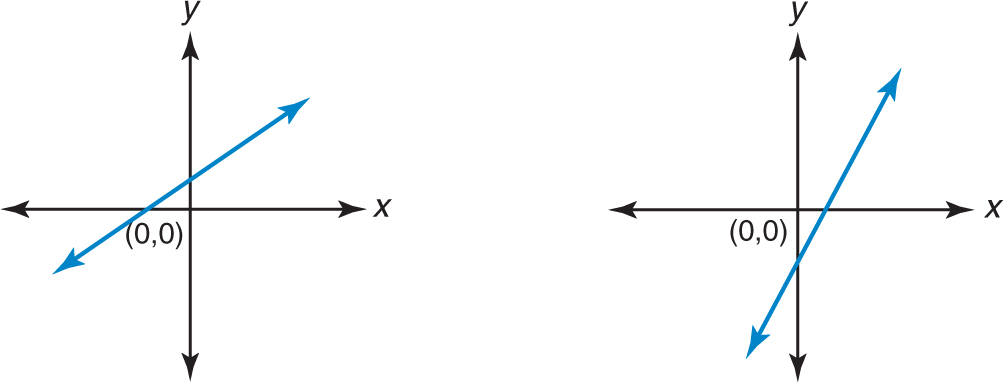
The slope of a line is a measure of the incline of the line. A positive slope indicates that the line goes uphill if you are moving from left to right. These lines have positive slopes.
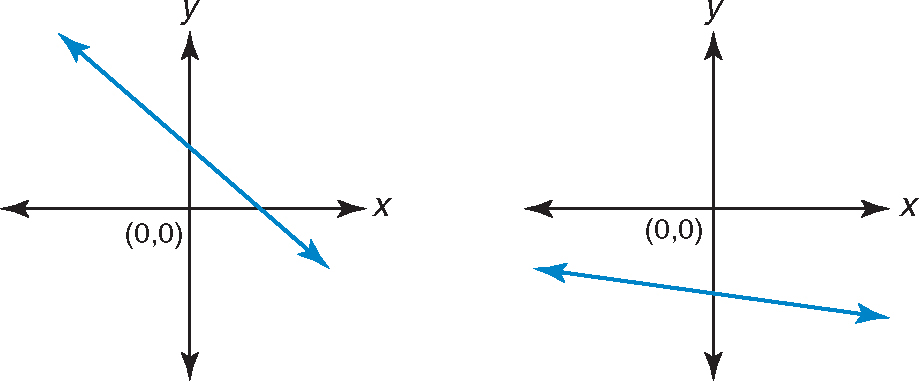
A negative slope indicates that a line goes downhill if you are moving from left to right. These lines have negative slopes.
There are two common ways to find the slope of a line.
1.Putting an equation in slope-intercept form.
2.Using the point-point method.
Method 1: Slope-intercept method
To change an equation to slope-intercept form, just follow these two painless steps:
Step 1:Solve the equation for y.
Step 2:The variable in front of the x is the slope.
EXAMPLE:
Find the slope of the line 2x + y – 2 = 0.
Step 1:Solve the equation 2x + y – 2 = 0 for y.
Subtract 2x from both sides of the equation.
y – 2 = –2x
Add 2 to both sides of the equation.
y = –2x + 2
Step 2:The number in front of x is the slope.
–2 is in front of x, so –2 is the slope.
EXAMPLE:
Find the slope of the equation 3x + 6y = 18.
Step 1:Solve the equation 3x + 6y = 18 for y.
Subtract 3x from both sides of the equation.
6y = –3x + 18
Divide both sides of the equation by 6.
y = –  x + 3
x + 3
Step 2:The number in front of the x is the slope.
The slope is –  .
.
Change each of the following equations to slope-intercept form and find the slope.
1.5x – y + 2 = 0
2.4x + 2y = –8
3.7y = –3x
4.x + 2y = 1
(Answers)
Method 2: Point-point method
To find the slope of a line using the point-point method, just find two points on the line.
Using two points to find the slope of a line is painless:
Step 1:Find two points on the line.
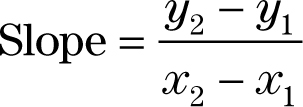
Step 2:Subtract the first y-coordinate (y1) from the second y-coordinate (y2) to find the change in y.
Step 3:Subtract the first x-coordinate (x1) from the second x-coordinate (x2) to find the change in x.
Step 4:Divide the change in y (Step 2) by the change in x (Step 3). The answer is the slope of the line.
EXAMPLE:
Find the slope of a line through the points (3, 2) and (7, 1).
Step 1:Find two points on the line. Two points on the line are given: (3, 2) and (7, 1).
Step 2:Subtracting the second y-coordinate from the first y-coordinate, find the change in y.
2 – 1 = 1
Step 3:Subtracting the second x-coordinate from the first x-coordinate, find the change in x.
3 – 7 = – 4
Step 4:Find the slope of the line by dividing the change in y (Step 2) by the change in x (Step 3).

The slope is –  .
.
Estimate the slope of a line.
Materials
Pencil
Graph paper
Ruler
Procedure
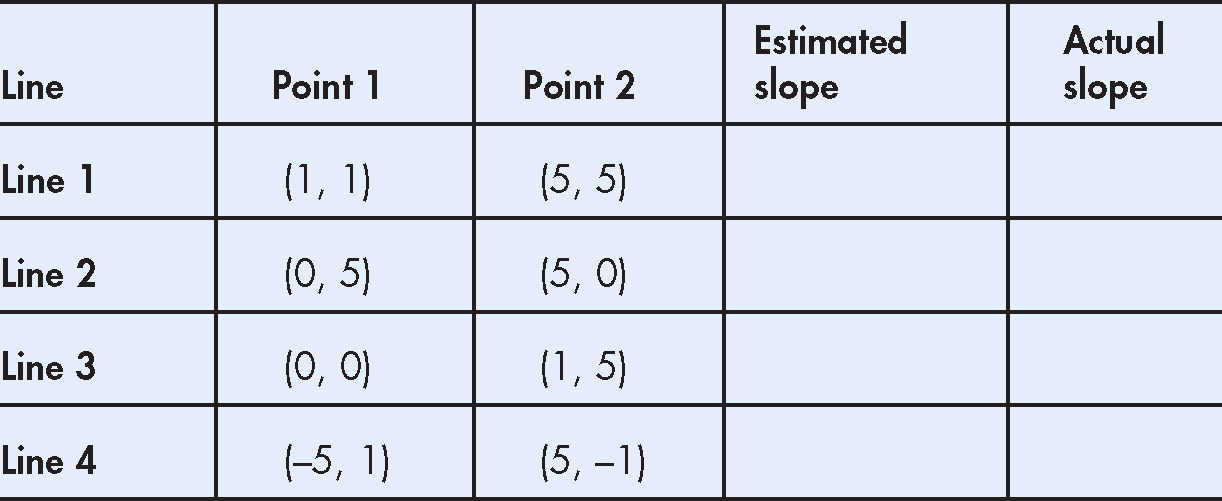
1.Graph the pairs of points shown in the chart.
2.Connect each pair of points to form a line.
3.Look at each line and try to estimate the slope. Enter your guess in the chart.
Use these tips for help.
•If the slope goes uphill, it is positive.
•If the slope goes downhill, it is negative.
•The steeper the slope, the higher the number.
•Flatter lines have slopes less than 1.
4.Compute the slope by finding the change in y divided by the change in x. Enter your results in the chart in the column labeled “Actual slope.”
5.Compare your estimates to the actual slopes.
Something to think about . . .
What would a line with slope  look like compared to a line with slope 10?
Find the slope of the line through the following points.
1.(3, 0) and (0, –2)
2.(7, 1) and (2, 6)
3.(0, 0) and (5, 3)
4.(–3, –2) and (1, 1)
(Answers)
GRAPHING USING SLOPE-INTERCEPT
The easiest way to graph a line is to use the slope-intercept method. The words slope-intercept refer to the form of the equation. When an equation is in slope-intercept form it is written in terms of a single y.

Equations in slope-intercept form have the form y = mx + b.
y is a variable.
m represents the number of x’s the equation contains.
b stands for the number in the equation. It also tells you where the equation intercepts the y-axis.
Follow these six painless steps to graph an equation using the slope-intercept form.
Step 1:Put the equation in slope-intercept form. Express the equation of the line in terms of a single y. The equation should have the form y = mx + b.
Step 2:The number without any variable after it (the b term) is the y-intercept. The y-intercept is where the line crosses the y-axis. Make a mark on the y-axis at the y-intercept. If the equation has no b term, the y-intercept is 0.
Step 3:The number in front of the x is the slope. In order to graph the line, the slope must be written as a fraction. If the slope is a fraction, leave it as it is. If the slope is a whole number, place it over 1.
Step 4:Start at the y-intercept and move your pencil up the y-axis the number of spaces in the numerator of the slope.
Step 5:If the fraction is negative, move your pencil to the left the number of spaces in the denominator in the slope. If the fraction is positive, move your pencil to the right the number of spaces in the denominator of the slope. Mark this point.
Step 6:Construct a line that connects the point on the y-axis with the point where the pencil ended up.
An equation in slope-intercept form has the form y = mx + b, where m is the slope and b is where the line intercepts the y-axis.
EXAMPLE:
Graph the line 2y – 4x = 8.
Step 1:Put equation 2y – 4x = 8 in slope-intercept form.
Express the equation in terms of a single y. 2y – 4x = 8
2y = 4x + 8
Divide both sides of the equation by 2.
y = 2x + 4
This equation is now in slope-intercept form.
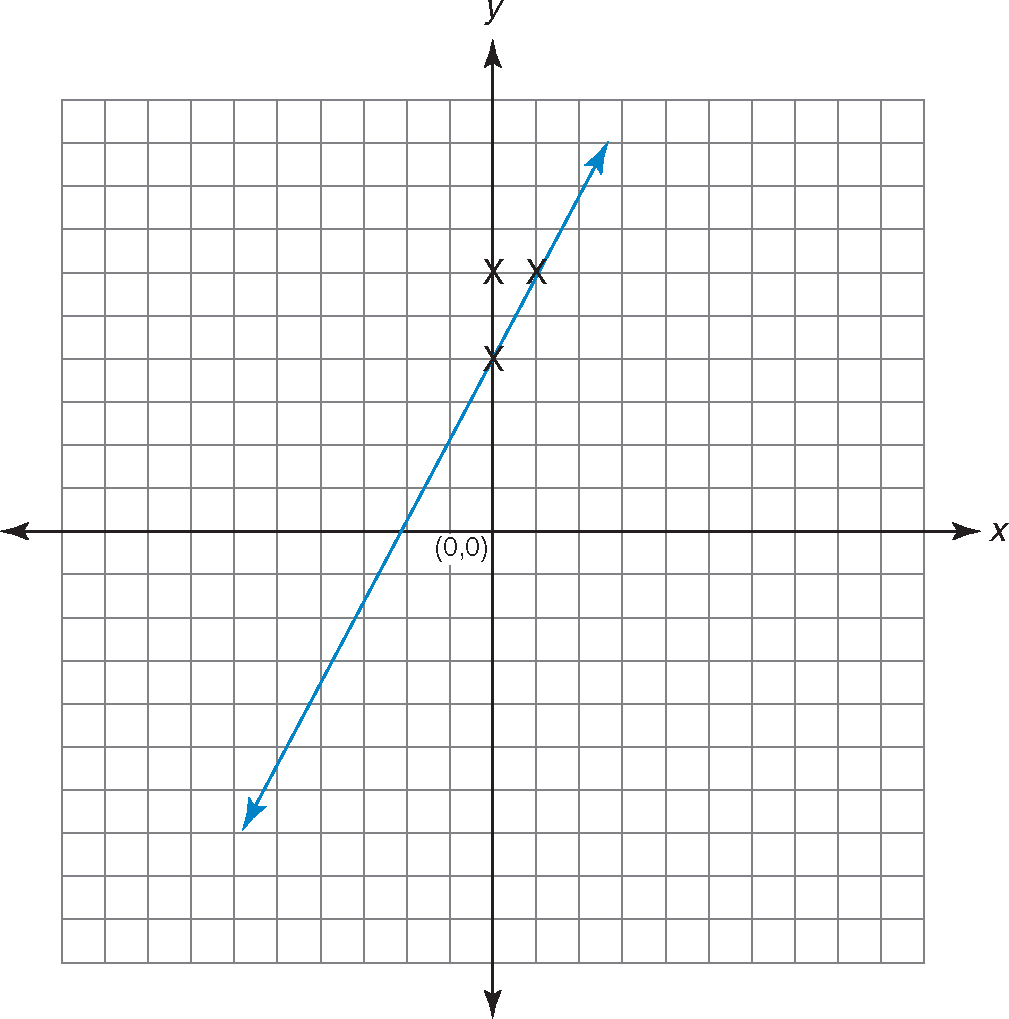
Step 2:The number at the end of the equation without any variable after it is the y-intercept. The y-intercept is where the line crosses the y-axis. Make a mark at the y-intercept. The y-intercept is 4.
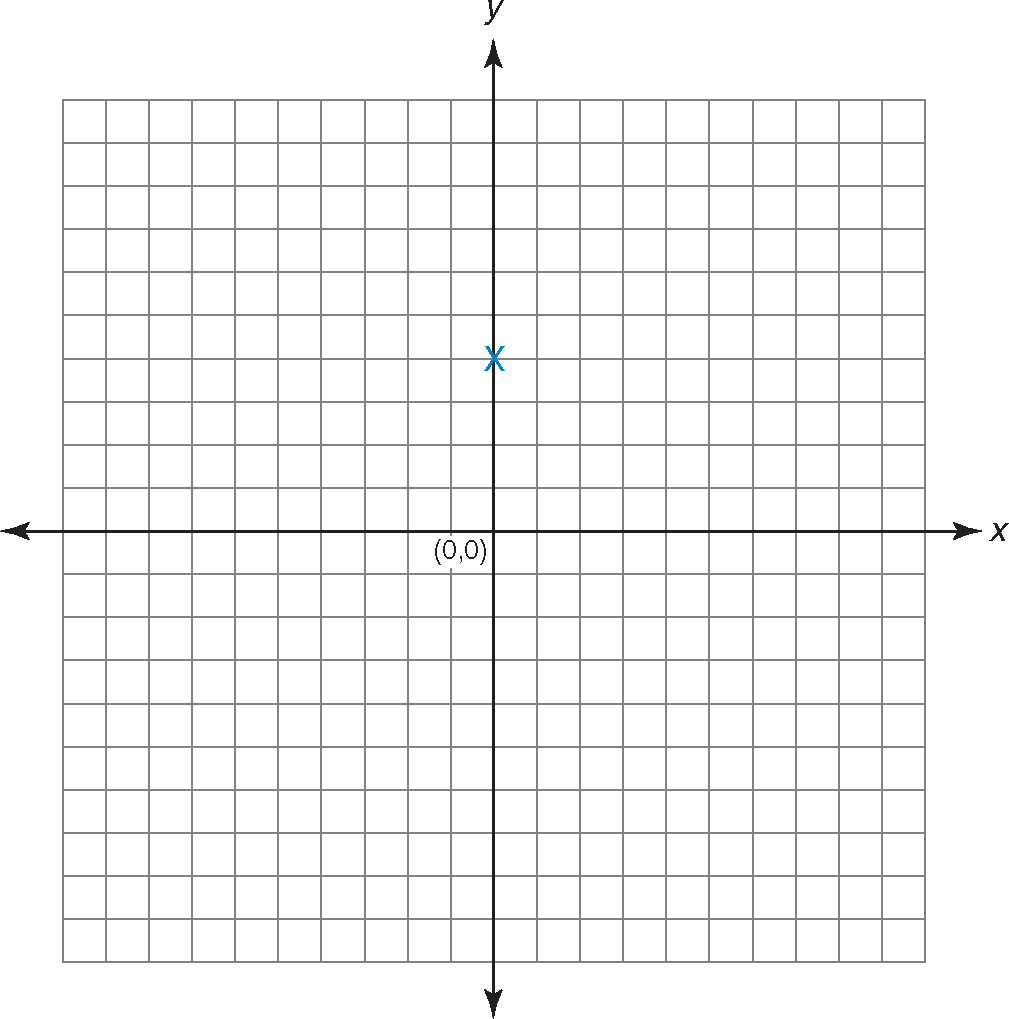
Step 3:The number in front of the x is the slope. If the slope is a whole number, place it over 1. If it is a fraction, leave it as it is. The slope is 2, so change it to  .
.
Step 4:Look at the numerator. Start at the y-intercept and move your pencil up the y-axis the number of spaces in the numerator. The numerator is 2, so move up two spaces to the point y = 6.
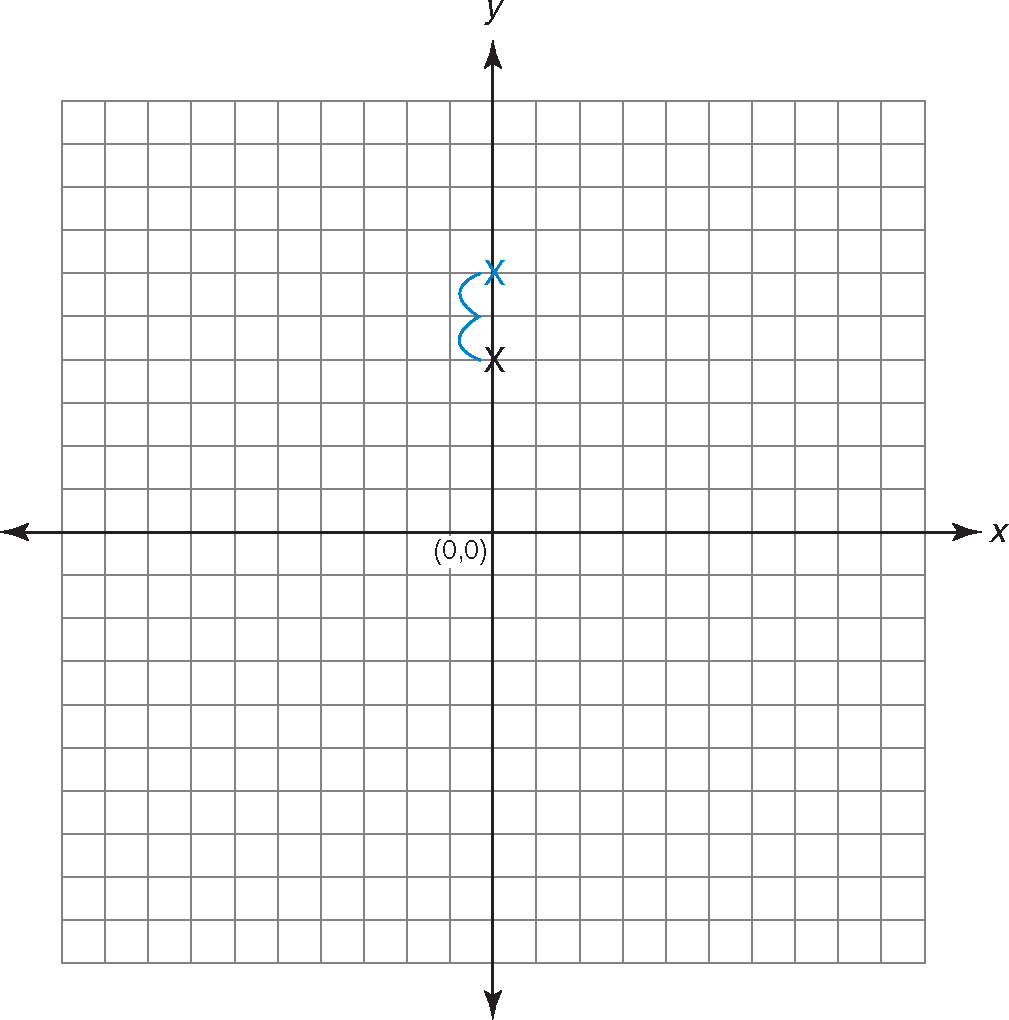
Step 5:Look at the denominator. If the fraction is negative, move your pencil to the left the number of spaces in the denominator. If the fraction is positive, move your pencil to the right the number of spaces in the denominator. The fraction is positive and the denominator is 1, so move your pencil one space to the right.

Step 6:Connect the point on the y-axis with the point where the pencil ended up and extend both ends to form a line.

What is the slope and y-intercept of each of these lines?
1.y = 3x – 2
2.2y = 2x
3.4x – 4y = 8
4.2y – x = –10
5.y = 3
(Answers)
FINDING THE EQUATION OF A LINE
If you know the slope of a line and a point on the line, you can find the equation of the line.
Just follow these four painless steps to find the equation of a line.
Step 1:Substitute the slope of the line for m in the equation y = mx + b.
Step 2:Substitute the coordinates of the point on the line for the variables x and y in the equation y = mx + b.
Step 3:Solve for b.
Step 4:Substitute m and b into the equation y = mx + b to find the equation of a line.
EXAMPLE:
Find the equation of the line with slope –5 and through the point (–2, –1).
Step 1:Substitute the slope, which is –5, for m in the equation y = mx + b.
y = –5x + b
Step 2:Substitute the coordinates of the point on the line for the variables x and y in the equation y = mx + b.
(–1) = –5(–2) + b
Step 3:Solve for b.
(–1) = (–5)(–2) + b
(–1) = 10 + b
b = –11
Step 4:Substitute m and b into the equation y = mx + b to find the equation of a line. The equation of the line is
y = –5x – 11

Find the equation of each of these lines.
1.Slope = 2 and point (4, –4)
2.Slope = 1 and point (1, 1)
3.Slope =  and point (0, –1)
(Answers)
If you know any two points, you can also find the equation of the line.
Just follow these four painless steps to find the equation of a line.
Step 1:Find the slope of the line. Divide the change in y by the change in x.
Step 2:Substitute the slope (m) into the equation y = mx + b.
Step 3:Substitute one pair of coordinates into the equation for x and y and solve for b.
Step 4:Substitute m and b into the equation y = mx + b to find the equation of a line.
EXAMPLE:
Find the equation of the line through the points (3, 4) and (6, 2).
Step 1:Find the slope of the line.
Subtract one pair of coordinates from the other set of coordinates.
The change in y is 4 – 2 or 2.
The change in x is 3 – 6 or –3.
Divide the change in y by the change in x to find the slope.
The slope is –  .
.
Step 2:Substitute the slope (m) into the equation y = mx + b.

Step 3:Substitute one pair of coordinates into the equation for x and y and solve for b.
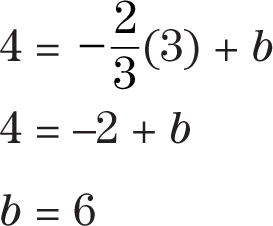
Step 4:Substitute m and b into the equation y = mx + b. As a result, the equation of a line through the points (3, 4) and (6, 2) is


Find the equation of the line through each pair of points.
1.(1, 1) and (6, 2)
2.(0, 5) and (2, 0)
3.(3, –1) and (4, –2)
(Answers)
Another way to find the equation of the line is by using the point-slope formula.
Point-slope formula: y – y1 = m(x – x1)
where x1 and y1 are the coordinates of a single point on the line, and m is the slope of the line.
EXAMPLE:
Find the equation of a line with slope 3 and point (2, 5). Substitute x = 2, y = 5, and m = 3 into the point-slope formula.
Solve.

EXAMPLE
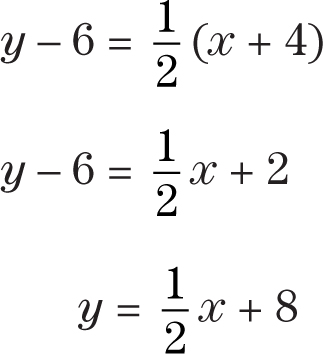
Find the equation of a line with slope  and point (– 4, 6).
Substitute x = – 4, y = 6, and m =  into the point-slope formula.

Solve.

1.What is the equation of a line with point (3, 5) and slope –2?
2.What is the equation of a line with point (0, 0) and slope 1?
3.What is the equation of a line with point (–2, –6) and slope –1?
4.What is the equation of a line with point (1, 1) and slope 0?
(Answers)
1.What is the equation of a line that goes through the point (5, 5) and has slope –2?
2.What is the equation of a line that goes through the point (–3, 3) and has slope 0?
(Answers)
PARALLEL AND PERPENDICULAR LINES
Experiment
Learn the relationship between lines with the same slope.
Materials
Graph paper
Pencil
Ruler
1.Graph all three of the following equations on the same pair of coordinate axes.

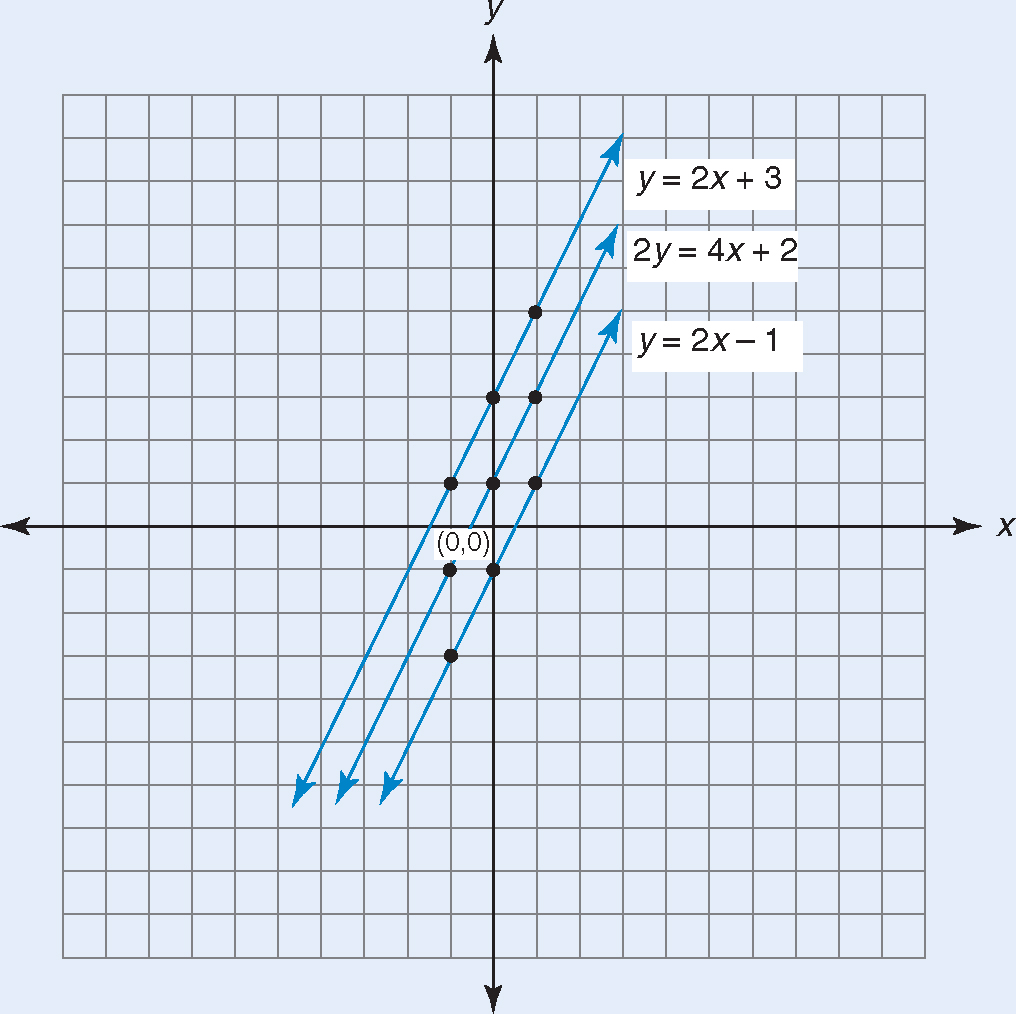
2.What do you notice about the lines you graphed?
Something to think about . . .
What do the equations you graphed have in common?
What do the equations y = −x, y = −x + 1, and y = −x + 4 have in common?
Theorem: If two lines are parallel, then they have the same slope.
EXAMPLE:
y = 2x + 1 and y = 2x – 6 are parallel since they both have a slope of 2.
Experiment
Discover the relationship between perpendicular lines.
Materials
Graph paper
Pencil
Ruler
Procedure
1.Graph the following pair of points (0, 0) and (3, 3).
2.Connect the points to form line 1.
3.Graph the following points (3, 0) and (0, 3).
4.Connect the points to form line 2.
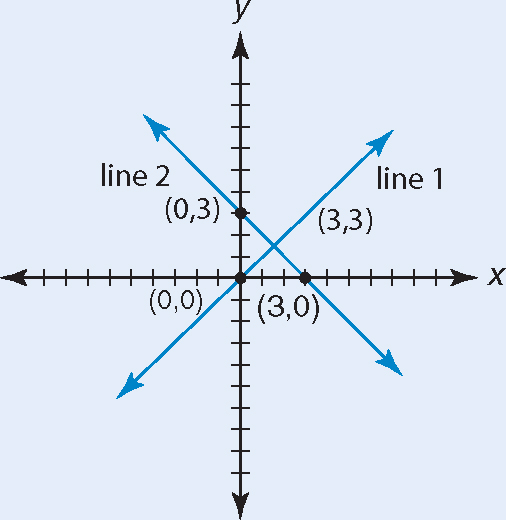
5.Line 1 and line 2 should be perpendicular to each other.
6.Determine the slope of line 1.
7.Determine the slope of line 2.
8.Multiply the two slopes together. What’s your answer?
9.On a second set of coordinate axes draw line 1 through the points (0, 1) and (1, 3).
10.Draw line 2 through the points (0, 1) and (2, 0).
11.Line 1 should be perpendicular to line 2.
12.Find the slope of both these lines and multiply them together. What’s your answer?
13.Do you notice a pattern?
Something to think about . . .
How can you tell if two lines are perpendicular to each other?
Theorem: If two lines are perpendicular, then the slope of one line is the negative reciprocal of the slope of the other line.
Theorem: If the slope of one line is the negative reciprocal of the slope of another line, then the lines are perpendicular.
EXAMPLE:
y = –3x + 2 and y =  x – 1 are perpendicular lines.
Multiply the slope of the first line (–3) times the slope of the second line  . The answer is (–1).
Look at the following pairs of equations. Determine whether each pair of lines is perpendicular, parallel, or neither.
1.y = 3x – 3 and y = –  x + 3
x + 3
2.y = 2x + 5 and y = 2x + 7
3.y = –4x + 1 and y = –6x – 2
4.2y = x + 1 and y =  x + 3
x + 3
(Answers)
1.What quadrant is the point (3, –2) located in?
2.What is the midpoint of the segment with endpoints (3, 2) and (–7, 0)?
3.What is the distance between the points (–1, –1) and (4, 5)?
4.Put the line 2x + 10y = 40 in slope-intercept form.
5.Find the slope of the line through the points (5, 1) and (–1, –2).
6.Find the equation of the line with slope 4 and intercept (0, 0).
7.At what point does the line y = 4 cross the y-axis?
8.At what point does the line x = 4 cross the y-axis?
9.What is the equation of the y-axis?
10.What is the equation of the line through the points (3, 5) and (1, 8)?
11.What is the relationship between the lines y = – x + 1 and y = 2x?
12.What is the relationship between the lines 10y = –5x + 4 and y = –  x –1?
x –1?
(Answers)