Remote sensing provides powerful tools with which to monitor the cryosphere. A vast array of satellite “eyes in the sky” now routinely examine terrestrial targets in various regions of the electromagnetic spectrum (table B.1). Instruments onboard these satellites give a hemisphere-wide view and yield a wealth of information on the state of the cryosphere. Among these are seasonal and long-term changes in snow cover and sea ice extent, sea ice and ice sheet thickness, thinning and breakup of ice shelves, wandering icebergs, and surging glaciers. Satellite remote sensing proves immensely useful not just for monitoring the cryosphere, but also for tracking changes in global sea level, ocean circulation, land use changes, crop conditions, and weather patterns, and for discovering new mineral deposits.
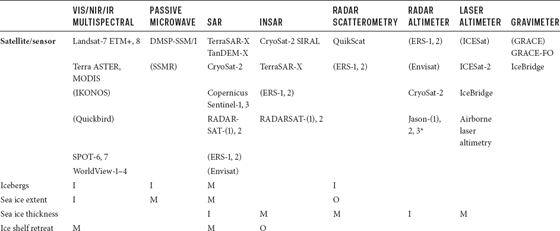
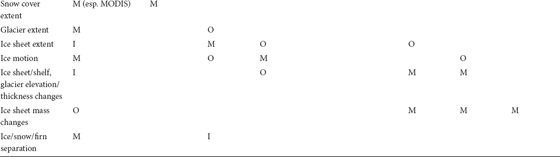
TABLE B.1 Satellite Sensors Used for Remote Sensing of the Cryosphere
* The Jason-1–3 radar altimeters are chiefly used for determination of sea surface heights and monitoring of ocean circulation. They have been extensively used for determination of recent sea level–rise trends.
Note: M: Major data source; I: Important data source; O: Occasional data source. Satellites in parentheses are no longer active.
Instruments aboard satellites detect radiation either reflected or emitted from the Earth’s surface over the visible, infrared, and microwave regions of the electromagnetic spectrum. Others monitor the Earth’s gravitational field. Not intended as a comprehensive review of the subject, which lies beyond the scope of this book, appendix B instead provides a basic introduction to remote sensing, mentions some of the most frequently used satellites and instruments for cryospheric studies, and lists some useful sources.
Table B.1 summarizes some of the main cryospheric applications of satellite sensors covering various parts of the electromagnetic spectrum. For more detailed information, please consult the references listed in the Bibliography.
VISIBLE/NEAR-INFRARED/THERMAL INFRARED (VIS/NIR/TIR)
Like human eyes, satellite-borne instruments that are sensitive to visible light (~0.4–0.7 micrometers, µm) detect sunlight reflected off surfaces. Because fresh ice and snow reflect more light, they appear much brighter than most other materials, including vegetation, bare soil, rock, and water, and therefore contrast markedly with their surroundings. However, visible sensors operate effectively only in daylight and in clear, cloud-free weather. Satellite sensors that “see” the near-infrared region and beyond have greatly expanded our understanding of glaciers and other cryospheric constituents. Infrared instruments, for example, detect the amount of heat emitted by objects at the Earth’s surface, which is a measure of their temperature. Infrared sensors detect features even at night and readily distinguish sea ice from ocean water because of the sharp temperature contrast. For example, while sea ice winter temperatures plunge to −20° to −40°C (−4° to −40°F), open ocean water remains above freezing (otherwise it too would be ice covered). Dark meltwater pools on ice in summer have a low albedo, approaching that of ocean water. Clouds, which also absorb, emit, and reflect infrared radiation, can complicate the detection of sea ice. Therefore, corrections need to be made to remove atmospheric interference.
Since 1972, a series of eight Landsat satellites (NASA/USGS) that span the VIS/NIR/TIR regions of the spectrum have mapped the Earth’s surface.1 Landsats 1–3 carried multispectral scanners (MSS) in four spectral bands over the VIS/NIR, while Landsats 4–7 Thematic Mapper and Enhanced Thematic Mapper Plus (ETM+) expanded the number of bands and spectral range to 10.4–12.5 µm in the TIR. Ground resolution also increased from roughly 80 meters (262 feet) on the earliest Landsats to 15 meters (49 feet) on Landsats 7 ETM+ and 8.2 Cryospheric applications of Landsat data include monitoring changes in glacier and ice sheet area; tracking features to monitor ice flow velocities; mapping changes in sea ice extent and structure, snow cover, melt ponds, and ice albedo; and differentiating among types of ice.
Some newer satellite imaging systems detect ground features as small as 1.5–6 meters (4.9–20 feet) for both SPOT-6 (2012–present) and SPOT-7 (2014–present), 0.82 meters (2.7 feet) for IKONOS (no longer operational), and 0.65 meters (2 feet) for Quickbird (no longer operational). The most recent satellites, such as WorldViews-1–4, detect objects less than one meter (3.3 feet) across. WorldView-4 (2016–present), flying at an altitude of 617 kilometers (383 miles), resamples each ground pixel every 4.5 days or less. Its multispectral sensor covers the visible spectral range (0.45–0.69 μm); its panchromatic camera spans 0.45–0.80 μm into the NIR.3
The NASA-Japan ASTER (Advanced Spaceborne Thermal Emission and Reflectance Radiometer) aboard the Terra (EOS AM-1) and Aqua (EOS PM-1) satellites operates in 14 spectral bands, ranging from 0.52 μm in the visible to 11.65 μm in the TIR.4 Sweeping across a 60-kilometer (37-mile) strip, the instrument’s ground resolution increases from 15–30 meters (49–98 feet) in the VIS/NIR to 90 meters (295 feet) in the TIR. The broader spectral range improves discrimination among fresh snow, various states of ice (fresh, dirty, debris covered, etc.), and water.5 Furthermore, the ability of thermal infrared bands to detect emitted radiation (i.e., heat, rather than reflected light) at night compensates for their coarser ground resolution. Yet, as with visible and NIR sensors, they lack the ability to see beneath clouds.
The NASA MODIS (Moderate Resolution Imaging Spectroradiometer), another key instrument aboard Terra and Aqua, encompasses the visible-to-infrared region from 0.4 µm to 14.4 µm in 36 spectral bands6 (see also ASTER, previous paragraph). Circling 705 kilometers (438 miles) above the Earth, they cover the entire Earth every 1–2 days, over 2,330-kilometer (1,447-mile)-wide swaths. Ground resolution ranges from 250 meters (820 feet) in bands 1–2 (0.620–0.876 µm) to 500 meters (1,640 feet) in bands 4–7 (0.545–2.16 µm), and 1 kilometer (0.6 mile) for bands 8–36 (0.405–14.39 µm). MODIS is used mainly to monitor changes in snow cover, depth, and albedo; snow grain size; sea ice extent; and ice temperatures. MODIS has also captured images of major iceberg calving events and can therefore be applied to iceberg tracking as well.
Laser Altimetry
Laser altimeters, such as on NASA’s Ice, Cloud, and Land Elevation Satellite (ICESat), which circled the Earth from 2003 to 2009 at an altitude of ~600 kilometers (373 miles) in a near-circular, near-polar orbit (94°N inclination), operates in a manner analogous to that of radar altimeters, but substitutes an intense, narrow laser beam (see “Radar Altimetry,” later in this appendix). ICESat could detect elevation changes as small as 1 centimeter per year over a 200-square-kilometer (77 square mile) area. Its successor, ICESat-2, launched in September, 2018, carries the Advanced Topographic Laser System (ATLAS), which emits green laser pulses at 0.53 mm.7 In place of the original ICESat design, ICESat-2 employs a micropulse, multibeam approach that provides dense cross-track coverage perpendicular to the spacecraft’s forward motion. Its main objectives are to measure changes in ice sheet and glacier elevations and their effects on global sea level rise, improve elevation estimates in rugged terrain and on rough surfaces such as ice crevasses, map ice drainage systems and divides, and measure changes in sea ice thickness.
To bridge the gap between ICESat and ICESat-2, laser altimeters on board Operation IceBridge aircraft provided continuity in measurements of changes in polar land and sea ice thickness. Radar instruments, also on board, probe the ice column from surface snow through ice, down to the underlying bedrock8 (see the next section) A gravimeter and magnetometer are used together help locate the bed where radar is unable to image, for instance, beneath water. IceBridge acquires surface elevation data for ice sheet mass balance determinations, and for selected areas of rapid sea ice changes. It also produces related data on ice sheet bed topography, grounding line positions, and ice/snow thicknesses.
MICROWAVE/RADIO WAVE
The Earth’s surface also emits microwave radiation at relatively low energy levels. Unlike infrared radiation, microwave emission depends more on the physical properties of the surface, such as atomic composition or roughness. Because of low energy levels, radiation data must be acquired over a larger area, which reduces the spatial resolution. Instruments sensitive to this radiation are called passive microwave detectors. Examples include NASA’s Nimbus-7 Scanning Multichannel Microwave Radiometer (SMMR; 1978–1987), succeeded by Special Sensor Microwave/Imagers (SSM/I) aboard Defense Meteorological Satellite Program (DMSP) satellites (F8, F10, F11, F13, F14, F15, F16, and 17), beginning in 1987.9 The satellites operate in circular to near-circular sun-synchronous and near-polar orbits 833 kilometers (518 miles) above the Earth over a swath 1,394 kilometers (866 miles) wide, completing an orbital cycle in 102 minutes. Nearly all parts of the globe at latitudes over 58°N or S are covered at least twice daily, except for a narrow latitude band near the poles. Because of their ability to see through clouds day and night, passive microwave sensors such as the SSM/I series have proved especially useful in monitoring sea ice changes over time.
Satellite sensors that beam microwaves toward the Earth’s surface and measure the returned emissions are called active microwave, or radar, detectors. Radar is widely employed in tracking of aircraft, ships, and speeding automobiles. In addition to tracking moving objects, radar can be used to build up images, much like a photograph, but with radar instead of visible light. These high-resolution images can be acquired regardless of weather conditions, any time of day or night.
Radar Altimetry
Radar instruments aboard satellites are used to map surface elevations on land, sea, and ice. Satellite radar and laser altimeters measure glacier and ice sheet topography, ice motion, and sea ice freeboard (height above ocean surface). Radar altimeters emit microwave pulses and record the time elapsed for the pulse to reach the Earth’s surface and return. Since the speed of light is known, this method allows calculation of the exact distance between the spacecraft and surface, after correcting for atmospheric and instrumental effects. The satellite’s position along its orbit is carefully tracked via Global Positioning System (GPS) to determine the height relative to the center of mass of the Earth. In practice, the altitude of the satellite is measured with respect to a fixed reference frame—a reference ellipsoid (a mathematical shape approximating the Earth’s surface, with flattened poles and bulging equator), or a geoid (an idealized shape whose surface coincides with mean sea level in the absence of tides, ocean currents, and winds). The difference between the satellite’s altitude and distance to the fixed reference frame gives the topographic elevation to within an inch. Repeated observations over multiple satellite orbits over a given time period establish a trend in glacier or ice sheet elevation. Radar altimetry works best on low slopes of less than 1 degree, such as for the smoother interiors of the Greenland and Antarctic ice sheets.
Ocean Surface Topography Mission (OSTM)/Jason-2 and -3 (NASA/NOAA/CNES/EUMETSAT), launched in 2008 and 2016, respectively, succeed the earlier U.S.-French TOPEX/Poseidon (1992–2005) and Jason-1 (2001–2013) missions.10 Their main instrument is the Poseidon-3 radar altimeter, but they also use the DORIS instrument and GPS for precise orbit location and tracking information. Like their predecessors, Jason-2 and -3 orbit the Earth at an altitude of 1,336 kilometers (830 miles) inclined to the equator at an angle of 66°, flying over the same spot of ocean every 10 days. Primarily designed for ocean studies, these radar altimeters have detected a sea level trend of 3.2–3.3 millimeters per year from 1993 to 2017,11 up from the twentieth-century average of 1.2–1.9 millimeters per year (chap. 1). The radar altimeter aboard Jason-3 measures variations in sea surface heights as small as 3.3 centimeters (1.3 inches), aiming for 2.5 centimeters (1 inch), to monitor evolving ocean circulation patterns, ENSO (El Niño–Southern Oscillation) events, hurricane intensities, and sea level change.
The European Space Agency’s (ESA) CryoSat-2 (2010–present), successor to ERS-1 (1991–2000), ERS-2 (1995–2011), and Envisat (2002–2012), carries a pair of enhanced radar altimeters and synthetic aperture radar (SAR) instruments/interferometric radar altimeters (SIRAL-2) (see the following section). These instruments are used to detect and measure changes in ice sheet elevation and extent, and thus, indirectly, changes in mass. CryoSat-2’s radar altimeter acquires accurate sea ice thickness data that track seasonal variations. Over sloping land ice surfaces, CryoSat-2 switches to SAR/interferometry mode to record changes in sheet thickness and motion (see more in the following section).
Other ESA satellites, such as Copernicus Sentinel-6, continue the work of their predecessors using radar altimeter instruments that accurately measure land, ocean, and ice sheet topography.
Synthetic Aperture Radar Satellites
Synthetic aperture radar (SAR) functions as a type of imaging radar. In synthetic aperture radar, microwave pulses are beamed toward the Earth’s surface at very short time intervals, and the return time of the echo is measured precisely. Because of the extremely short time interval between pulses (e.g., as short as 50 microseconds for CryoSat; see the following paragraphs), a whole series can be treated as one burst. The cross-track return echoes (in a direction perpendicular to motion) are combined into strips. The satellite’s forward motion produces slight frequency shifts (i.e., via the Doppler effect) in the return signal, allowing strips from successive bursts to be superimposed and averaged to reduce noise. This generates an image of the ground terrain. An advantage of radar is that it penetrates through clouds and can “see” under all weather conditions. The radar echoes also provide useful information on surface characteristics. Radar can establish the degree of roughness, and also has the ability to separate sea ice from water, since ice reflects more radar energy than does the surrounding ocean. Thicker, older sea ice appears brighter (more reflective) than young sea ice, which is still full of myriad air bubbles. Thus, SAR becomes a useful tool in separating multiyear from first-year sea ice.
ESA’s Earth remote sensing satellites, ERS-1 (1991–2000) and ERS-2 (1995–2011), carried a SAR, radar altimeter, and some additional instruments. Instruments on Envisat (2002–2012) included a radar altimeter, DORIS (Doppler Orbitography and Radiopositioning Integrated by Satellite)—a microwave tracking system to locate the satellite’s position precisely—and an enhanced form of SAR, the advanced synthetic aperture radar (ASAR), which enabled continuity with ERS-1 and -2 data. Among its accomplishments, the ASAR tracked changes in sea ice coverage, movement of sea ice, and calving of icebergs.
ESA’s CryoSat-2, launched in 2010, holds a pair of duplicate SAR/interferometric radar altimeters (SIRAL-2), which can measure changes in ice thickness to within 1.3 centimeters (0.5 inch). The radar altimeter on board ESA’s CryoSat-2 satellite, although derived from earlier instruments, has been enhanced to improve measurements of ice-covered surfaces.12 The SAR/SIRAL-2 operates as a conventional altimeter over relatively even terrain on the Antarctic ice sheet when in low-resolution mode.13 At high resolution, it also operates in SAR mode to monitor sea ice and ice shelves. As an interferometric synthetic aperture radar (InSAR), it uses two or more SAR images to map changes in surface elevation or slope, using differences in the phase of waves returned to the satellite or aircraft. This capability enables it to investigate slanted or rough surfaces such as the sea ice/land boundary and improve precision in measuring ice sheet topography and sea ice thickness (height of ice floes above water, to within 1.6 centimeters [0.63 inches] per year).
ESA’s Copernicus Sentinel program consists of a series of Earth-observing satellites (Sentinel-1–6 and Sentinel-SP) that examine vegetation, coastal zones and waterways, the ocean, land and sea temperatures, and atmospheric conditions.14 Sentinel-1 uses an advanced SAR that also operates in interferometric mode. The radar imagery maps sea ice conditions for safe navigation and also differentiates thinner first-year sea ice from thicker, more hazardous, multiyear sea ice. The Sentinel-3 dual-frequency SAR altimeter, based on Jason and CryoSat instruments, will cover the entire Earth’s surface in SAR mode and will accurately measure sea ice and ice sheet topography, among other tasks.
TerraSAR-X (2007–present), a joint German Aerospace Center–private operation, carries a high-resolution SAR that generates radar images of up to 1-meter (3.3 feet) resolution and covers most of the planet. A nearly identical follow-on satellite, TanDEM-X, was launched in 2010.15 Both satellites have been flying in close orbits, separated by only a few hundred meters. Together they form the first configurable synthetic aperture radar/interferometer pair in space. The satellites, imaging the entire Earth’s surface in three years, produced a global topographic digital elevation model data set accurate to within 10 meters. Although TanDEM-X was not primarily designed for cryospheric studies, the data have diverse applications in hydrology, geology, climatology, oceanography, and environmental observations.
The Canadian Space Agency’s RADARSAT-1 (1995–2013) operated in a near-polar, sun-synchronous orbit at 798 kilometers (496 miles) of altitude. Its successor, RADARSAT-2 (December 2007–present), following the same orbit as RADARSAT-1, is equipped with a SAR sensor that images the Earth at a ground resolution of between 3 and 100 meters (10–330 feet).16 RADARSAT data are used for sea ice–edge detection, discrimination between first-year and multiyear sea ice, and ice topography, among other applications. RADARSAT-2, in conjunction with several other satellites, mapped the flow of ice across the Antarctic ice sheet and revealed previously unsuspected information about the mechanics of ice sheet motion (see, e.g., “Moving Antarctic Ice,” chap. 6).
SATELLITE GRAVIMETRY
Not all remote sensors probe different regions of the electromagnetic spectrum. Gravimeters onboard satellites respond to changes in the Earth’s gravitational field caused by subtle changes of mass. The Gravity Recovery and Climate Experiment (GRACE), jointly operated by NASA and the German Aerospace Center, has been orbiting the planet since 2002.17 The two twin GRACE satellites, circling the Earth 15 times a day, respond to tiny gravitational variations along their orbits. A stronger gravitational pull beneath one satellite accelerates it relative to its twin; thus the distance between the pair increases. As the first one slows down once past the anomaly, its twin accelerates upon reaching that spot. By combining the changing distances with precise positions given by GPS, scientists construct detailed gravity maps of the planet. Both altimetry and gravity measurements need to be corrected for glacial isostatic adjustments (GIA) (chap. 4; glossary). GRACE-2 approached the end of its useful lifetime and was decommissioned in October 2017. NASA and GFZ Potsdam launched a follow-on mission, GRACE-FO, that closely resembles the orbit and design of GRACE.
GRACE has uncovered numerous changes in mass distribution around the planet. Variations in gravity due to mass changes arise naturally from differences in rock densities or topography. Another source of large-scale mass redistributions involves significant water transfers between land and sea from both natural and anthropogenic processes. An example of the former is extremely heavy precipitation, as during the very strong 2010–2012 La Niña event in Australia. Examples of the latter include storage of water in large reservoirs and groundwater mining, both of which alter river runoff and, ultimately, sea level. Of greater interest to cryospheric studies, however, GRACE has provided evidence for recent loss of mass from glaciers and ice sheets (chaps. 4–6).