A FROZEN WORLD
The sky gradually lightens to the day’s one hour of twilight, shifting in invisible stages from a star-cluttered black pool to a dome of glowing indigo lying close overhead; and in that pure transparent indigo floats the thinnest new moon imaginable, a mere sliver of a crescent, which nevertheless illuminates very clearly the moonlight glittering on the snow, gleaming on the ice, and all of it tinted the same vivid indigo as the sky; everything still and motionless; the clarity of the light unlike anything you’ve ever seen, like nothing on Earth.
—Kim Stanley Robinson, Antarctica (1998)
Antarctica is indeed a place unlike anywhere else on Earth—the closest thing to an alien planet. It is a barren world of snow, ice, bare rock, sky, incredible shapes, and few colors—a stark land of overwhelming beauty—a rhapsody in sparkling, brilliant white; somber grays; browns; coal black; and the most intense shades of cerulean, turquoise, teal blue, sapphire, cobalt, and ultramarine blue. The continent abounds in sharp contrasts—ice pinnacles sculpted into fantastic shapes by wind and waves floating in a dark, slate-blue, foam-flecked sea; massive aquamarine-tinged, flat-topped ice shelves girding a mountainous interior…and everywhere, a land buried under so much ice that only the highest mountain peaks protrude above vast white plains extending as far as the eye can see—an endless carpet of ice crisscrossed by gaping crevasses and fast-moving ice streams.
A few hardy species claim the icy continent as their permanent or temporary home—penguins and migratory birds, with seals, dolphins, whales, and fish stocking its coastal seas. Green is a rarity in Antarctica. It lacks trees or shrubs; only a few robust plants can survive its frigid temperatures. Certain well-adapted grasses, flowering plants, mosses, liverworts, and lichens find a precarious foothold, particularly on the warmer Antarctic Peninsula, nearby islands, and some coastal regions. But what the continent lacks in biodiversity, it makes up for in numbers.
Antarctica is the terrible fabled Terra Australis Incognita, a land of mists and legend, hinted at by ancient Greeks and imaginative Renaissance geographers, whose existence remained speculative until 1820 when land was first sighted by a Russian expedition led by Fabian Gottlieb von Bellingshausen, and shortly thereafter by British captain Edward Bransfield and several American sealers. A brisk sealing and whaling industry soon arose, lasting into the 1960s when declining stocks of many whale species limited profitability. Belatedly, the International Whaling Commission placed a moratorium on further commercial whaling in 1982, although several nations including Japan, Russia, and Norway remain opposed. Some nations issue so-called “scientific permits” allowing limited whaling to their citizens.
Scientific exploration began in earnest in the late nineteenth century, culminating in the race to the South Pole, which the Norwegian explorer Roald Amundsen reached on December 14, 1911, followed a month later by Robert F. Scott and four others (see chap. 1). Within the decade, several other major scientific expeditions embarked, intent on peeling the veils of ignorance from this hitherto-unknown continent. Ernest Shackleton led the last major expedition of the “Heroic Age of Antarctic Exploration” in 1914–1917. While adverse conditions prevented his expedition from fulfilling its goal, it still stands as a lasting testament to human endurance and survival.
Although Antarctica, unlike all other continents, boasts neither independent nations nor bustling cities nor major seaports nor highways, it stands as a unique scientific laboratory protected by international treaty from environmental degradation and exploitation. The Antarctic Treaty regulates relations among the participating parties, now numbering 53.1 Among other things, the treaty ensures “in the interests of all mankind that Antarctica shall continue forever to be used exclusively for peaceful purposes and shall not become the scene or object of international discord.” The treaty therefore prohibits military activity, nuclear explosions, and the disposal of nuclear waste, instead promoting scientific research, free exchange of data, and protection of the natural environment. It further stipulates that activities should be organized so as to limit any adverse environmental impacts, including those resulting from activities involving mineral resources other than for scientific purposes.2 Around 30 nations maintain permanent or summer research stations on the continent, including the McMurdo and Byrd Stations (United States), Vostok Station (Russia), and Dumont d’Urville Station (France).
Antarctica is a land of extremes. Straddling the South Pole, it is the Earth’s coldest continent, far colder than Greenland and nearly entirely covered by ice. The marked climatic contrast between the two poles lies in their reversed distributions of land and sea. Whereas land surrounds the Arctic Ocean, the ocean encircles Antarctica. The Arctic Ocean moderates the polar climate to some extent, while the higher average Antarctic elevation and extensive snow and ice cover intensify the extreme cold. Furthermore, the vastly expanded sea ice surrounding Antarctica in winter blocks off any ocean warmth.3 From its September maximum of ~16 million square kilometers (6.2 million square miles), sea ice shrinks to a mere 2 million square kilometers (0.77 million square miles) in February. This seasonal fluctuation greatly exceeds that of the Arctic. However, unlike the Arctic, which has been losing sea ice since the 1980s, Antarctic sea ice extent has held steady or increased slightly (see chap. 2).
Antarctica thus holds the record for the lowest temperature on Earth, −89.2°C (−128.6°F) at the Vostok Station in July 1983. Winter temperatures on the Antarctic Plateau typically plummet to −70°C (−94°F), while summer temperatures remain below freezing. Milder temperatures prevail along the coast, ranging between around −16°C (3.2°F) in winter and −2°C (28°F) in summer. The interior is also the driest part—a “white desert,” in spite of its vast reservoirs of frozen water. Precipitation over the polar plateau averages a mere 5 centimeters (2 inches) per year in water equivalence, while coastal areas receive up to 10 times that. The extreme cold and arid climate make Antarctica a veritable Mars on Earth—the closest analog to the surface of the red planet. Antarctica endures the world’s strongest, fiercest winds, reaching 327 kilometers (199 miles) per hour at Dumont d’Urville Station in July 1972.4 Cold, dense air hugging the surface rushes rapidly downslope off the polar plateau toward the continental edge, setting up intense, gale-force winds.
Because nearly the entire continent lies south of the Antarctic Circle, most is plunged into total darkness for several months, with a near-total blackout half the year at the South Pole (which does, however, receive a month of dim twilight). The prolonged darkness only reinforces the frigid conditions. However, conversely, half a year later, the sun never sinks below the horizon.
While Antarctica long remained the last continent to feel the weight of a human footprint and the last to be fully explored, it holds vital keys to our future. Its fate and ours are thus intimately intertwined, as this chapter relates. A key question revolves around the future stability of the West Antarctic Ice Sheet, with its potential to raise global sea level by several meters. A mounting body of evidence builds a case for an eventual breakdown if the Earth continues to warm up, as many climatologists predict.
AN ENDLESS CARPET OF ICE
And now there came both mist and snow,
And it grew wondrous cold:
And ice, mast-high, came floating by,
As green as emerald.
And through the drifts the snowy clifts
Did send a dismal sheen:
Nor shapes of men nor beasts we ken—
The ice was all between.
The ice was here, the ice was there,
The ice was all around:
It cracked and growled, and roared and howled,
Like noises in a swound!
—Samuel Taylor Coleridge, “Rime of the Ancient Mariner” (1798)
Antarctica spans some 14 million square kilometers (5.4 million square miles), including ice shelves—roughly 1.3 times larger than Europe. Almost 90 percent of the continent lies buried beneath the Earth’s largest and thickest ice sheet, averaging around 2,000 meters (6,600 feet) thick. This ice mass would elevate sea level by 58 meters (191 feet) if it all melted (see table 1.1). Its thick ice mantle makes it the world’s highest continent, with an average elevation of about 2,200 meters (7,200 feet). The highest mountain, Mt. Vinson, reaches 4,892 meters (16,050 feet) above sea level, somewhat higher than Mont Blanc in the French Alps (fig. 6.1). However, stripped bare of ice, the average height would drop to a little above 460 meters (~1,500 feet). Antarctica would also shrink in area, as parts of West Antarctica, in particular, would turn into an island archipelago.5
FIGURE 6.1
Mt. Vinson (Vinson Massif), Antarctica, is the highest mountain in Antarctica. (NASA/Michael Studinger)
Although divided into two parts by the Transantarctic Mountains and often treated separately, both the East Antarctic Ice Sheet (EAIS) and West Antarctic Ice Sheet (WAIS) are covered by a continuous mass of ice. Only the highest mountain peaks (known as nunataks), stick out above the ice. East Antarctica is considerably larger and higher in elevation than its western counterpart and endures some of the coldest and driest conditions on Earth. On the other hand, the Antarctic Peninsula, which extends northward into the Southern Ocean, enjoys a comparatively milder climate than elsewhere on the continent.
Ice spreads outward toward the sea from the highest elevations on Dome A near the center of East Antarctica, and Domes C and F, also in East Antarctica. Approaching the coast, ice discharges into ice streams and outlet glaciers. Ice streams, like ribbons of ice, flow many times faster than surrounding ice (fig. 6.2). Crawling at a leisurely pace of a few centimeters to a few meters per year near the summit of the ice sheet, the ice gains speed, from tenths of a kilometer to several kilometers per year, upon entering the swifter streams. Streams form over topographic lows and between areas of slower-moving ice. Because of this differential motion, highly crevassed shear zones develop along the edges of the streams. Ice streams also occur over soft, deformable sediments such as glacial till, weaker ice, or a well-lubricated bed. Many ice streams originate far inland. Like tributaries of temperate-climate rivers, smaller ice streams coalesce into larger ones. On the East Antarctic Ice Sheet, for example, three major ice streams (Lambert, Mellor, and Fisher Glaciers) merge into what has been described as “[one of] the world’s larger glacier[s].”6 They also account for the majority of ice exiting Antarctica. On the West Antarctic Ice Sheet, ice also departs via outlet glaciers such as the Pine Island, Thwaites, and Kohler Glaciers, as well as numerous ice streams that feed into fringing ice shelves such as the Ronne-Filchner, Ross, and Getz Ice Shelves. Narrow valleys or topographic highs constrain outlet glaciers before they enter the sea. Most, however, end in floating extensions—as ice tongues or larger ice shelves.

FIGURE 6.2
Aprons of Ice
Ice shelves represent floating marine extensions of the ice sheet (see fig. 2.2). They encircle roughly three-quarters of the shoreline of Antarctica, covering an area of 1.56 million square kilometers (0.6 million square miles).7 The two largest include the Ross Ice Shelf, at almost 473,000 square kilometers (182,630 square miles), and the Ronne-Filchner Ice Shelf, at 422,000 square kilometers (162,930 square miles).8 Others include Larsen C, Lambert-Amery, Riiser-Larsen, and Shackleton. While these still hold fast, some ice shelves have not fared as well.
At least 10 ice shelves on the Antarctic Peninsula have disintegrated or shrunk in a steady southward progression since the 1950s (see table 2.1). What about the even more extensive ice shelves on the mainland, beyond which lie massive glaciers? Many of these have also begun to thin, including a handful in colder, more stable East Antarctica. Because ice shelves help to stabilize the Antarctic ice sheet and thereby control its mass balance, early warning signs of potential instability raise serious concerns, as discussed in a later section. Large icebergs often split off tongues of tidewater glaciers or ice shelves. In Antarctica, the land of extremes, these icebergs can be enormous. Iceberg B-15, the world’s current record holder at 10,800 square kilometers (4,170 square miles)—dwarfing the island of Jamaica—calved off the Ross Ice Shelf in March of 2000. It subsequently broke up into several smaller pieces, the largest of which was named B-15A. Another megaiceberg, A-38, cracked off the Ronne-Filchner Ice Shelf in October 1998. It measured 7,500 square kilometers (2,900 square miles)—larger than the state of Delaware.
Despite such headline-grabbing events, calving is a normal process, the result of stresses on the exposed ice shelf by currents, tides, waves, collisions with other icebergs or moving pack ice in winter, or hydrofracturing. Summer meltwater pools spread over the surface of ice shelves and press down on water entering crevasses, until the cracks are wedged apart and propagate, bit by bit, all the way to the base. Icebergs then finally split off with a loud, resounding splash.
In late September of 2017, another large iceberg of about 185 square kilometers (72 square miles) broke off Pine Island Glacier.9 The newest iceberg was larger than another berg that had calved earlier that year, though smaller than one in 2015 and the giant Iceberg B-31 (nearly 700 square kilometers; 250 square miles) that calved in November of 2013. At the time, NASA glaciologist Kelly Brunt noted: “The detachment rift, or crack, that created this iceberg was well upstream of the 30-year average calving front of Pine Island Glacier, so this is a region that warrants monitoring”10 (italics added). Starting in January 2013, an array of instruments had been eying its progress, including IceBridge aircraft and the Moderate Resolution Imaging Spectroradiometer (MODIS) on board the NASA Terra and Aqua satellites. B-31’s calving attracted widespread attention because Pine Island Glacier—the source of the massive iceberg—is often labeled “the weak underbelly of the West Antarctic Ice Sheet.” Rifting also preceded the 2015 calving event. But this rifting was unusual in that cracks had developed at the center of the ice shelf near the grounding line and propagated toward the margins, causing calving farther up-glacier than previously observed. This new rifting style may be associated with warming Antarctic shelf bottom water.11 Continued formation of such crevasses farther landward could eventually undermine the shelf and lead to its demise.
Once set adrift in the polar seas, some Antarctic bergs run aground in embayments or drift with local currents, while others get swept up in the in the Antarctic Circumpolar Current and drift northward where they disintegrate and ultimately melt. A similar fate awaits B-31. In April 2014, the giant berg was spotted slowly drifting out to sea. Nevertheless, Pine Island Glacier and its neighbors in the Amundsen Sea sector of the West Antarctic Ice Sheet continue to be carefully watched for signs of instability (see “The West Antarctica (WAIS)—on Shaky Ground,” later in this chapter).
Hidden Mountains and Volcanoes
Beneath the seemingly endless continental carpet of ice, girded by floating ice shelves and drifting icebergs, lies a hidden world—the vanished world that once existed before the deep freeze. Hints of its existence emerge in the nunataks—the mountaintops or ridges that project above the ice. But only in recent years have we been able to peer under this frozen mantle to study a previously unknown landscape of mountains, valleys, islands, lakes, deep embayments, and volcanoes.
First detected in the 1950s, the true nature of the Gamburtsev Mountains became much clearer in 2011 as ice-penetrating radar, gravimeters, and magnetometers revealed hitherto-concealed features. The Gamburtsevs rival the Alps in size but are totally buried beneath the Antarctic ice. Their story began a billion years ago when a mountain range formed as a result of continental collisions. Over time the original mountains wore down and only the roots were preserved. Between 250 and 100 million years ago, when dinosaurs roamed the Earth, rifting broke apart the supercontinent of Gondwanaland. One of the pieces that became Antarctica drifted toward the South Pole. These tectonic forces “rejuvenated” Antarctica, such that part of the land pushed upward and new mountains formed. By 34 million years ago, ice had begun to build up on the East Antarctic Ice Sheet. The Gamburtsevs may be close to the location where the ice sheet first began to grow. The ice sheet, when fully formed, protected the mountains from further erosion, preserving their youthful appearance.12 The ice is now so thick that in places it quietly flows uphill over the buried mountain peaks.
Bedmap2 yields much new information on the hidden physiography of Antarctica. This project compiled all available information on ice-surface elevation, ice thickness, and subglacial topography.13 Airborne ice-penetrating radar, satellite laser and radar altimetry, satellite imagery, gravity measurements, and even people on dog-drawn sleds supplied the raw data.
Most of the Bedmap2 data come from radio echo sounding (RES). This technique exploits a portion of the electromagnetic spectrum in which emitted radio waves travel freely through both ice and air. When radio waves encounter boundaries between materials with different physical properties, the speed of wave propagation changes, setting up reflections. Radar antennas on aircraft or on the ground detect reflections from the base of or within the ice sheet. Since the velocity of the radar pulse is known, the thickness of the ice can be calculated by measuring the time elapsed between “echoes” emanating from air/ice and ice/bedrock surfaces. A cross section of the ice sheet and underlying bedrock can be built up from a successive series of such echoes recorded as the aircraft flies over the ice sheet.
This massive effort resulted in the most detailed map yet of the southernmost continent’s bedrock (fig. 6.3). “It’s like you’ve brought the whole thing now into sharp focus…. In many areas, you can now see the troughs, valleys and mountains as if you were looking at a part of the Earth we’re much more used to seeing, exposed to the air,” said Dr. Hamish Pritchard from the British Antarctic Survey, a coauthor of the Bedmap2 report published in 2013. Among other features, Bedmap2 discovered a trough in the northwestern part of East Antarctica that is one of the largest on the continent, penetrating 650 kilometers (400 miles) into the interior of the ice sheet (fig. 6.3). Another major rift, the Lambert Rift, extends seaward to the east of the Gamburtsev Mountains. On the new map, the Transantarctic Mountains continue into the Ellsworth Mountains of West Antarctica. The map also illustrates sharp topographic differences between East and West Antarctica. East Antarctica features much more rugged terrain than does West Antarctica. Much of the latter would be reduced to a series of islands without its ice cover. The new map furnishes scientists with an important tool with which to study how ice flows across Antarctica and how it might react to future climate change.

FIGURE 6.3
Antarctica is also home to a number of volcanoes, some buried under ice, others exposed, and a few still active. Mount Erebus, the southernmost active volcano in the world, is the second highest in Antarctica after Mt. Sidley, and stands at 3,794 meters (12,448 feet) elevation.14 It shares Ross Island with three inactive volcanoes—Mount Terror, Mount Bird, and Mount Terra Nova. The volcano erupted most recently in 2005 and 2014. Recently, 138 volcanoes have been mapped beneath the West Antarctic Ice Sheet, identified as such from Bedmap2 data on the basis of their shapes. Of these, 91 were previously unknown.15
Seismicity on the WAIS further suggests magma sloshing around under the ice.16 Earthquake swarms, detected in 2010 and 2011, displayed behavior more typical of seismic activity related to volcanism and movement of magma than to quakes associated with tectonic activity or ice movement. The quakes originated in an area of subglacial mountains with magnetic anomalies characteristic of volcanic origin. Furthermore, a prominent seismic reflecting layer interpreted as volcanic ash was draped over a volcano-like subsurface feature. The ash layer was estimated to have been deposited as recently as 8,000 years ago. While geologists doubt that any local subsurface volcano will break through to the surface any time soon, geothermal heat generated by magmatic activity could melt the base of the ice sheet. The decreased pressure on subterranean magma due to a thinning ice sheet could spur volcanism that would further destabilize the WAIS.
Other geothermal sources were discovered beneath Thwaites Glacier, also on the WAIS. Airborne radar surveys detected higher-than-expected subsurface radar-reflecting signals typical of large quantities of basal water. Combined with a model of how water flows through a subglacial network of canals, these radar reflections denote an area of higher-than-average geothermal heat flow from the Earth’s interior.17 The location lies near a buried rift structure and associated volcanism. Thwaites Glacier may thus be sitting on a “stovetop.” Don Blankenship, one of the scientists on the project, exclaimed: “And then you plop the most critical dynamically unstable ice sheet [WAIS] on planet Earth in the middle of this thing.” Thwaites Glacier (like its neighbor, Pine Island Glacier) has been retreating within the last two decades, mainly due to incursion of warmer ocean water beneath its ice shelf. The weakened ice shelf has relaxed its tight grip on the glacier, allowing it to move forward and speed up. Thwaites Glacier may therefore be exposed to a double whammy—underground as well as at its marine edge. This glacier definitely bears more watching (see “The West Antarctica (WAIS)—on Shaky Ground”).
The Dry Valleys—Mars on Earth
Mars looks more and more like Antarctica every day…. Both Mars and Antarctica are cold deserts. They experience intense [UV] radiation, and liquid water is only briefly and ephemerally stable in special locations and at the warmest part of the year.
—Joe Levy, geologist
Across McMurdo Sound, opposite Ross Island at the eastern edge of the Ross Ice Shelf, lies a series of ice-free valleys—otherwise a rarity in Antarctica. Narrow gaps in the topography have slowed down the flow of ice from the East Antarctic Ice Sheet. Much less snow accumulates in the Dry Valleys than on nearby Ross Island. Furthermore, strong westerly winds in winter scour the valleys, removing surface snow. The fierce winds also polish large rocks and cobbles, often carving them into bizarre shapes called ventifacts. As in the Arctic, permafrost develops in the subzero temperatures (see, e.g., chap. 3). Polygonal ice wedges and patterned ground are widespread. Small glaciers nestle in cirques along the ridge crests of surrounding mountains, a few spilling over onto the valley floors. Loose sand, gravel, and occasional sand dunes cover the ground. Several lakes fill valley low spots, covered by ice most of the year.
The Dry Valleys rouse great scientific interest as a terrestrial analog for extraterrestrial life. The search for life on Mars motivates much of NASA’s exploration of the Red Planet. Earth and Mars share many features. Although Mars today is extremely cold and dry, its surface bears many traces of past water: branched river valleys, deltas, lakebeds, and hydrous minerals. Even today, both poles are covered by H2O ice caps, and more ice lies buried under the soil. The coldest temperatures in the Dry Valleys approach those of Mars. Thus, the study of life in the Dry Valleys guides scientists in their search for possible martian life. A few hardy microbes manage to survive in the icy water and in the barren soils despite the inhospitable environment. Mostly single-celled organisms, these include cyanobacteria, diatoms (a type of silica-shelled marine or freshwater algae), mosses, lichens, and many species of bacteria. Cyanobacteria (formerly called blue-green algae) are among the oldest forms of life, going back some 3.5 billion years.18 Their photosynthetic activity may have led to the buildup of Earth’s oxygen atmosphere starting around 2.5 billion years ago. Diatoms live in a wide range of environments, including the oceans, lakes, brackish lagoons, sea ice, and soils, and even on wet rocks. Their abundance, widespread distribution, and sensitivity to the environment make them useful markers of changes in temperature and water chemistry, including salinity.
Blood Falls, a plume of saltwater, flows over the Taylor Glacier, in the McMurdo Dry Valleys, onto an ice-covered lake.19 Iron oxide, mingled with salts, give Blood Falls its rusty red color. Microbes that metabolize both sulfate and ferric iron live in the water. Such an unusual ecosystem also offers a relevant Mars analog, since both types of minerals coexist in rocks on the Red Planet.20 Not only do the frigid, hyperarid climate and absence of higher life forms in the Dry Valleys represent the closest martian analog on Earth, but Antarctica also yields a veritable treasure trove of other bits of extraterrestrial planetary bodies.
A Meteorite Bonanza
Meteorite hunting is not for wimps. The best places to look are also the coldest and windiest. You need very old ice, and you need wind, lots of it, strong and unrelenting. Antarctica fits the bill.
—Mary Roach
Meteorites constitute virtually our only samples of extraterrestrial materials. Nearly all meteorites found on Earth are pieces of asteroids; a handful may originate on the moon or Mars. Because most date back to when the solar system formed, they offer important insights about the birth of the planets and their moons. Antarctica turns out to be one of the best places on Earth to hunt for these interplanetary objects.21 The cold climate and aridity preserve freshly fallen meteorites from weathering, or from rusting in the case of iron meteorites. Quickly buried under snow and ice, meteorites travel downslope with the ice sheet toward the ocean. But the Transantarctic Mountains obstruct this flow and trap numerous pieces along their flanks. Powerful winds that rush down from the South Pole strip the ice bare by sublimation and abrasion. Researchers on snowmobiles or on foot quickly spot these dark rocks sitting on the blue ice like ripe plums ready for the picking (fig. 6.4). Over the years, more than 50,000 specimens have been recovered from Antarctica, far more than from the deserts of northern Africa, Asia, and Australia combined. This vastly expanded collection has proven a bonanza for cosmochemists, planetary geologists, and astronomers studying the origins of our solar system. But, returning to Earth, the thick ice sheet holds many other surprises, as the next section will show.
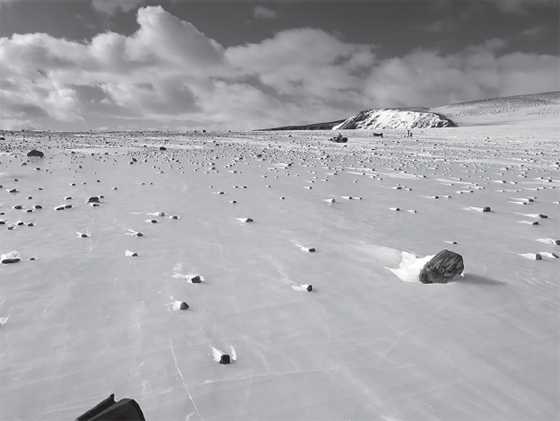
FIGURE 6.4
An abundance of meteorites lie on the Antarctic ice, waiting to be collected by scientists. (NASA)
Note: Not all these rocks are meteorites; however, the experts can tell the difference.
Mountains and volcanoes are not the only terrain features the ice conceals. Antarctica harbors hundreds of subglacial lakes. Of these, Lake Vostok, at 15,700 square kilometers (6,060 square miles), is the largest and best-known. Situated near the center of the East Antarctic Ice Sheet, close to the Russian Vostok Research Station, the lake may have been sealed by ice around 15 million years ago. However, motion of the ice sheet may be renewing the water every 13,300 years.22
The possibility that the lake harbors a unique ecosystem has spurred interest in drilling 3.7 kilometers (2 miles) beneath the thick ice seal to find out. Despite concerns about contamination by drilling fluids or surface microbes, the Russians pierced the ice in 2012 and again in January 2015. A Russian-led team reported in 2013 that they had identified 3,500 gene sequences in ice accreted to the underside of the ice sheet, just over the lake.23 The vast majority derived from bacteria and the remainder from eukaryotes (organisms with cell nuclei). Most of these species resembled primitive organisms living in lake sediments, brackish water, seas, soils, and even deep-sea thermal vents. Presumably, most of these life forms inhabit the lake as well.
Almost 400 subglacial lakes have been discovered in Antarctica, thanks to radar (fig. 6.5).24 The subsurface topography of the ice sheet can be reconstructed by combining ground-penetrating radar data with surface elevation measurements from satellite altimeters. Slight variations in density or crystal orientation, or presence of impurities such as volcanic ash, produce distinctive radar reflections that outline the ice layers. If no escape route for water exists, ice entering a lake will float over water. This produces a flat, featureless surface like that of an ice shelf. Thus, many (though not all) flat radar reflections within the ice correspond to buried lakes. Since ice meets no resistance when flowing over water, it accelerates and thins on the upstream side of the lake. The reverse occurs when ice encounters bedrock again farther downstream. Subtle changes in surface elevation may therefore reveal movement of water between lakes or within an interconnected hydrological system.

FIGURE 6.5
Distribution of lakes buried beneath the Antarctic ice sheet. (Frank Pattyn, Sasha P. Carter, and Malte Thoma, “Advances in Modelling Subglacial Lakes and Their Interaction with the Antarctic Ice Sheet,” Philosophical Transactions of the Royal Society A 374 [2015], doi:10.1098/rsta.2014.0296)
Seismic profiling and gravity measurements have also helped detect and map subglacial lakes. Seismic surveying somewhat resembles that of radar sounding, but substitutes sound waves for radio signals. Seismic mapping takes time and effort, acquiring only a single data point for each “shot.” (A small explosive charge is detonated in order to trigger the seismic waves.) A number of large lakes, including Lake Vostok, have been studied in this manner. Gravity measurements have been used to a lesser extent. If the geometry of the overlying ice sheet is known and taken into account, the depth of the lake can be inferred from the remaining gravity signal. This approach identified two separate basins in Lake Vostok, one larger and deeper than the other, separated by a 40-kilometer (25-mile)-wide rocky ridge.
No mere geographical curiosities, the buried lakes of Antarctica have become objects of intense study. They hold important information on unique ecosystems adapted to darkness, extreme cold, and high pressures. Furthermore, they reveal elements of a complex subglacial hydrological system that may affect how fast the ice sheet moves—as explained in the next section.
MOVING ANTARCTIC ICE
Abundant liquid water newly discovered underneath the world’s great ice sheets could intensify the destabilizing effects of global warming on the sheets. Then, even without melting, the sheets may slide into the sea and raise sea level catastrophically.
—Robin E. Bell, “The Unquiet Ice”
The immense ice blanket over Antarctica slowly wends its way seaward along faster-moving corridors of ice, or ice streams, that convey some 90 percent of the ice to the ocean. Like branches on a tree, smaller ice streams join larger ones that eventually reach the sea. Inland ice streams generally flow over buried valleys and occasionally glide over subglacial mountains. During the International Polar Year, 2007–2009, an array of satellites equipped with interferometric synthetic aperture radar (InSAR) instruments surveyed the entire Antarctic continent and collected emitted microwave radiation reflected back off the Earth’s surface. Eric Rignot of the University of California, Irvine, and his colleagues used changes in the resulting pattern of reflections to map the motion of ice streams across Antarctica. They determined that ice crawled a few centimeters a year at ice divides but sped up to several kilometers per year on fast-moving glaciers and ice shelves.25 They also recognized the importance of bottom slipperiness in moving Antarctic ice. In the fast-flowing regions, ice flows over soft, squishy sediments or over water. Ice streams also gather speed as they approach major ice shelves, such as the Ross, Ronne-Filchner, and Avery Ice Shelves.
The speed of outlet glaciers and ice streams ultimately governs ice losses from Antarctica. Several factors, in turn, influence ice stream velocity. While smoothness or roughness of the substrate are important factors, water plays a major role in “greasing the skids.”26 Unlike in Greenland, where surface melt drains to the base via an internal plumbing system (see fig. 4.5), water beneath the Antarctic ice sheet is primarily generated by pressure melting, friction, and geothermal heat (see “Hidden Mountains and Volcanoes,” earlier in this chapter). Surface temperatures over much of East Antarctica average −50°C (−58°F); temperatures under 3–4 kilometers (2–2.5 miles) of ice are near −2°C (28°F)—close to the melting point of ice at that pressure. Friction generated by ice moving over its bed also increases melting; so does motion over a geothermal hot spot.
The discovery of hundreds of lakes beneath Antarctic ice has revolutionized thinking about the ice sheet’s internal plumbing.27 Ice-penetrating radar reveals that many lakes can form interconnected entities in which water actively flows from one lake to another. Many such “active” lakes cluster around fast-flowing ice streams (compare fig. 6.5 in the previous section with fig. 6.2). However, these features may change quickly as lakes fill up or discharge water. For example, the ERS-2 satellite altimeter detected an abrupt drop in elevation over a known subglacial lake near Dome C in East Antarctica. Soon thereafter, elevations rose farther downslope. These successive changes hint at a network of interconnected subglacial tunnels through which water flows from one location to another.28 How do the subglacial lakes affect the motion of overlying ice? Basal friction vanishes as ice flows over water. Furthermore, lake water that refreezes at the base of the ice releases heat, which warms up the ice. The partially thawed, softened ice then accelerates until it hits bedrock again before refreezing. Buried lakes and places of high geothermal heat flow are therefore “potentially future nucleation sites for the initiation of fast-flowing ice streams.”29
Not all ice on the East Antarctic Ice Sheet originally fell as snow. Radar probes demonstrate that nearly a quarter of the ice at the base of the East Antarctic Ice Sheet consists of accreted ice, refrozen from meltwater.30 As in Greenland (chap. 5), the freeze-on process can severely distort and up-warp overlying ice layers, which effectively destroys the bottommost ice stratigraphy. This complicates efforts to core the oldest ice layers in order to reconstruct ancient climates (chap. 7). Refreezing of meltwater releases heat to the enclosing ice, which weakens it, allowing it to deform and accelerate. The extensive distribution of accreted ice implies the existence of a long-lived internally draining hydrological system. Simple calculation of lengths and ice velocities suggests that freeze-on may have persisted for tens of thousands of years, spanning much of the last ice age to recent times. Thicker and more widespread than previously suspected, this different form of glacial ice may render the Antarctic ice sheet more vulnerable to change than most models assume.
The giant frozen gorilla may be stirring fitfully deep inland, but most of the action is taking place along the margins of the ice sheet, as the following sections will demonstrate. Mounting evidence points to a growing imbalance within the past two decades between gains of ice from snowfall and losses from ice outflow past the grounding line and calving. Dynamic thinning may be a sign of trouble ahead. It implies that ice moves faster and sheds more mass at its terminus than it did previously. The most dynamic portions of the ice sheet are West Antarctic outlet glaciers and their floating extensions. As is increasingly the case in Greenland, warmer ocean water encroaching under ice shelves has been implicated as a major culprit.
THE GIANT GORILLA AWAKENS
What’s Up with Antarctic Ice?
It is the first time we can say that if you are looking at the entire ice sheet, it is losing mass…. We can now see Antarctica melting. We have a number for the ice sheet. It’s a big step toward understanding how the sea level is going to change.
—Isabella Velicogna
Is Antarctica’s endless winter beginning to relax its gelid grip? Has the growing warmth that has pushed back the cryosphere elsewhere on Earth reached the southernmost continent yet? The Antarctic ice locker that long preserved a record of ancient climates may be starting to defrost. As this section suggests, the icy giant may be slowly awakening from its long slumber.
Most experts believe that Antarctica is currently unloading more ice than it gains. Furthermore, losses appear to have increased since the 1990s, when satellite observations of Antarctica’s ice began. Several other subsequent reports echo similar findings (table 6.1). While the East Antarctic Ice Sheet in general has remained stable, or expanded, Antarctica’s ice sheet is in decline.
TABLE 6.1 Recent Ice Losses on Antarctica and Contributions to Sea Level Rise (mm/yr)
| ANTARCTIC ICE SHEET |
ANTARCTIC PENINSULA |
WEST ANTARCTIC ICE SHEET |
EAST ANTARCTIC ICE SHEET |
REFERENCE |
| 0.20±0.15 (1992–2011) |
0.06±0.04 |
0.18±0.07 |
−0.04±0.12 |
Shepherd et al. (2012) |
| 0.22±0.10 (2005–2010) |
0.10±0.03 |
0.28±0.05 |
−0.16±0.09 |
Shepherd et al. (2012) |
| 0.27 (0.37 to 0.16) (1993–2010) |
— |
— |
— |
Intergovernmental Panel on Climate Change (2013a) |
| 0.41 (0.61 to 0.20) (2005–2010) |
— |
— |
— |
Intergovernmental Panel on Climate Change (2013a) |
| 0.31±0.06 (2003–2012) |
0.07±0.01 |
0.32±0.02 |
−0.07±0.04 |
Sasgen et al. (2013) |
| 0.44±0.13 (2010–2013) |
0.06±0.05 |
0.37±0.07 |
0.01±0.10 |
McMillan et al. (2014) |
| 0.18±0.12 (2003–2013) |
0.09±0.01 |
0.32±0.02 |
— |
Velicogna et al. (2014) |
| 0.25±0.03 (2003–2014) |
0.07±0.01 |
0.33±0.02 |
−0.15 |
Harig and Simons (2015) |
| −0.31±0.17 (1992–2001) |
0.02±0.03 |
0.04±0.06 |
−0.38±0.14 |
Zwally et al. (2015) |
| −0.23±0.07 (2003–2008) |
0.08±0.01 |
0.07±0.04 |
−0.38±0.08 |
Zwally et al. (2015) |
| 0.25±0.14 (2002–2015) |
— |
— |
— |
Forsberg et al. (2017) |
Note: One GT ice (1 billion metric tons) per year = 362.5 millimeters per year sea level rise equivalent.
In 2015, H. Jay Zwally, a NASA glaciologist, and his colleagues declared that, to the contrary, Antarctica piled on more ice than it shed—yielding a surplus of 82 billion metric tons per year from 2003 to 2008.31 Other recent studies have measured deficits of between 92 and 160 billion tons per year since 2003 (see table 6.1). Zwally does concede ice losses on some coastal sections of West Antarctica—notably the Amundsen sector, including the Pine Island and Thwaites Glaciers —and less so on the Antarctic Peninsula. Yet the East Antarctic surplus far outweighs these losses. Lest climate change skeptics rejoice, Zwally does not expect this snow and ice buildup to last for long. “If the losses of the Antarctic Peninsula and parts of West Antarctica continue to increase at the same rate they’ve been increasing for the last two decades, the losses will catch up with the long-term gain in East Antarctica in 20 or 30 years—I don’t think there will be enough snowfall increase to offset these losses.”32
Other scientists express doubts. Theodore Scambos, a researcher at the National Snow and Ice Data Center, says: “I think the [Zwally] study is just plain wrong, far too inconsistent with other lines of evidence, and not worth the public’s attention.” Ian Joughin of the University of Washington observed that the Zwally team’s findings differed from previous studies that used the same data sources.
Conflicting findings may stem from using different methods or time intervals (see table 6.1). For instance, the Zwally team’s data cover only up to 2008, although ice losses, especially in West Antarctica, have stepped up considerably since then. Because of Antarctica’s vast size, remote location, and extremely harsh climate, satellite remote sensing provides most of our information. Radar or laser altimetry and GRACE gravimetry are the two most commonly used satellite techniques.33 Altimeters measure changes in surface elevation. These data, plus knowledge of area and snow or firn density near the ice sheet surface, yield volume estimates. Since scientists do not always know snow/firn densities precisely, they must make certain simplifying assumptions that introduce uncertainties in calculating mass changes. The GRACE gravimeter measures ice sheet mass fluctuations directly. But these must be corrected for redistribution of mass due to glacial isostatic rebound of land after the last deglaciation. However, different glacial isostatic adjustment (GIA) models often yield divergent outcomes. A third method, the mass budget method (also known as the input-output method), relies on climate data to calculate the difference between accumulation (i.e., snowfall) and ablation (see chap. 4). Because the extreme Antarctic cold limits surface melting, ablation consists mainly of ice discharge at the grounding line and iceberg calving. Regional climate models and in situ observations provide accumulation rates, while ablation rates are calculated from ice motion and grounding line thickness. Interferometric synthetic aperture radar (InSAR) provides ice velocity data, while airborne radar estimates ice thicknesses. Some studies combine data from multiple sources. The scientific discord therefore hinges on reconciling such technical differences.
Setting aside the scientific debate, all parties agree that the Antarctic Peninsula and West Antarctic Ice Sheet have been losing mass since the early 1990s, enough to raise sea level by up to 0.44 millimeter (0.02 inch) per year—which corresponds to roughly 15 percent of the current global trend (see table 6.1).
The West Antarctic Ice Sheet (WAIS)—on Shaky Ground
Is the West Antarctic Ice Sheet rapidly approaching a point of no return? Could loss of ice along its margins set off an irreversible collapse, eventually pushing up sea level by several meters? A map of Antarctica stripped bare of its present ice cover, which in places is more than 2,000 meters (6,600 feet) thick, shows that much of the WAIS is “grounded” (i.e., rests on bedrock) below sea level (see fig. 6.3). Portions of the ice sheet margin overlie subglacial lakes and channels. With the WAIS stripped of its ice cover, seawater would engulf large areas of it and surround an archipelago of islands.
At present, many West Antarctic ice streams and glaciers (and a few in East Antarctica) near the grounding line rest on slopes that tilt landward (i.e., have reverse, or retrograde, slopes). The marine ice sheet instability (MISI) hypothesis proposes that an ice sheet or glacier grounded on a reverse slope is inherently unstable34 (fig. 6.6). Ice thickness at the grounding line is a key factor controlling the forward motion of the glacier. As its bed deepens inland from the grounding line, the glacier thickens. Once a retreating grounding line reaches the thicker section, ice begins to accelerate. Moreover, ice melts at a lower temperature under the greater pressure of a thicker glacier. Increased basal melting at the grounding line reinforces the effects of warm ocean-water incursion. In a cascading positive feedback loop, the accelerating glacier discharges more ice across the grounding line, which retreats farther downslope. The process continues until the bed slope levels out or steepens landward. As discussed in the following paragraphs, this particular topographic configuration is particularly sensitive to rising oceanic temperatures. Although several scientists proclaim that such an instability already exists, most experts doubt that a catastrophic collapse of the WAIS would occur within this century. Rather, they foresee a much slower yet inevitable breakdown playing out over several centuries or longer as temperatures continue to climb.
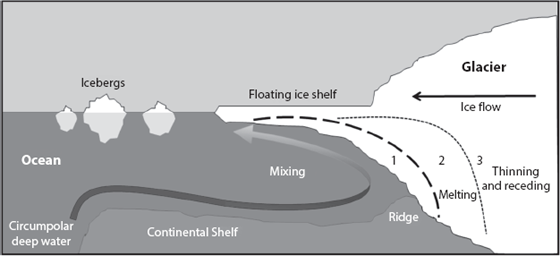
FIGURE 6.6
Marine ice sheet instability in Antarctica: (1) The ice sheet or glacier is grounded on a bedrock ridge; (2) warm Circumpolar Deep Water circulates beneath the ice shelf, melts it from below, and erodes the grounding line; (3) the grounding line retreats beyond the ridge downslope, the ice shelf continues to thin, and the glacier accelerates forward. (Modified from Bethan Davies, “Is the West Arctic Ice Sheet Collapsing?,” AntarcticGlaciers.org, May 13, 2014, http://www.antarcticglaciers.org/2014/05/west-antarctic-ice-sheet-collapsing/)
The West Antarctic Ice Sheet could, however, be issuing ominous warning signals of incipient instability. Glaciers entering the Amundsen Sea sector, such as Pine Island, Thwaites, Smith, Kohler, Pope, and Haynes, drain a third of the WAIS and are among the fastest-flowing ones in Antarctica. These glaciers discharged 77 percent more ice in 2013 than in 1974, with a third of the increase occurring between 2003 and 2009.35 Another study concludes that Amundsen Sea–draining glaciers contributed an average of 0.23 millimeter (0.06 inch) per year to sea level rise from 1992 to 2013, with an increasing trend from 2003 to 2011.36
Is a “disaster…unfolding—in slow motion,” as a popular science magazine boldly declares, with the headline “West Antarctic Ice Sheet Is Collapsing”?37 Perhaps not yet, but some day…
Eric Rignot and fellow glaciologists mapped the continuous and rapid retreat of the grounding lines of the Pine Island, Thwaites, Smith, and Kohler Glaciers between 1992 and 2011, with InSAR radar data from the European Remote Sensing satellites (ERS-1 and 2). Most spectacularly, the grounding lines of the Smith and Kohler Glaciers separating floating from land-based ice had shifted landward by 34–37 kilometers (21–23 miles).38 Pine Island and Thwaites Glaciers have also been thinning and retreating in recent years. These two glaciers and their neighbors hold the equivalent of 1.2 meters (4 feet) of sea level rise. All four glaciers rest on reverse beds with no immediate subglacial obstacles to rein in their landward migration. Rignot and colleagues concluded that “this sector of West Antarctica is undergoing a marine ice sheet instability that will significantly contribute to sea level rise in decades to centuries to come.” Other glaciologists voice similar concerns. For example, Ian Joughin of the University of Washington, Seattle, and his team note that the grounding line for Thwaites Glacier is now held in check by a 600-meter (1,970 foot)-deep sill, with only some tens of kilometers separating it from a deep interior basin.39 Although occurring slowly at present, “an early-stage collapse” may have already started, and would accelerate once the grounding line reaches the deeper sections. This could occur in as little as a few centuries if the shelf base continues to melt at a high rate. Furthermore, as noted above, the Thwaites Glacier overlies a geothermal hot spot, which could also melt ice deep under the ice sheet. Meanwhile, the grounding line of the Pine Island Glacier has already retreated some tens of kilometers and now enters a region with a reverse slope, opening the door to its possible irreversible retreat far inland.40
Among Antarctic glaciers surveyed between 2010 and 2016, 22 percent of the grounding lines on the West Antarctic Ice Sheet retreated faster than 25 meters (82 feet) per year (59 percent in the Amundsen Sea sector alone). This compares with a 9.5 percent retreat rate on the Antarctic Peninsula, and only 3 percent on the East Antarctic Ice Sheet.41
Grounding lines have also retreated along the WAIS’s Bellingshausen Sea coast over the last four decades, except for ice streams feeding one ice shelf.42 Will such widespread pullbacks inevitably trigger a complete WAIS meltdown, provoking a 3.3-meter (10-foot) jump in sea level?
Some advanced ice sheet and ice-ocean computer models support just such a dire outcome. If present rates of melting beneath West Antarctic ice shelves continue for as little as 60 years, Johannes Feldmann and Andres Levermann of Potsdam University warn, not only would the Amundsen Sea sector eventually destabilize, but so would the entire marine-based West Antarctic Ice Sheet.43 Deep inland basins connect Thwaites Glacier, in particular, to marine-based ice beneath the West Antarctic Ice Sheet.44 Once the grounding line on Thwaites Glacier retreats beyond an “island” of relative stability (a 600-meter [1,970 feet] sill that holds it back), the door opens to a deeper, wider calving front that would precipitate rapid surging and thinning of the glacier. Because Thwaites connects to deep interior subglacial basins, this could conceivably “empty the weak underbelly of the West Antarctic Ice Sheet.”45 The grounding lines of nearby Pine Island Glacier and its neighbors are also receding. If these trends persist for centuries and glaciers keep thinning, the perturbations, in a gelid analogue of stream piracy,46 would eventually spill over, propagate into adjacent catchments that feed into the presently stable Ronne-Filchner and Ross Ice Shelves, and march toward their grounding lines. After centuries or millennia, most of the WAIS would ultimately disappear.47 Thirteen thousand years from now, the surviving remnants of the ice sheet would attain a new equilibrium state, having raised sea level by some 3 meters (10 feet).
Access of warm Circumpolar Deep Water (CDW) to the glacier grounding line will also affect how quickly the WAIS can destabilize. Recent improved mapping of the adjacent seafloor reveals more clearly defined topographic features that control entry of the warmest, deepest CDW layers to the ice shelves. While several troughs are shallower, narrower, or more topographically variable than previously suspected, others are instead deeper. The new data will greatly benefit modeling of ocean and ice sheet interactions.48
Ice Shelves in Trouble
It’s melting from above and below and crumbling at the edges. Antarctica is in trouble. Its frozen edges, or ice shelves, are disappearing into the ocean faster than we thought…and the process is accelerating. The most rapidly melting ones are likely to be gone within a century.
As this happens, the ice sheets sitting over Antarctica’s land—which hold the equivalent of 60 meters of sea level—will speed up their descent into the ocean, causing it to rise globally.
—Michael Slezak, New Scientist (April 4, 2015)
The previous section underscores the critical keys to the stability of the WAIS held by ice shelves. Ice shelves act as a “safety band” constraining the motion of ice streams as they approach the sea. Once ice shelves weaken or break apart, their ability to restrain or hold back the advancing ice diminishes. This opens the door for glaciers and ice streams to quicken their pace across the grounding line and disgorge more icebergs. Furthermore, as indicated above, the reverse slopes underlying many WAIS ice streams and glaciers near their grounding lines set the stage for a runaway marine instability, with serious repercussions for future sea level rise.
Although still intact, West Antarctic ice shelves, especially those lining the Amundsen and Bellingshausen Sea coasts, have thinned and melted within the last 10–15 years.49 In particular, ice shelves in the Amundsen Sea Embayment, fed by glaciers including the aforementioned Pine Island, Thwaites, and Smith Glaciers, have been melting faster than elsewhere. The ocean has gained 282 to 310 billion metric tons of water per year over the past two decades by eating away at ice shelves.
Deteriorating Ice Shelves
Ice shelves expand by ice crossing the grounding line, snowfall, and basal freezing of sea water. Conversely, they shrink by calving icebergs, by melting from top or bottom, and by wind stripping surface snow. Melting from below now accounts for over half of Antarctica’s ice attrition.50 Within the past two decades, favorable winds have steered somewhat milder water into a number of submarine troughs that traverse the continental shelf. This water, a modified form of Circumpolar Deep Water, circulates around the continent at intermediate depths at a few degrees above the freezing point.51 The water has warmed by 0.1° to 0.3°C (0.2–0.5°F) per decade under the Amundsen Sea and Bellingshausen Sea ice shelves.52 There, westerly winds induce upwelling and steer warmer CDW beneath the ice shelves, causing greater basal melting there than elsewhere. In other regions, such as off the Ross and Ronne-Filchner Ice Shelves, strong easterlies instead force CDW down to greater depths, which limits warm-water incursions beneath ice shelves.
However, other forces also attack ice shelves. Flexing of the ice shelf at its ocean edge by waves or tides stresses the ice, which initiates multiple small surface cracks. Water draining summer melt pools enters crack tips under pressure and eats deep into the ice, gouging out the cracks and crevasses (hydrofracturing).53 Seawater trapped in firn pores furnish additional inputs of water. Bottom-reaching cracks can then calve off iceberg slabs.
Ice cliffs may tumble into the sea once an ice shelf disintegrates. Cliffs fail as deep crevasses open up near the grounding line or thinned ice shelves reduce buttressing. Crevasses also develop in other zones of high shear stresses, for example, where the ice shelf rubs against valley or bay walls, or against slower-moving ice. Thinner ice shelves and faster-moving tributary glaciers in such marginal zones may tear cracks in the ice that expand into full-fledged rifts, whose presence may precondition the ice shelf to further rifting and breakup in a positive feedback loop. The growing frequency of such events in a warming climate will hasten ice sheet shrinkage.54
A different kind of rift, this one of geologic origin, may possibly also contribute to a pullback of the West Antarctic Ice Sheet one day. Such rifts in solid rock, now buried under the ice, were created by tectonic plate motions. These are described further in box 6.1.
BOX 6.1: BURIED RIFTS AND RETREATING ICE SHELVES
Ground-penetrating radar that “sees” under the ice discovered a narrow basin underlying the Ferrigno Ice Stream in the Bellingshausen Sea sector of the WAIS.* This depression belongs to a major fault system that runs from the interior of the ice sheet to the sea. The rift further intersects a glacially eroded submarine trough at an angle offshore, which probably originated along a preexisting tectonic lineament. The direction of ice flow and, more importantly, that of ice thinning matches that of the proposed rift basin. A similar rift system also underlies the Pine Island Glacier. Warmed ocean water thus gains convenient access into submarine troughs on the continental shelf and thence into the onshore subglacial rifts, where additional ice erosion occurs. These pathways of geologic origin, buried under ice, could therefore exacerbate any potential marine ice instability.
“Upside-down rivers,” or channels etched into the base of the shelves’ ice by warm ocean water currents, present another threat to the ice shelves’ survival.55 Satellite laser altimeters detect these ice-bottom channels by the shallow, winding depressions they leave on the surface of the ice shelf. (Because ice is thinner over a basal channel, it floats lower than adjacent thicker, channel-free ice. The surface depressions are therefore mirror images of the water-etched channels below.) Not too surprisingly, their abundance peaks on West Antarctic ice shelves, where CDW incursions have intensified basal melting (see “Deteriorating Ice Shelves,” earlier in this chapter). The vast majority of these channels form by intrusion of warmer ocean water, including channels that start at grounding lines but otherwise bear no obvious relation to outflow of subglacial meltwater.
Satellite images illustrate a number of cases where ice-bottom channels have focused crevassing and even caused splits in the ice. The formation of multiple channels can therefore weaken the ice structure, adding yet another link to the cascading chain of events threatening ice shelves: warm ocean water incursions under ice shelves, increased basal melting, etching of subice channels, ice shelf thinning/breakup, escalating ice discharge and calving rates, crumbling ice cliffs, ice sheet retreat, and accelerated sea level rise.
This simple picture of ice shelf wastage is clouded by the myriad ways in which meltwater can reach the sea. Aerial photos and satellite imagery from 1954 to 2014 show meltwater exiting the ice sheet and coalescing into streams that drain across the ice shelves, often terminating in cascading waterfalls along the edges of the shelves.56 By efficiently removing surface meltwater, these streams prevent pooling of water into meltwater lakes and help buffer the ice shelves against damage by hydrofracturing. On the one hand, steeper slopes, low-albedo rock, and bare ice exposure favor stream development and shelf stability, while on the other hand, a flatter topography and thick snow cover promote surface ponding that would lead to shelf instability. Which of these opposing processes would dominate in the future remains highly uncertain at this point.
In contrast to West Antarctica, where warming ocean water has undermined ice shelves, the higher summer air temperatures and overall milder Antarctic Peninsula climate have spurred the retreat of a number of ice shelves through proliferation of surface meltwater ponds, as well as hydrofracturing (chap. 2, and “Aprons of Ice” and “Deteriorating Ice Shelves,” earlier in this chapter). While atmospheric influences are currently less important elsewhere in Antarctica, this may change in the future as global temperatures rise.
Releasing the Floodgates
Does the rapid surging of tributary glaciers on the Antarctic Peninsula after collapse of their ice shelves foreshadow analogous behavior on the much larger West Antarctic Ice Sheet (WAIS)? Mounting evidence links WAIS ice shelf thinning to retreat of grounding lines and speedup of ice streams or glaciers. After analyzing recent Antarctic ice sheet losses, H. D. Pritchard of the British Antarctic Survey and his colleagues put it emphatically and succinctly: “Ocean-driven ice-shelf thinning is in all cases coupled with dynamic thinning of grounded tributary glaciers…and the majority of Antarctic ice-sheet mass loss…It is reduced buttressing from the thinning ice shelves that is driving glacier acceleration and dynamic thinning. This implies that the most profound contemporary changes to the ice sheets and their contribution to sea level rise can be attributed to ocean thermal forcing that is sustained over decades and may already have triggered a period of unstable glacier retreat.”57 Other recent studies corroborate these conclusions. The fastest-changing ice shelves—Getz, Dotson, Thwaites, Pine Island, Abbot, and Venable in the Amundsen Sea and Bellingshausen Sea sectors of the WAIS—are the very shelves attached to glaciers with the fastest-retreating grounding lines that unleash the most ice: e.g., Kohler, Smith, Haynes, Thwaites, and Pine Island Glaciers.58 As Pritchard and many others observe, warming ocean waters aided by favorable winds set the ball in motion. But the loss of ice shelves, abetted by the marine ice sheet instability, will keep the ball rolling.
Floating ice shelves are held in place by small islands, submerged obstacles, and friction of ice scraping against the sides of a fjord or embayment. These “pinning points” exert a pressure, or backstress, that resists the advance of glaciers or ice streams. But as thin or highly fractured ice shelves become “unpinned,” they lose this buttressing support. The outcome is like releasing the floodgates of a barrage on a river.
Nevertheless, not all parts of an ice shelf exert equal buttressing capabilities. Calculating the forces that determine the stability of an ice shelf, a group of researchers led by Johannes Jacob Fürst of the Centre National de la Recherche Scientifique (CNRS) in Grenoble, France, found that only 13 percent of the ice shelf area around Antarctica constitutes a “safety band,” or, in other words, comprises “passive ice shelves” that will have a minimal effect on ice velocity farther upstream if lost.59 Once this safety band disappears, whether through ice shelf thinning or calving, the surviving ice shelves becomes even more vulnerable to processes that undermine buttressing. The most vulnerable ice shelves—those with the smallest safety bands—lie in the Amundsen and Bellingshausen Sea sectors, which also sustain the highest shelf-thinning rates. Many of these ice streams overlie sunken subglacial basins or valleys that plunge deep into the heart of the West Antarctic Ice Sheet. This potential marine ice sheet instability setup could therefore lay the groundwork for the deicing of much of the WAIS.
But will the loss of ice shelves inevitably lead to irreversible marine ice sheet instability? Are such alarmist visions of an imminent or long-term WAIS meltdown premature? The next section looks into some counteracting processes that could slow down or even neutralize such a dire outcome.
Maybe Not So Fast!
An ice stream resting on bedrock that slopes inland (i.e., a MISI setup) may not always be unstable. Its stability depends on multiple factors, such as how readily ice flows over the evolving surface characteristics of the floor, variations in bedrock slope or ice stream width, ice accumulation rates, and strength of ice shelf buttressing at the grounding line. The grounding line may survive on a reverse slope for a while under favorable conditions. For example, a narrow subglacial trough slows down retreat, because first, the ice stream experiences greater drag along the sides of the pinched-in pathway, and second, advancing ice from the hinterlands piles up, thickens, and steepens the surface slope, which may temporarily stall retreat, assuming rates of ice thinning or sea level rise do not change.60
Furthermore, ice shelf melting involves a complex web of reactions that affect the grounding line position and ice stream flow. In spite of advances in modeling of ice shelf and grounding line behavior, it is still difficult to predict outcomes of multiple interactions that stabilize or destabilize a reverse slope, or whether loss of an ice shelf would inevitably trigger a marine instability.61
Two important negative feedbacks, generally overlooked in extreme scenarios of a runaway ice meltdown, may also rein in the rise of global sea level. The first feedback involves adjustments of the Earth’s lithosphere to a diminished ice load and weakened gravity.62 The Earth’s lithosphere rebounds after an ice burden disappears (called “glacial isostatic rebound”), thereby lowering local sea level. Glacial rebound acts partly in an instantaneous, elastic manner and partly in a much slower, sluggish, or viscous fashion, lasting centuries to millennia. Because West Antarctica overlies a less viscous (i.e., more fluid) region of the mantle, ice losses result in a quicker, higher, and more localized uplift associated with a deeper fall in sea level near the grounding line, which could impede further ice recession.
The gravitational feedback causes water to flow away from the shrinking ice sheet due to its weakening gravitational pull, which further cuts back local sea level rise. A fall rather than rise in sea level near the grounding line hinders the two main driving forces that lead to collapse of the ice sheet. The drop in sea level prevents warmer CDW from reaching the base of ice shelves, thus impeding bottom thawing and fending off ice shelf breakup. Second, the grounding line would migrate to a higher elevation as the land uplifts and local sea level drops, thus reversing the march toward a marine ice sheet instability. Moreover, the once-inland-slanting slope would flatten, and even slant seaward due to glacial rebound. Computer models that include both feedbacks acting in concert find that these offsetting feedbacks significantly cut anticipated Antarctic ice losses, as compared with losses without these offsets.63 These offsets become most effective for modest atmospheric carbon dioxide increases and assumption of a less viscous or rigid upper mantle, like that of West Antarctica. Very high CO2 levels will probably overwhelm the effectiveness of these two geophysical feedbacks. Nonetheless, their existence teaches us to treat claims of an imminent onset of a marine ice sheet instability with a note of caution.
THE EAST ANTARCTIC ICE SHEET (EAIS)
Does only the West Antarctic Ice Sheet lie on shaky ground? How stable is the East Antarctic Ice Sheet? Far more massive than the West Antarctic Ice Sheet, the East Antarctic Ice Sheet holds a mass of ice equivalent to a sea level rise of 52 meters, versus 5 meters (171 versus 16 feet) for the WAIS.64 Unlike its western neighbor, gains in EAIS snow and ice accumulation still exceed losses from ice shelf melting or iceberg calving. Nevertheless, a few fringing ice shelves have thinned between 2003 and 2008, notably Shackleton, Amery, and Totten Ice Shelves, as well as the Wilkes Ice Shelf.65
What potential exists for a marine ice sheet instability in East Antarctica? Bedmap2, which mapped the subglacial surface of Antarctica in unprecedented detail (see “Hidden Mountains and Volcanoes,” earlier in the chapter), discovered lengthy subglacial rifts, large segments of which are grounded far below sea level. More recent airborne surveys over the East Antarctic Ice Sheet with radar and gravitational and magnetic sensors have detected a subglacial, 1,100-kilometer-long canyon—the longest in the world and nearly as deep as the Grand Canyon.66 These subglacial characteristics may influence the future strength of large portions of the EAIS.
Like many ice shelves in West Antarctica, the Totten and Moscow University Ice Shelves in the Wilkes region of the East Antarctic Ice Sheet abut a large, marine-based portion of the ice sheet. Totten Glacier in East Antarctica drains a large catchment—the Aurora Subglacial Basin—which holds enough ice to raise global sea level by 3.5 meters (11.5 feet) if melted—comparable to the amount for the WAIS.67 A fifth of the Totten Glacier catchment lies well below sea level, covering a much vaster area than previously suspected. The Totten Glacier Ice Shelf has thinned more than other East Antarctic ice shelves, bathed by mild, modified Circumpolar Deep Water that enters cavities under the ice.68 A recently discovered subglacial channel appears to slice through a ridge between the main Totten Glacier Ice Shelf cavity and an adjacent cavity.69 This passageway could convey warmer water into cavities beneath the Totten Glacier Ice Shelf, the nearby Moscow University Ice Shelf, and Reynolds Trough, facilitating an eventual ice shelf pullback over a broad region.
The Totten Glacier grounding line further retreated 1–3 kilometers (0.6–1.9 miles) between 1996 and 2013.70 Sections of the grounded edge of the ice shelf show topographic features that favor a rapid retreat, but rises in slope farther upstream would hinder subsequent regression. While no specific conduits to rapid upstream retreat were found, ruling out any immediate threat of marine instability, the Totten Glacier does share several features with West Antarctic ice shelves. The Totten Glacier Ice Shelf catchment drains an ice volume comparable to that of the WAIS. A significant portion of the basin is grounded below sea level, and yet-to-be-discovered passageways may exist that allow warm ocean water access into deep, downward-sloping cavities toward the interior of the ice sheet. The large sea level rise potential and potential MISI setup underscore the need for more-detailed subglacial bathymetric data for this area.
The Wilkes Basin, located west of the Transantarctic Mountains, holds the largest volume of marine ice on the East Antarctic Ice Sheet that overlies subglacial troughs. The Wilkes Basin, although still stable, is drained by the Cook and Ninnis Ice Streams, with a bathymetry similar to that of the Totten and Moscow University Ice Shelves. What would happen if warm water could enter the ice shelf’s underside? Two German researchers devised a computer model simulation to find out.71 In their simulation, warm water pulses of 1°–2.5°C (34°–36.5°F) invaded ice shelf cavities over periods lasting between 200 and 800 years. A small ice mass called the “ice plug” controls the stability of the marine-based ice. Once this plug melts beyond a threshold of a more than 80-millimeter sea level equivalent, the entire basin begins to destabilize.
The self-sustaining retreat eventually causes sea level to rise 3–4 meters (10–13 feet) over 10,000 years. But the instability sets in only if the grounding line can reach the deep inland steepening canyons beyond the ice plug. This topographic setup closely resembles that of Pine Island Glacier, which may already be experiencing unstable retreat (see “The West Antarctic Ice Sheet (WAIS)—On Shaky Ground,” earlier in this chapter). While these finds raise tantalizing questions, the exact pathways of warmer water into subglacial basins await further clarification.
A LOOK BACK AND AHEAD
The foregoing shows that even Antarctica, the coldest continent on Earth, may no longer be immune to the forces that undermine the cryosphere elsewhere. Although we may not yet fully understand all relevant processes, an emerging picture suggests that parts of Antarctica may be susceptible to the great thaw also gripping the Arctic and the high mountains. But a much longer record, one that stretches far beyond the historic period of instrumental records, gives us a better long-range context with which to judge the true significance of the observed twentieth- and early twenty-first-century ice attrition. By peering into the distant past, we gain a deeper understanding of the processes governing ice sheet growth or decay. This knowledge strengthens our ability to interpret recent changes, anticipate plausible scenarios of ice sheet instabilities, and improve predictions of future sea level rise. The next chapter looks back at the long journey of ice buildup in Antarctica and, more recently, in Greenland. Major meltdowns also punctuated the road to an ice-house world. What can these past episodes of large-scale, rapid ice sheet meltdowns teach us that would shed light on the future of the two major ice sheets? How likely is it that such a rapid thaw will occur within the next century or two? What can our reading of the past record and computer models foretell about the future? After answering these important questions to the extent possible given our present understanding, in the final chapter we explore the human consequences of the oncoming deglaciation and transition to a more aquatic existence.

