Chapter 9
The Tullig and Kilkee Cyclothems in Southern County Clare
JIM BEST, PAUL B. WIGNALL, ELEANOR J. STIRLING, ERIC OBROCK & ALEX BRYK
9.1 Introduction
The Tullig Cyclothem marks the first and thickest of the repeated cyclical pulses of sedimentation that filled the Shannon Basin after deposition of the Gull Island Formation, with a total of five such deltaic cycles being seen in County Clare. Unlike the thickness trends in the early part of the fill of the Shannon Basin, the Tullig Cyclothem shows only slight thinning to the north-west of County Clare, whilst the overlying Kilkee Cyclothem shows a slight thickening towards the NE (the reverse of the trend present in the underlying Ross Sandstone and Gull Island Formations). These cyclical sediments have been widely interpreted to be the product of repeated delta progradation into the basin, accompanied by periods of sea-level rise and fall (Rider, 1974; Pulham, 1989; Collinson et al., 1991; Wignall & Best, 2000). This chapter provides details of excursions to view the principal localities of these fluvio-deltaic sediments in southern County Clare, with the exposures in northern County Clare being detailed in Chapter 10. Much of the exposure is along sea cliffs or low coastal outcrop and great care should be taken on slippery surfaces, when walking near high, steep cliffs, and in poor weather with high winds.
The erosive contacts at the base of some of the cyclothem sandstones, and the lateral change in facies, have been used to provide support for sequence stratigraphic explanations of the stratigraphy, including suggestions that the bases of the major fluvial sandstones in the cyclothems form Type 1 sequence boundaries due to base-level fall and basinward migration of the fluvial channels (Hampson et al., 1997). The cyclothems broadly consist of small-scale, coarsening-upwards cycles/parasequences in which the individual sandstone bodies generally become thicker upwards, although each cycle is associated with mouth-bar progradation and abandonment/retrogradation. As such, a wide range of lithologies and sedimentary environments are exposed in these cyclothems, from offshore muds to shoreface sands and from mouth-bar sediments to fluvial channels and interdistributary bay fills.
The lower part of each cyclothem shows mudstone- and siltstone-dominated prodelta facies, often with evidence of slope collapse (slumps, growth faults) and diapiric movement, whilst mouth-bar and distributary channel facies dominate the central parts of each cycle (Rider, 1974; Pulham, 1989). These mouth-bars and channels, in turn, are sharply/erosively overlain by fluvial sandbodies (e.g. the Tullig and Kilkee Sandstones) that may be capped by palaeosols. Other evidence for emergence includes coal horizons and fossil forests with in situ tree stumps. These fluvial sandbodies and terrestrial facies record the culmination of progradation within the cyclothems but do not mark the formational boundaries. Instead, marine bands were chosen as the markers to subdivide the stratigraphy by Hodson & Lewarne (1961), and this approach is still adhered to. Thus, the fluvial sandbodies are overlain by retrogradational (transgressive) successions that typically show a strong marine influence and can include shoreface sandstone bodies, with smaller parasequences within these transgressive sediments (Davies & Elliott, 1996; Wignall & Best, 2000; Obrock, 2011). In sequence stratigraphic parlance, transgressive systems tracts therefore form the upper part of the cyclothems and maximum flooding surfaces (marine bands) mark their lithostratigraphic boundaries.
There has been considerable debate as to the exact nature and direction of the deltaic, mouth-bar and fluvial progradation within the Shannon Basin (see Chapter 3) and the Tullig Cyclothem provides key exposures and palaeocurrents to assess the direction of sediment transport at this time in the basin evolution. Palaeocurrent data collected by a range of workers (Rider, 1969, 1974; Gill, 1979; Pulham, 1989; Williams & Soek, 1993; Wignall & Best, 2000, 2002; Stirling, 2003) has shown that the vast majority of palaeocurrents within the Tullig Cyclothem demonstrate flow towards the N/NE, suggesting a source to the S/SW. This has been interpreted either to represent the progradation direction of the major delta and its fluvial channels (Fig. 9.1.1A; Rider, 1974; Gill, 1979; Wignall & Best, 2000, 2002; Stirling, 2003) or a distributary channel that is running at a high angle to the principal south-easterly progradation direction (Fig. 9.1.1B; Pulham, 1989). Collection of palaeocurrent data, together with data that show the changing size and style of sedimentation within the Tullig Cyclothem, and in particular within the fluvial Tullig Sandstone, are clearly vital to resolve the differences in these models. The outcrops detailed in this chapter present the principal locations where data can be gained to address this key debate regarding the evolution of the basin.

Fig. 9.1.1. Models of delta progradation and evolution during the Tullig Cyclothem (after Stirling, 2003). A) Principal flow direction to the NE. B) Dominant flow to the SE with a major distributary channel running to the NE (redrawn from Pulham, 1989; reproduced with permission from the Geological Society of London). The yellow shading shows sediment transported through the distributary channels and deposited as mouth-bars at the delta front, whilst the green vegetation symbols represent plants and subaerial exposure.
This chapter contains details of several excursions to key localities of the Tullig and Kilkee Cyclothems in southern County Clare, which display a wide range of features associated with progradation of these major fluvial channels and subsequent transgressions that occurred at the top of each cyclothem. The localities detailed are at Tullig Point, Trusklieve, the coast road south of Kilkee, Kilkee, Killard, Carrowmore Point and Mutton Island. Each locality is detailed as a separate excursion in order that the reader can plan their own itinerary, with there being several stops at all localities except Tullig Point.
9.2 Tullig Point (UTM 445490 m E, 5829400 m N; Map 63, 077780 m E, 152665 m N)
The transition between the Gull Island Formation (Strachan & Pyles, Chapter 8) and the Tullig Cyclothem is visible at Tullig Point, above a large growth fault complex in the upper Gull Island Formation, as described in Chapter 8 (see Fig. 8.2.10, Chapter 8, Stop 1f). To reach Tullig Point, travel west from the village of Cross on the R487 for ~ 1.5 km and then turn north on the unsurfaced road towards Trusklieve. Proceed north for ~ 1 km and then turn west on a dirt road that ends at a quarry, where you can park on the east side of the quarry. After a short walk to the north side of the quarry, the lowest Tullig Cyclothem strata are viewed in spectacular, but largely inaccessible, cliff sections. The Tullig Cyclothem has its maximum thickness (200 m) at its southernmost outcrop and type section at Tullig Point (UTM 445490 m E, 5829400 m N; Map 63, 077780 m E, 152665 m N; Fig. 9.2.1A). The outcrops described at this locality may be accessed by walking along the coast to the north of the Point of Relief to Tullig Point and for a short distance to the north of here. This location will take approximately 2 hours to visit.
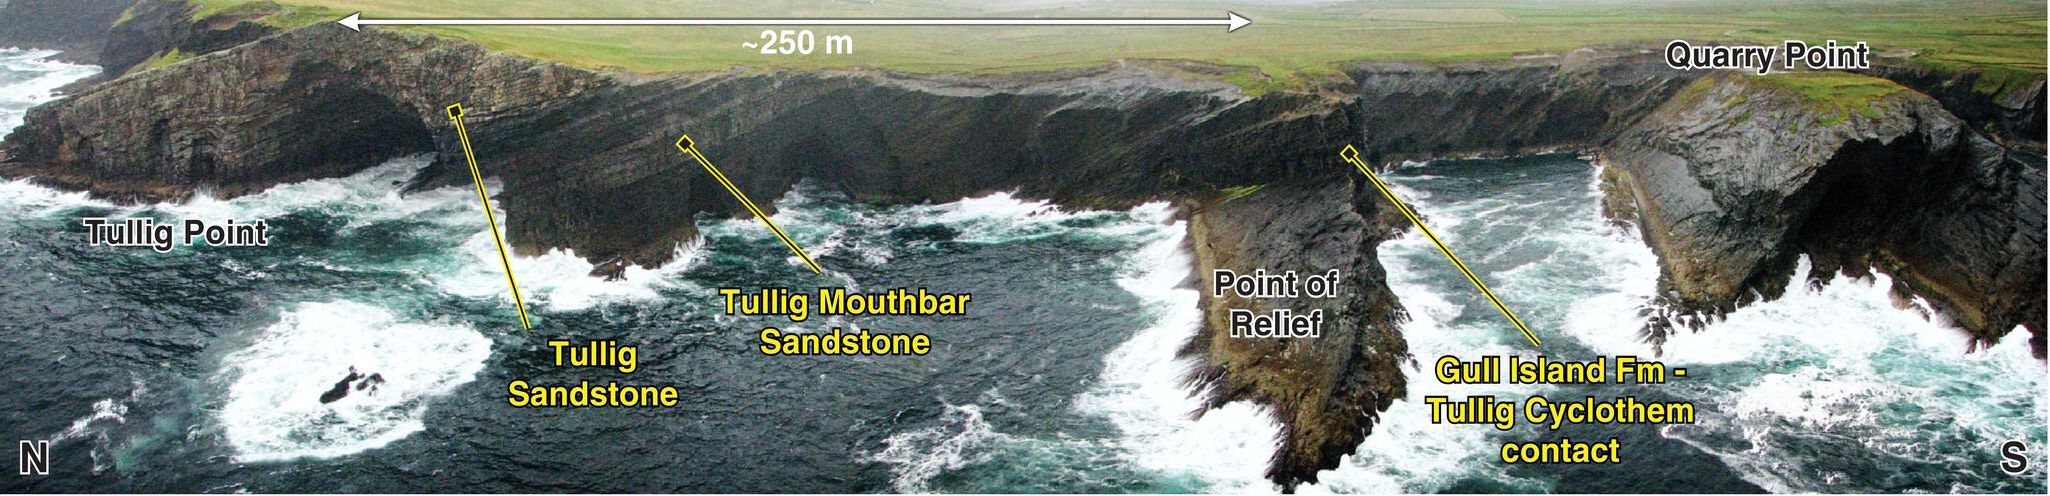

Fig. 9.2.1. A) Aerial photograph of the cliffs at the Point of Relief and Tullig Point, with the Tullig mouth-bar sandstone, Tullig Sandstone and Tullig Cyclothem – Gull Island Formation contact indicated (photo courtesy of David Pyles). B) Photograph of the Tullig Point outcrop, showing mouth-bar sandbody (centre of cliff) and Tullig Sandstone (capping cliff to left, labelled). Log shows succession from sharp base to top of mouth-bar sandbody. Arrows on log indicate palaeocurrent directions.
Laminated silty shales dominate the lower part of the cyclothem (see Fig. 8.2.10, Chapter 8) but gradually coarsen-up into siltstones and fine sandstones. These sediments can be examined in the cliff top exposures at UTM 445610 m E, 5829365 m N (Map 63, 077900 m E, 152629 m N) and UTM 445570 m E, 5829540 m N (Map 63, 077862 m E, 152804 m N). The increasing frequency of thin, wave-rippled sandstones, with some surfaces showing rare thread-like trace fossils, records the progradation of a delta into a wave-dominated basin. A mouth-bar sandbody caps the coarsening-up trend that can be viewed in the cliffs at Tullig Point (Fig. 9.2.1A,B) and in which large cross-beds can be seen at the cliff top. Several further cycles are developed in the Tullig Cyclothem. Pulham (1989) clearly showed the extremely limited lateral extent of the cycle-top sandbodies (a few kilometres at most). This is considered a consequence of their point-sourced distributary and mouth-bar origin.
The style of sedimentation of the Tullig Cyclothem changes abruptly with the appearance of the Tullig Sandstone, a sharp-based, extensive sheet sandbody. The Tullig Sandstone reaches its maximum thickness of 60 m at Tullig Point (Figs 9.2.1 and 9.2.2) but can be traced along the entire length of the County Clare coastline. In this cliff section, the rather irregular internal geometry of the Tullig Sandstone suggests stacked channel sandbodies of a fluvial system. This sandbody will be examined in detail at Trusklieve (see 9.3 below). It represents the most proximal facies of a prolonged, continuous phase of basin fill that began with the basin-floor turbidites of the Ross Sandstone Formation and ended in the fluvial facies of Tullig Point.
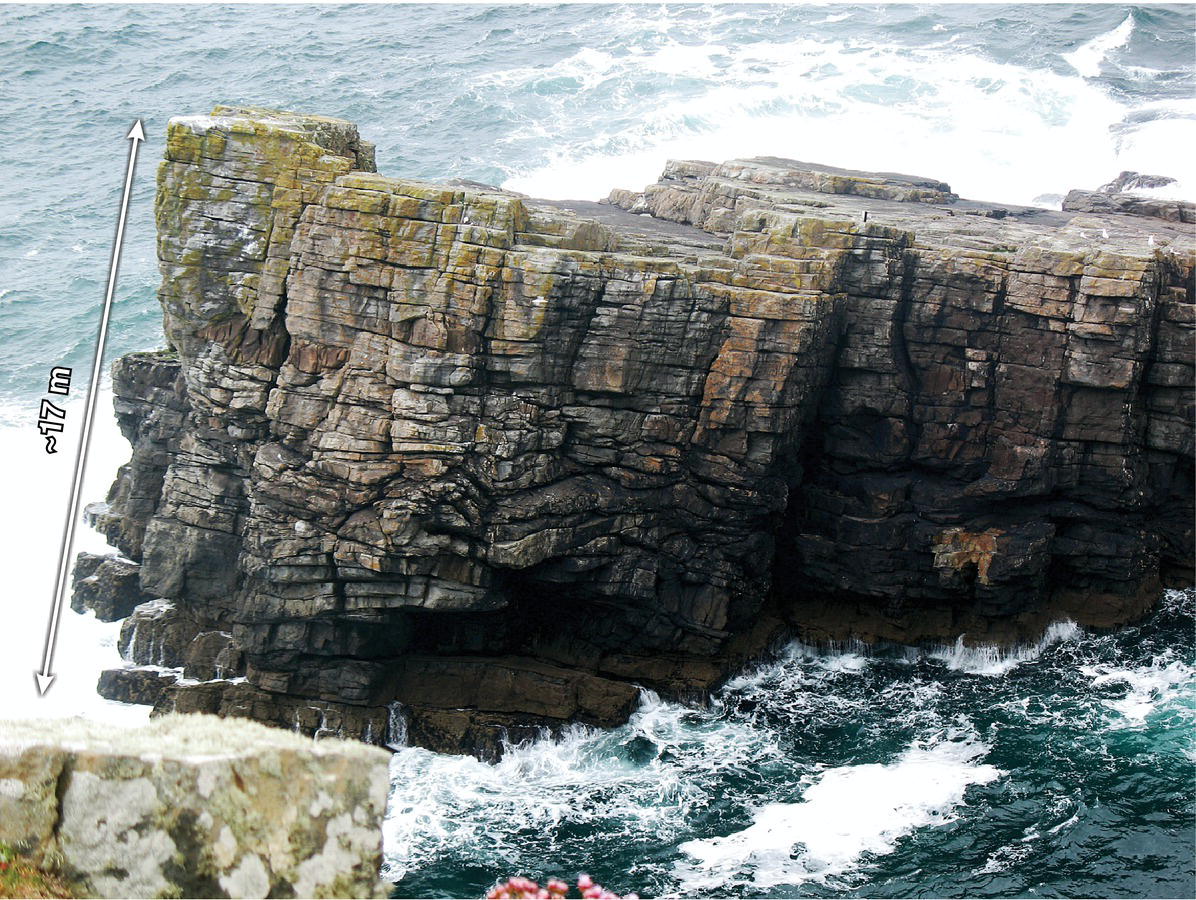
Fig. 9.2.2. The Tullig Sandstone at its type locality at Tullig Point, where it is over 50m thick. The lower part of the sandbody shown here shows irregular bedding, suggesting stacked channels, whilst the upper part is better bedded and may represent a mouth-bar facies.
Exposures to the north of Tullig Point show the initial flooding surface above the Tullig Sandstone (UTM 445435 m E, 5829719 m N; Map 63, 077730 m E, 152985 m N) that contains abundant Zoophycos traces and then is overlain by a series of well-laminated siltstones (Fig. 9.2.3) with each lamina showing a fining-upwards motif. The thin, dark laminae are between 1 and 10 mm thick and lighten in colour upwards, whereas the light-coloured laminae are between 0.01 and 0.1 m thick, fine-upwards and contain occasional vertical burrows (Fig. 9.2.3). These siltstones probably represent the products of hypopycnal flows at the delta front, with sediment settling from suspension. The outcrop to the north is covered until the top of a sandstone bed that is exposed at UTM 445570 m E, 5829868 m N (Map 63, 077867 m E, 153132 m N), where a wave-rippled, bioturbated sandstone is overlain by c. 3 m of dark grey sideritic siltstone that is, in turn, capped by a marine band containing the goniatite Reticuloceras aff. stubblefieldi, representing the maximum flooding surface at the top of the Tullig Cyclothem. The stratigraphic distance between the top of the Tullig Sandstone and this marine band is c. 77 m at this locality, with the wave-rippled sandstones towards the top of this transgressive package demonstrating a shallowing-upwards sequence before the final transgression that produced the maximum flooding surface at the top of the Tullig Cyclothem (Wignall & Best, 2000; Obrock, 2011). The entire sequence within the Tullig Cyclothem can only be viewed partially at Tullig Point, due to the inaccessibility of the outcrop. However, other sections along the coast afford opportunities to examine all parts of the Tullig Cyclothem, and its lateral and vertical variability, in detail.
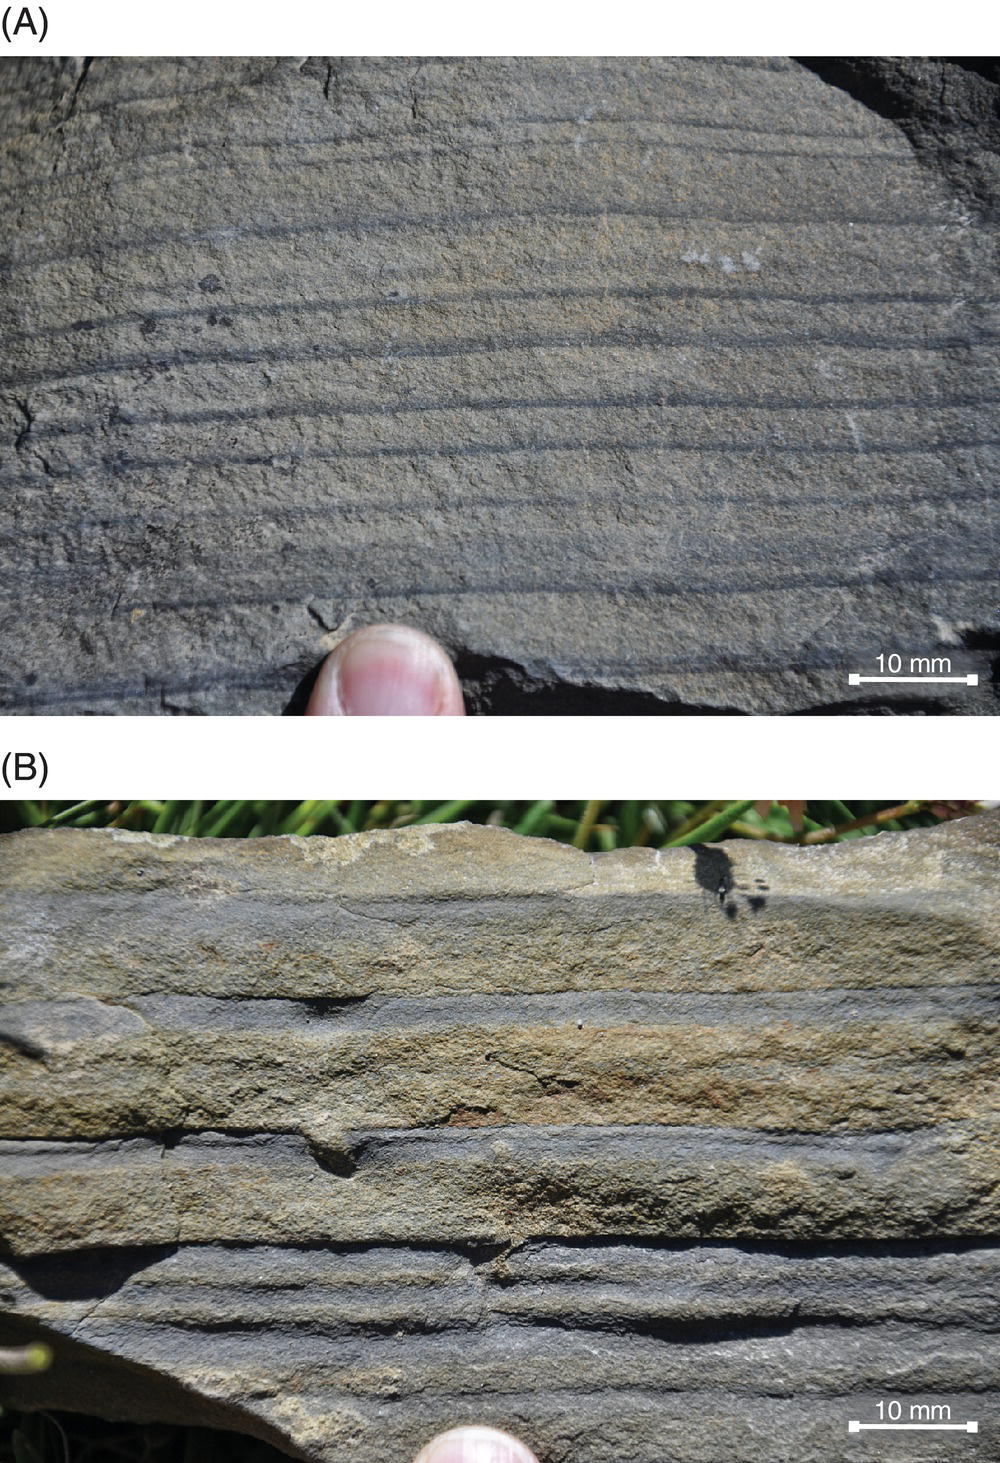
Fig. 9.2.3. Well-laminated siltstones within the Tullig Cyclothem at Tullig Point showing: A) distinct fining upwards within each lamina, representing deposition from suspension fallout from hypopycnal plumes; and B) occasional minor bioturbation.
Transfer to Trusklieve
From the Tullig Point outcrop, turn north on the gravel track and follow the road through the hamlet of Tullig and then down the hill where you will reach a crossroads. Turn left and follow the road towards Trusklieve, where after c. 2 km you will reach a tight right-handed hairpin in the road (UTM 447929 m E, 5831175 m N; Map 63, 080245 m E, 154407 m N), with a small track leading off to the left (west). Take this track for c. 0.75 km where it is possible to park off the track and around 100 m away from the large coastal inlet that forms part of the Trusklieve outcrop. Note that this last gravel track is small, uneven, the verges are very soft and care should be taken in driving along here.
9.3 Trusklieve (UTM 447929 m E, 5831175 m N; Map 63, 080245 m E, 154407 m N)
The coastal and cliff-top exposures of the Tullig Cyclothem near the small hamlet of Trusklieve (Fig. 9.3.1) allow viewing of, and access to, some of the most important and beautifully exposed Tullig sections. The sections near Trusklieve are exposed in a cliff-top amphitheatre, in vertical cliffs and in smaller cliff-top exposures, and a full day is required to fully examine the sediments exposed here. The sections described below are mainly to the south of a very prominent inlet in the coastline (Fig. 9.3.1; UTM 447193 m E, 5831220 m N; Map 63, 079509 m E, 154463 m N) that has sheer vertical sides of some 50 m in height. Great care should be exercised at all times at these localities as the loose edges, slippery surfaces and winds all call for extra safety vigilance.

Fig. 9.3.1. Location map of the outcrops at Stops 1 to 4 at Trusklieve. Coordinates in inset map are UTM.
Image courtesy GoogleEarth; © DigitalGlobe.
Pulham (1989) provided a detailed study of the Tullig Cyclothem at Trusklieve and presented a sequence of logs and photographs that illustrate the sedimentology of a prograding mouth-bar and overlying fluvial channel sequence. Later work (Davies & Elliott, 1996) explored the sequence stratigraphic importance of these outcrops and discussed the erosive nature of the boundary between the Tullig Sandstone and the underlying sediments, interpreting this surface as a major sequence boundary that has regional relief purported to be ≰ 30 m. Stirling (2003) provides the most detailed account of the sedimentology of the Tullig Cyclothem fluvial facies and recognised a suite of sedimentary facies within this cyclothem (Table 9.3.1). These are used herein in many of the logs and photomontages from the Tullig Cyclothem. They reflect a range of processes operative in fluvial, shallow marine and deltaic environments.
Table 9.3.1. Lithofacies descriptions and interpretations of facies in the Tullig Cyclothem. From Stirling (2003). Facies codes are from Miall (1996) where interpretations agree with Miall’s fluvial facies scheme; other codes, not representing existing facies schemes, have been chosen specifically for facies seen in the outcrops studied.
| Code | Lithofacies type | Description | Depositional process/interpretation | Facies association |

|
Massive to faintly bedded sandstone | Well-sorted, clean, yellow, massive sand with occasional faint, patchy lamination. | Deposited by sediment gravity flows, for example in small channels due to bank collapse. Alternatively due to very rapid deposition and subsequent homogeneous dewatering. | Smc, Sh, Shc, Sl, Sp, St, Sc, Ccm, Sd, Sr (channel-fill facies) |

|
Sm with conglomeratic lag and/or floating clasts | Well-sorted, clean, yellow, massive sand with occasional faint, patchy lamination. Clastic lag at base and rare floating clasts. | Deposited as for facies Sm, but with additional coarse material deposited at the base of the bed (as flow wanes) or higher in the bed (due to particle overpassing). | Sm, Sh, Shc, Sl, Sp, St, Sc, Ccm, Sd, Sr (channel-fill facies) |

|
Horizontally-laminated sandstone | Well-sorted, clean, yellow sand, parallel laminated, with primary current lineation. | Bedforms swept out by high velocity unidirectional flow, forming upper-stage plane beds. | Sm, Smc, Shc, Sl, Sp, St, Sc, Ccm, Sr (channel-fill facies) |

|
Sh with conglomeratic lag and/or floating clasts | Well-sorted, clean, yellow sand, parallel laminated, with primary current lineation. Clastic lag at base and rare floating clasts. Shows crude imbrication. | Upper-stage plane beds (as above) with deposition of coarse bedload fraction at base of bed. | Sm, Smc, Sh, Sl, Sp, St, Sc, Ccm, Sr (channel-fill facies) |

|
Low-angle cross-bedded sandstone | Low-angle (<10°) cross-beds in well-sorted yellow sandstone. Sl2 contains fine grained silty laminae. | Sl develops at the transition from dunes to upper-stage plane beds as bed forms are swept out by unidirectional flow. Sl2 formed by deposition from suspension on gently dipping surfaces. | Sm, Sh, Shc, Sp, St, Sc, Ccm (channel fill facies) (plus Flh, Fls, Flm for Sl2) |

|
Planar cross-bedded sandstone | Varying scale of planar cross-bedding in well-sorted, clean yellow sandstone. Foresets are typically asymptotic towards the flat lower set surfaces, and in Sp2 show mud drapes. | Migration of straight-crested (2-D) dune bedforms within unidirectional flow. | Sm, Sh, Shc, St, Sc, Sl, Ccm (channel-fill facies) (plus Sh2, Sl2) |

|
Trough cross-bedded sandstone | Scoop-shaped erosional bases to sets of trough cross-beds averaging 0.5 to 1.5 m thick. Foresets are asymptotic at base. Well-sorted, clean, yellow sands. | Migration of sinuous-crested (3-D) dunes within unidirectional flow. | Sm, Smc, Sh, Shc, Sp, Sc, Sl, Ccm (channel-fill facies) |

|
Sp, St or Sl with clast lag | As for Sl, Sp and St, with a lag of coarse material (gravel to pebble sized) at the base, and rare “floating” clasts. Clasts predominantly mud/silt, angular, and frequently deformed. | Erosion of fine channel-fill or overbank material during channel reoccupation or splay channel breakout. Deposition of gravel/cobble fraction at base of new channel scour as peak flows wane. | Sm, Smc, Sh, Shc, Sp, St, Sl, Ccm (channel-fill facies) |

|
Clast-supported massive to crudely bedded conglomerate | Gravel to cobble-sized clasts, predominantly mud/silt. Poorly sorted, angular to rounded, including deformed clasts. Organic debris often present. Patchy crude imbrication and horizontal stratification. Matrix of fine sand to muddy silt showing compaction-related deformation. | Eroded overbank or channel abandonment material incorporated in coarse bedload. Gravel and cobble fraction deposited at base of newly formed channel scour as strongly erosive peak flows wane. | Sm, Smc, Sh, Shc, Sp, St, Sc, Sl (channel-fill facies) |

|
Deformed sandstone | Clean, well-sorted yellow sandstone with convolute lamination, loading and other deformational features. Sometimes without any remaining signs of bedding. | Formed by soft-sediment deformation due to liquefaction and fluidization, possibly caused by a seismic shock. | Sm, Smc, Sh, Shc, Sp, St, Sc (channel-fill facies) |

|
Ripple cross-laminated sandstone | Cross-lamination (5-40 mm high) in well-sorted but slightly silty sand. Occurs in sandstone beds or as discrete thin (5-30 cm) beds within finer sediments. | Develop at low to moderate flow velocities in a unidirectional current. | Sp, Flh, Fls, Flm (channel-fill, mouth-bar or bay-fill facies) |

|
Climbing ripple cross-laminated sandstone | Climbing cross-lamination in well-sorted but slightly silty sand. Stoss and lee sides of ripples preserved. | Develop during rapid deposition within a waning unidirectional current. | Sp, Flh, Fls, Flm (bay-fill facies) |

|
Wave ripple cross-laminated sandstone | Symmetric ripples with continuous crests and bidirectional cross-lamination in well-sorted, slightly silty sand. | Develop during wave reworking of previously deposited sands. | Sp, Flh, Fls, Flm (mouth-bar and bay-fill facies) |

|
Hummocky cross-stratified sandstone | 3-D cross beds in dome-shaped features in well-sorted clean yellow sandstone. Dome surfaces often preserved, with wave-reworked tops. | Formed by storm wave reworking of sediment, usually in shelfal conditions but also nearer shore. | Sp, St, Sr, Flh, Fls, Flm (mouth-bar facies) |

|
Horizontally laminated sandstone (type 2) | Well-sorted, pale yellow, parallel-laminated sandstone with thin (<10 mm) silty laminae. | Formed by rapid deposition from suspension immediately in front of distributary mouth, producing laminated sands with silt layers at times of lower flow. | Sp, St, Sl2, Sr, Flh, Fls, Flm (mouth-bar facies) |

|
Interlaminated sand, silt and mud | Parallel to occasionally wavy-bedded interlaminated fine sands, silts and muds. Dark grey where muddier, through mid-grey silts to pale cream sands. Sand layers commonly show lenticular bedding (uni- and bi-directional). | Deposited from suspension with weak tractional currents and/or wave reworking producing ripple trains in sand and sandy silt. Interdistributary bay to general lower delta plain overbank environment. | Fls, Flm, Sh2, Sr, Srw, Src, Shcs (mouth-bar or bay-fill facies) |

|
Laminated silt | Parallel-laminated pale grey silt. Occasional bioturbation in some beds. | Fine material deposited from suspension in quiet water (marine, below wave base, or (where no bioturbation) overbank or abandoned channel environment. | Flh, Flm, Sh2, Sr, Srw, Src, Shcs (mouth-bar or bay-fill facies) |

|
Laminated mud | Parallel-laminated dark grey mud. Occasional bioturbation. | As Fls, but further from the sediment source. | As above (mouth-bar or bay-fill facies) |
Five localities at this site are detailed below:
- Two spectacular cliff-top outlooks where the whole sequence exposed can be viewed and the Tullig Cyclothem and its broad grain-size trends can be placed in context.
- A superb exposure of the contact between the Tullig Sandstone and the underlying fluvial-deltaic deposits.
- An exposure at the top of the Tullig Sandstone that shows the initial flooding surface during the start of the transgression over these fluvial sands.
- A cliff that shows the transgressive sediments that overlie the Tullig Sandstone and record the transition to the Kilkee Cyclothem.
Stops 1a and 1b: Overview of the sequence (UTM 447204 m E, 5831500 m N; Map 63, 079524 m E, 154743 m N)
Walk towards the prominent inlet and then proceed on its western side to a ledge (UTM 447204 m E, 5831500 m N; Map 63, 079524 m E, 154743 m N; Fig. 9.3.1) where you can view across the inlet and to the cliff face to the north. Great care should be taken when accessing and walking on this outcrop, especially when the surface is wet and the weather rainy and windy. There is no need to go very near the cliff edge at this locality. This viewpoint of the northern cliff (Figs 9.3.2 and 9.3.3) provides a superb overview of the section, showing an overall coarsening-upwards sequence in the Tullig Cyclothem that is capped by a very thick, amalgamated sandstone (the Tullig Sandstone). Within this overall coarsening-upwards trend, several smaller parasequences can be discerned that Davies & Elliott (1996) interpret as a transgressive systems tract (Fig. 9.3.3):
- A lower coarsening-upward sequence (denoted as a large coarsening-upwards trend, Fig. 9.3.2A) that starts at sea-level and possesses several laterally continuous sandstones near its top, eventually terminating in a prominent 2 to 3m thick sandstone that forms the large dipping bedding surface on the small island at the mouth of the inlet. The lower 60% of this cycle consists of siltstones and shales and the upper 40% then becomes dominated by sandstones that can be traced along the cliff line. This sequence has been interpreted as the product of progradation of a major axial mouth-bar (the Tullig mouth-bar) of the Tullig delta (Pulham, 1989).
- Above this main parasequence, but still below the Tullig Sandstone, a sequence of up to three thinner parasequences is present (denoted as smaller coarsening-upwards trends, Fig. 9.3.2A), each commencing in a shale/siltstone, with Parasequences 2 and 3 being cut into by the prominent sandstone in the middle of the outcrop (Figs 9.3.2 and 9.3.3). The vantage point from which you view this cliff is on the top sandstone of the second parasequence. The fourth parasequence, seen only in the cliff-face running into the inlet, consists solely of siltstones before being erosively truncated by the Tullig Sandstone. The interpretation of the upper three parasequences has varied between them representing shallow-water deltas during a transgressive period (Davies & Elliott, 1996; Figs 9.3.3 and 9.3.4), to them representing levee (Parasequence 2) and interdistributary bay fill sequences (Parasequences 3 and 4; Pulham, 1989; Fig. 9.3.5). These interpretations will be returned to below.
- Cutting erosively downwards into these underlying parasequences is the Tullig Sandstone: the erosive surface (Fig. 9.3.2A) can be clearly seen to cut down towards the north (seawards) and removes the whole of Parasequence 4 and approximately half of Parasequence 3 at the northern end of the cliff (Figs 9.3.2 and 9.3.3). The depth of erosion at this locality is approximately 6 to 7 m. The Tullig Sandstone has a different character from the sandstone of the underlying parasequences: it shows concave-up erosion surfaces, which are laterally discontinuous, with the sandbody comprising a series of amalgamated sandstones. A beautifully exposed cross-section through a shale-siltstone infilled channel is also present at the top of the outcrop (arrowed CF in Fig. 9.3.2B) and large-scale cross-stratification can be seen at several parts of the Tullig Sandstone (arrowed CS in Fig. 9.3.2B). The nature of the erosive contact at the base of the Tullig Sandstone has attracted considerable attention and has been interpreted as either due to autocyclic scour by the major river channels (Wignall & Best, 2000) or a Type-1 sequence boundary with the Tullig Sandstone being the infill of an incised valley (Davies & Elliott, 1996; Hampson et al., 1997; Figs 9.3.3 and 9.3.4). Davies & Elliott (1996) argue the underlying three small parasequences are deposits of a transgressive systems tract, with the primary parasequence representing a prograding lowstand wedge (mouth-bar; Fig. 9.3.3). These issues can be further addressed by examining in detail the sediments in part of this sequence at Stop 2 (see below).

Fig. 9.3.2. A) Photomontage of the Tullig Cyclothem from Stop 1a at Trusklieve. The four parasequences are labelled with arrows 1 to 4, showing coarsening-upwards trends in parasequences 1 to 3. Note also the erosive base to the Tullig Sandstone. See online GigaPan image. B) Close-up of cliff showing a mudstone-filled channel (CF); C) Close-up of cliff showing large-scale cross-stratification (CS) and erosive base of Tullig Sandstone.
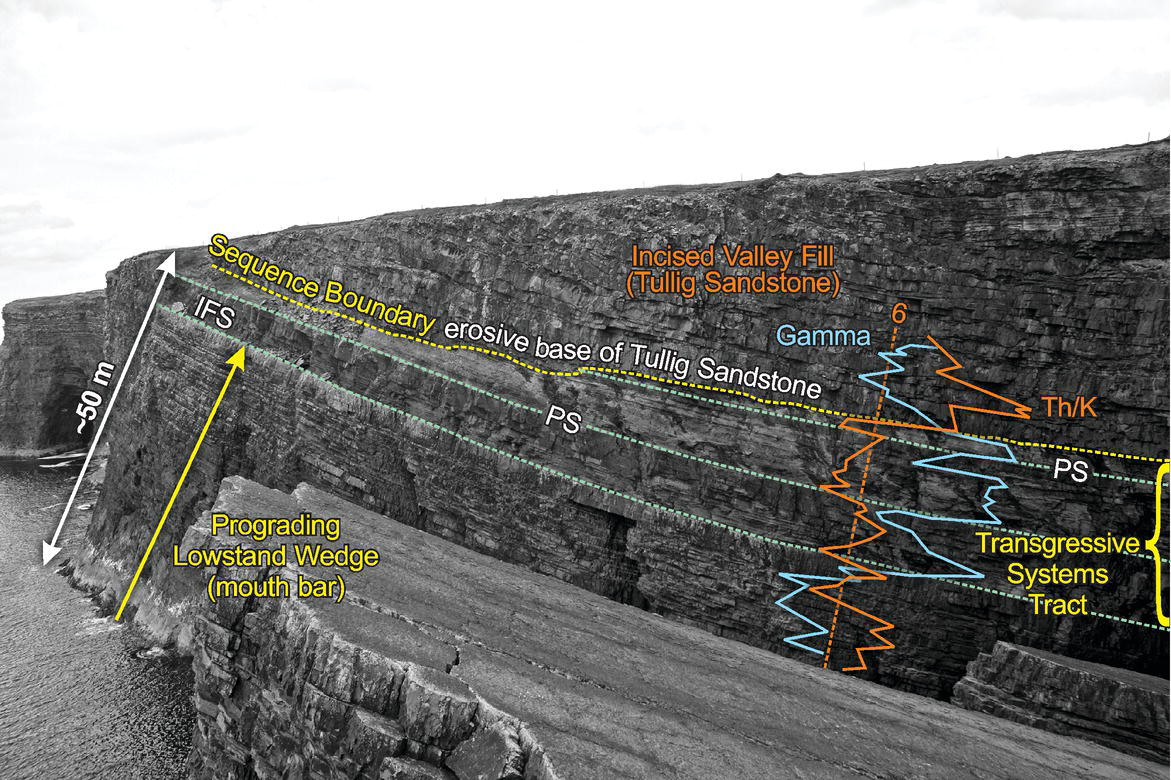
Fig. 9.3.3. Tullig Cyclothem at Trusklieve viewed from Stop 1a, showing Tullig Sandstone and underlying systems tracts. The logs from Davies & Elliott (1996; redrawn with permission from the Geological Society of London) are superimposed on the photograph showing: i) Gamma ray total counts; and ii) Th/K ratio, with reference line at Th/K = 6. These logs show the gamma correlation to the parasequence flooding surfaces and at the erosional unconformity. Note the 6 to 7 m of erosive relief at the base of the Tullig Sandstone. IFS = initial flooding surface; PS = parasequence boundary.

Fig. 9.3.4. Sedimentary log, gamma ray (cps), Th/K and Th/U profiles of the Tullig Sandstone and underlying systems tracts at Trusklieve (redrawn after Davies & Elliott (1996) with permission from the Geological Society of London). In the transgressive systems tract (4.5 to 21 m), there is a decreasing sand:silt ratio upwards that is characterised by a trend towards lower Th/K ratios relative to the successive parasequences. Also, note the low counts in the Tullig Sandstone, whose erosive base has an intraclast conglomerate. IFS = initial flooding surface; PS = parasequence boundary; SB = sequence boundary.
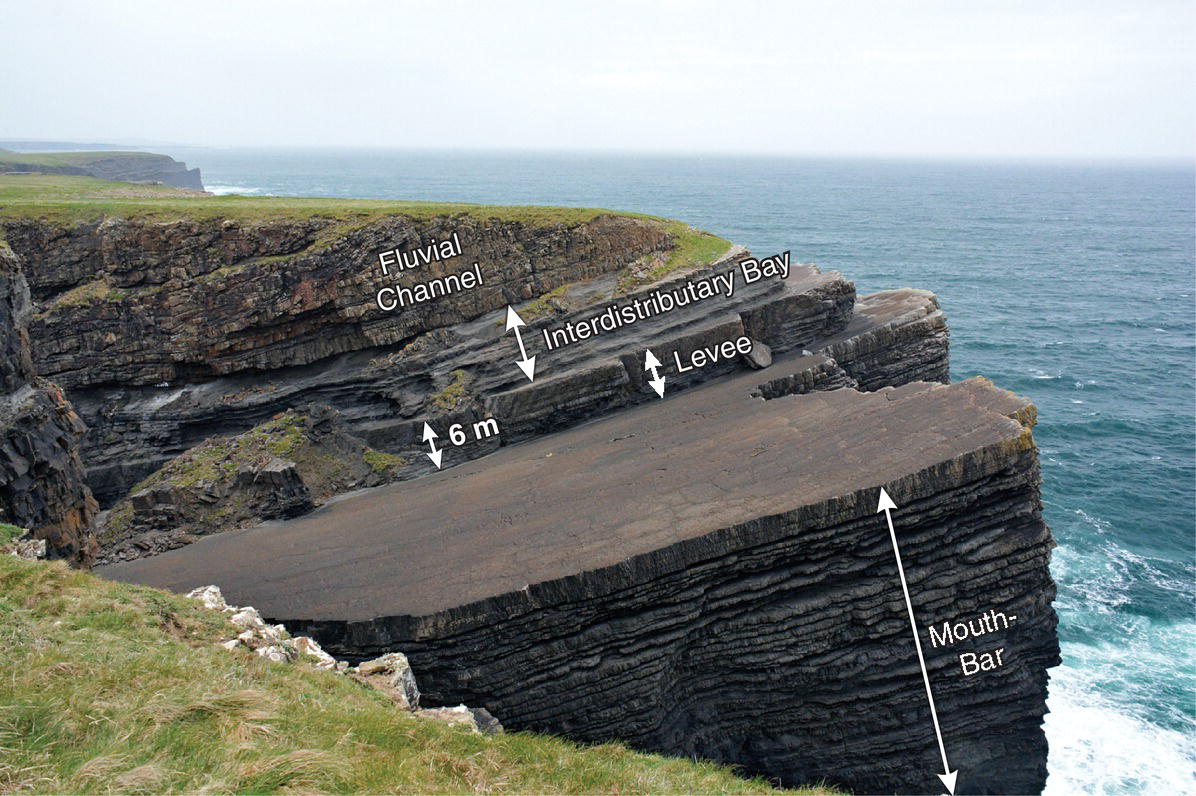
Fig. 9.3.5. Photograph of succession taken from Stop 1b at Trusklieve with the interpretation of palaeoenvironments taken from Pulham (1989) superimposed.
This location provides an overview of much of the Tullig Cyclothem. However, another view is obtained by walking around to the north side of the inlet and viewing back towards the south and the cliff top on which Stop 1a is located. This view from Stop 1b (UTM 447323 m E, 5831500 m N; Map 63, 079643 m E, 154741 m N) is illustrated in Pulham (1989, Fig. 9.3.5) in his interpretation of the entire sequence as a mouth-bar with levee/interdistributary bay fill sequences that are then overlain by the Tullig Sandstone – a minor Tullig distributary channel in his interpretation (Fig. 9.1.1B). The Stop 1b viewpoint also allows the erosive boundary of the Tullig Sandstone to be viewed in the steep faces of the gully (Fig. 9.3.6A), as well as the internal architecture of the Tullig Sandstone, which displays numerous erosion surfaces, large-scale cross-stratification and partially mud-/silt- filled channels (Fig. 9.3.6B).

Fig. 9.3.6. Photographs of the Tullig Cyclothem taken in the coastal inlet at Stop 1b. A) The erosive base of the Tullig Sandstone (labelled ‘e’) and the underlying parasequences; B) Detail of the internal geometry of the Tullig Sandstone showing large-scale internal erosion surfaces (e), cross-stratification (cs) and silt-filled channels or erosive remnants (s); C) Detail of the internal geometry of the Tullig Sandstone shown in Fig. 9.3.6B, showing cross-stratification (cs) and silt-filled channels or erosive remnants (s).
Stop 2: Trusklieve amphitheatre (UTM 447145 m E, 5831475 m N; Map 63, 079465 m E, 154718 m N)
From Stop 1a, walk approximately 100 m to the south-west where you will come to an extensive dipping sandstone bedding plane (Fig. 9.3.1), which represents the top of the third parasequence seen at Stop 1a. From this exposed surface, the outcrop in front of you forms a natural amphitheatre that trends NNE-SSW and exposes a superb section through the upper parasequences viewed at Stop 1 and within the Tullig Sandstone. Please be aware of the loose nature of rocks at the top of the amphitheatre outcrop and avoid any areas that show signs of recent rockfalls. Care should also be taken when walking on this bedding plane in wet weather.
The amphitheatre exposure allows access both to the sediments in the top parasequences and the strongly erosive base of the Tullig Sandstone; and it is possible to climb and examine the sandstones and shales within the Tullig Sandstone at the southern end of the outcrop. The thin, bioturbated sandstone that forms the main bedding surface shows symmetrical oscillatory flow ripples on its top surface and some surfaces possess small U-shaped Arenicolites burrows. The sediments immediately below the erosive contact of the Tullig Sandstone show magnificent preservation of a range of ripples, with a starved sand supply at this point, with both flaser, wavy and lenticular bedding (Fig. 9.3.7) and the ripples showing both oscillatory and longer-period reversing flows.
The erosive surface of the Tullig Sandstone is beautifully exposed in this outcrop and can be seen to cut down by up to 2.5 m into the underlying siltstones and sands. Numerous intraclasts of the underlying sediment, as well as clasts of darker shales (a lithology not seen in the immediately underlying strata) and large organic fragments and chunks of wood, can be found in coarse lag deposits within the lowermost sands of the Tullig Sandstone. Erosive flutes on the underside of the lowest Tullig sand show north-easterly flow directions.

Fig. 9.3.7. Interbedded siltstones and sandstones directly below the erosively-based Tullig Sandstone, Trusklieve ampitheatre, Stop 2. Note both the ripples with opposed current directions in this section, as well as the symmetric ripples formed under oscillatory flows.
The Tullig Sandstone exposure at Trusklieve affords one of the best opportunities to examine the detailed internal characteristics of this extensive sandbody, which has been interpreted widely as fluvial in origin (Rider, 1974; Pulham, 1989; Williams & Soek, 1993; Stirling, 2003). Note that there is also a plaque mounted halfway up the outcrop dedicated to the memory of Trevor Elliott.
The thickness of Tullig Sandstone here is approximately 22 m and Stirling (2003) identified five storeys, based on the erosional contacts between the beds and the intervening fine-grained sediments that have been interpreted as overbank or channel-fill facies (Davies & Elliott, 1996; Stirling, 2003). The thickness of the fines is seen to vary laterally across the outcrop, with one bed reaching up to 4.7 m thickness, although all these fine-grained beds are absent at the northern end of the amphitheatre outcrop. The five storeys can be examined in detail across and vertically upwards in the outcrop (Figs 9.3.8 to 9.3.10); and have the following principal characteristics:
- Storey 1: reaches up to 8.5 m in thickness and has a pronounced basal erosion surface with a relief of up to 2.5 m. At the northern end, it shows well-developed lateral accretion surfaces which, when corrected for tectonic tilt, dip gently to the NNE and WSW, with slickensides showing evidence for some later structural movement along these surfaces. These beds fine upwards from a conglomeratic lag at their base to fine-grained to medium-grained sandstones with planar cross-stratification and horizontal laminae. Stirling (2003) has interpreted these beds as representing lateral accretion on a barform, with predominant flow to the NNE. Towards the centre of the outcrop, Storey 1 becomes more heterogeneous and is dominated by concave-upwards erosional surfaces with conglomeratic lags being common. Fine-grained sediments are interbedded with these sands and conglomerates but are discontinuous and extend laterally for between 4 and 28 m. One of these fine-grained pods of sediment has yielded the freshwater conchostracan Hemicycloleaia (Wignall & Best, 2000). The flow directions in the sandstones here are NE-ENE and these sediments have been interpreted as representing accretion of a bar form within low-sinuosity channels that were of the order of 6m deep (Stirling, 2003).
- Storey 2: this erodes into Storey 1 progressively from north to south across the outcrop and at the southern end of the amphitheatre completely cuts out Storey 1, producing an erosional relief of c. 8.5 m. Storey 2 is between 2 and 10.5m thick and predominantly comprises poorly preserved planar cross-strata with occasional impersistent conglomeratic mudclast beds, with some evidence for larger-scale accretion surfaces also being present. The sandbody can be further subdivided, based on the erosional contacts, into three substoreys (Fig. 9.3.8), with Substorey III showing a beautiful concave-upwards erosional contact and the sandy fill of a small channel, whose fill is approximately 20m wide and 3.2m thick. This channel-fill probably represents a smaller, secondary channel cutting across the bar-tops of the underlying Substoreys I and II (Fig. 9.3.8), with the axis of this small channel being approximately normal to the outcrop face. However, these sediments are inaccessible and the absolute flow direction in this channel cannot be discerned. Storey 2 is draped by a thin, laminated siltstone and mudstone to the south (logs Trusklieve 3 and 4, Fig. 9.3.9), which contains occasional thin, sandy lenses; both are interpreted as overbank and abandonment facies.
- Storey 3: this storey is only accessible (with great care) at the southern end of the outcrop, although it can be viewed across the entire amphitheatre and cuts down into the underlying fine-grained abandonment facies by up to 1.5 m locally (Fig. 9.3.10), with the total erosive relief across the outcrop being c. 5.5 m. Storey 3 is between 5.5 and 10.7m thick and the basal beds show occasional loading into the underlying muds. Cross-stratification produced by unidirectional sand dunes is more prevalent in this storey than in those below, with a predominant flow direction to the N-NE, but the internal geometry of the beds is quite variable. The lower parts of Storey 3 in the south of the outcrop possess conglomeratic lags, and several of the beds are low-angle and possibly represent accretion surfaces on the edges of bars. At the top of the sandstones of Storey 3, the upper surface of a partially preserved dune form is present (Fig. 9.3.10 and in foreground of Fig. 9.3.11) with planar cross-stratification 0.5m thick. Laterally, this dune pinches out and in its place the sandbody is capped by a bed with a very irregular top surface containing numerous large fragments of compressed woody material including large trunks of Lepidodendron. Above this irregular surface, a laminated silty mud package up to 2.9m thick and 35m across drapes onto and infills the irregular topography (Fig. 9.3.11). This infilling fine-grained bed also shows ripple cross-lamination, load structures and low-angle faults with small offsets and a slight rollover. This surface and these overlying sediments represent the predominantly fine-grained infill of an abandoned channel.
- Storey 4: the base of this storey is again highly erosional into the underlying sediments (Figs 9.3.10 and 9.3.11), with up to 7.5 m of relief and a maximum thickness of 8.5 m. There are numerous sole structures on the base that show flow towards the WNW and ENE. The basal sandstones of Storey 4 locally contain lenses of conglomeratic material which may only extend a few metres laterally but possess intraclasts of silt and large fragments of woody material. The sandstones of this storey are predominantly parallel laminated, or contain low-angle bedding surfaces. Many beds are difficult to discern and are cut out by minor concave-upwards scour surfaces. The palaeocurrents obtained from foresets here are broadly to the NE, with the bed set boundaries dipping to the WNW and ENE at around 8° when corrected for regional dip. Adopting the methodology of Leclair & Bridge (2001) produces an estimated average flow depth of c. 4.6 m for Storey 4. This storey probably represents the filling of fluvial channels, firstly by a basal lag, then succeeded by deposition upon barforms with low-angle accretion surfaces and associated dunes.
- Storey 5: this erodes down into a thin (< 0.45 m) siltstone that lies at the top of Storey 4 and extends laterally for up to 16.5 m. This siltstone is partially removed by erosion at the base of Storey 5, with up to 2 m of relief on the erosional surface. Storey 5 sandstones reach up to 6.5 m in thickness and are dominated by trough cross-stratification with some parallel-bedded sandstones. Planar cross-stratification occurs mainly at the base of the storey and is replaced by trough cross-stratification, especially at the very top of this outcrop, where the most well-developed trough cross-stratification in the whole of the outcrop is found. These sediments represent deposition from sinuous-crested sand dunes (Williams & Soek, 1993) that have preserved sets up to 0.51m thick, with a mean of 0.27 m. Using the methodology of Leclair & Bridge (2001) yields an average flow depth of c. 4.8 m.

Fig. 9.3.8. A) Panorama of the Trusklieve amphitheatre at Stop 2 outcrop looking east-south-east; B) Facies interpretation of Fig. 9.3.8A, with the principal channel storeys indicated by numbers and the sub-storeys being denoted by Roman numerals and corresponding to those discussed in the text. Red arrows and numbers refer to the position of logs shown in Fig. 9.3.9. Facies descriptions are given in Table 9.3.1.

Fig. 9.3.9. Correlation panel of logs at Trusklieve amphitheatre, Stop 2, with logs 1 to 4 running from north (left) to south (right) – see localities on Fig. 9.3.8B. Note that none of these logs reach the top of the sandbody. Numbers refer to channel storeys as denoted on Fig. 9.3.8B and arrows indicate palaeocurrent directions. Facies descriptions are given in Table 9.3.1.

Fig. 9.3.10. Photomontage of the southern end of the outcrop at Trusklieve (Stop 2) looking north-east. This panel shows the five storeys present, major erosional contacts and the principal facies. Facies descriptions are given in Table 9.3.1.

Fig. 9.3.11. Photograph of the fine-grained channel fill at the top of Storey 3 (Facies Flm/Fls) and erosional base of Storey 4 at the Trusklieve amphitheatre (Stop 2). Facies descriptions are given in Table 9.3.1.
The geometry of these fluvial deposits of the Tullig Sandstone at Trusklieve thus beautifully displays the internal character of a multi-storey sandbody, which comprises five distinct sandbodies that are laterally and vertically erosive into each other and are separated by finer-grained siltstones and mudstones deposited in overbank areas and abandoned channels. The depth of erosion at the base of these individual sandbodies in this amphitheatre exposure ranges from 2 to 7.5 m, and these sediments show a trend to a simpler, and less heterogeneous, internal sedimentary architecture in the upper storeys.
Stop 3: The top of the Tullig Sandstone and overlying transgressive sediments (UTM 446985 m E, 5831170 m N; Map 63, 079301 m E, 154415 m N)
After examining the uppermost storey of the Tullig Sandstone exposed in the amphitheatre, walk approximately 300 m to the south-west to a small, cliff-top exposure (Fig. 9.3.1) at the top of the Tullig Sandstone that displays the overlying mudstones and siltstones. This location also allows views of the Tullig Sandstone in the dramatic cliffs to the south. These cliff-top views show the complex internal geometry of the Tullig Sandstone and the erosional remnants of some of the fine-grained sediments that separate the individual storeys (Fig. 9.3.12). Extreme care should be taken on these occasionally slippery surfaces, especially near the cliff edge.
The top bedding surface of the Tullig Sandstone is well exposed at this locality, revealing it to be intensely bioturbated with many Zoophycos traces (Fig. 9.3.13), often preserved in siderite. Skolithos and Arenicolites burrows are also present and both fish scales and teeth also occur. Directly overlying this bioturbated surface are a few decimetres of dark, shaley mudstone that yield, approximately 0.1 to 0.2 m above the top of the sandstone, small, pyritized shells of bivalves and articulate brachiopods (productids and chonetids) along with gastropods and scaphopods.

Fig. 9.3.12. The Tullig Sandstone viewed from near Stop 3. Note the sharp erosive basal contact of the Tullig Sandstone (yellow arrows), numerous internal erosion surfaces (white arrows) and shales within the sands (yellow arrow labelled ‘s’).

Fig. 9.3.13. Zoophycos exposed on top of Tullig Sandstone at Trusklieve, Stop 3.
The top of the Tullig Sandstone and the marine band thus bear witness to the transgression and initial flooding surface that occurred at the end of Tullig Sandstone times, with the top of the fluvial sandstone being extensively reworked at this locality but with little evidence of any intervening shelf or shallow marine sandstone deposition (but see Stop 4 below). The 15 m of sediments exposed above the marine band are characterised by interbedded siltstones and shales, with many possessing sideritic concretions and bands that suggest the influence of more brackish pore waters. The upper siltstones and fine sandstones at this locality occasionally yield finely preserved Diplichnites tracks. This locality can thus be used to examine the nature of this initial transgression and the first marine band after the Tullig delta had prograded into this part of the basin. If the cliffs to the south are viewed from here, the sediments overlying the Tullig Sandstone can be seen, which show a general coarsening upwards to a very prominent sandstone ledge. This next outcrop forms the final stop for this part of the sequence.
Stop 4: The Tullig transgression and lower Kilkee Cyclothem (UTM 446830 m E, 5831100 m N; Map 63, 079145 m E, 154348 m N)
Proceed approximately 450 m to the south-west along the coast (Fig. 9.3.1) and around the inlet to the south-west of Stop 3, where fine views of the Tullig Sandstone and its erosive basal contact can be gained. Once around this inlet, it is possible in good weather to climb down a slope onto the top of the sandstone that was viewed at the end of the itinerary for Stop 3 (Figs 9.3.14 and 9.3.15). A climb up this steeply dipping sandstone bed, which dips at 40° to the SSE, allows careful access down the outcrop, eventually ending up on the top of the Zoophycos surface on top of the Tullig Sandstone once again (Fig. 9.3.15). From here, it is possible to examine the entire transgressive succession of the top Tullig Cyclothem to the marine band that separates the Tullig from the overlying Kilkee Cyclothem (Fig. 9.3.15).

Fig. 9.3.14. The package of transgressive sediments that lies above the Tullig Sandstone at Trusklieve. This view is taken from the inlet to the south-west of Stop 3 and shows the sediments detailed at Stop 4.

Fig. 9.3.15. Log of the transgressive sediments that lie above the Tullig Sandstone at Stop 4, Trusklieve. The top of the Tullig Sandstone is reworked by extensive Zoophycos and the transgressive package consists of a broad coarsening-upwards sequence that shows increasing evidence of oscillatory flows towards its top. The uppermost siltstone is capped by a cemented horizon with marine fauna and then overlain by black shales with goniatites and the R1b3 marine band.
The upper Tullig Sandstone at this locality possesses an undulatory upper surface, with the presence of hummocky-type cross-bedding (Fig. 9.3.16), showing that in the initial stages of the transgression, combined flows were capable of reworking the underlying Tullig sands into new bedforms. Above the Zoophycos surface there is again a thin, dark, mudstone with marine fossils, which then passes vertically into siltstones, with individual siderite concretions as well as thin, more continuous, beds of siderite. The overlying 20 m of interbedded shales and siltstones progressively coarsen upwards, with the bottom 13.5 m containing scattered siderite nodules and few interbedded thin sands (Fig. 9.3.15). Above this height in the upper half of the outcrop, thin, fine-grained sandstones exhibit the increasing occurrence of symmetrical oscillatory flow ripples, which bear witness to shallowing and an increasing influence of waves. The uppermost sandstones in the outcrop become thicker and internally consist of alternating sands and siltstones/mudstones that display ripples migrating in opposing flow directions (although the majority show migration towards the NE-ENE), symmetrical oscillation ripples at the top of the thin sandstones and well-preserved fine-scale soft-sediment deformation in the form of load casts and small flame structures. These sandstones appear to represent the presence of combined flows or reversing flows with a long period (hours?), with the predominant currents being introduced from the SW-WSW. Also present are chevron-style escape traces and thin lenses of fragmented brachiopod shells that indicate marine conditions.

Fig. 9.3.16. Photograph of bedforms exposed on the reworked top of the Tullig Sandstone at Stop 4, Trusklieve.
This entire succession represents an upward-shallowing marine sandbody with the sediment being increasingly reworked, first by waves and then by unidirectional/combined flows.
A sharp change in lithology from sandstone to shale is found when climbing down from this sandstone ledge and into the gully on the north side of the outcrop (Figs 9.3.14 and 9.3.15), where two marine bands can be traced along the entire gully and represent the maximum flooding surface at the top of the Tullig Cyclothem. The Kilkee Cyclothem is taken to begin above these marine bands. The first of these marine bands is picked out by a surface with abundant slickensides approximately 0.05 m above the marine band (Fig. 9.3.17). The shales around these marine bands contain scattered elongate siderite nodules. The marine bands consist of grey and black shales that contain orthocone nautiloids, Dunbarella, Caneyella, crinoid ossicles and the R1b3 goniatite Reticuloceras aff. stubblefieldi.

Fig. 9.3.17. The top of the Tullig Cyclothem exposed at Stop 4, Trusklieve. A) Slickensides developed just above the marine band, which is shown in B). In B), ‘g’ highlights a large goniatite, ‘fd’ is fossil debris (including crinoid fragments) and ‘s’ points to the slickensides.
Transfer to Excursion 9.4
The coast road south of Kilkee offers a spectacular series of cliff-top vistas that are best viewed whilst driving from the south-west to the north-east. It is, of course, possible to drive in the opposite direction but this will require a lot of looking back over one’s shoulder. From the Trusklieve outcrop parking spot, head back to Trusklieve and turn left at the junction with the tight bend, heading up hill towards the hamlet of Oldtown. Continue on this road and then drive back downhill where you will come to a T-junction. Turn left at the junction and follow the road, where after a few tight turns the road emerges to run parallel to the cliff edge and heads towards Kilkee. Although this chapter focuses on the Tullig and Kilkee cyclothems, this coast road affords superb overviews through parts of the Doonlicky Cyclothem and some of the most spectacular coastal scenery in County Clare. Fully viewing these sections will take approximately 2 hours.
9.4 The Coast Road South of Kilkee
Part of the Doonlicky Cyclothem is seen in the cliffs of the small island of Illaunonearaun near to the start of this coastal drive (UTM 450665 m E, 5833458 m N; Map 63, 083014 m E, 156654 m N; Fig. 9.4.1). The lower part of the cyclothem provides a broad array of often large-scale deformation features, including slumps and growth faults. A prominent sandstone bed, probably the sandstone at the top of a major parasequence, can be clearly seen to have been displaced and foundered into the underlying siltstones (white arrow on Fig. 9.4.1). The siltstones overlying this prominent sandstone also possess sandstone blocks and deformed siltstones (yellow arrows on Fig. 9.4.1) and again bear witness to the substantial soft-sediment deformation in this upper cyclothem. This part of the Doonlicky Cyclothem records prograding slope sediment that was frequently prone to failure and extensive soft-sediment deformation. Like the older cyclothems, the upper part of the Doonlicky Cyclothem also possesses a major, sharp-based, fluvio-deltaic sandstone – the Doonlicky Sandstone. This sandstone is exposed facing the Atlantic Ocean on the west side of Illaunonearaun and thus cannot be seen from this cliff-top viewpoint. However, the thick Doonlicky Sandstone can be seen from a viewpoint at Goleen Bay, 0.8 km to the south (UTM 450120 m E, 5833130 m N; Map 63, 082464 m E, 156333 m N; Fig. 9.4.2). Here, the Doonlicky Sandstone forms approximately the upper one third of the cliffs and possesses a sharp contact with the underlying siltstones (arrowed on Fig. 9.4.2). The lower part of the cyclothem is siltstone and again dominated by an array of large-scale deformation features, including slumps and growth faults.

Fig. 9.4.1. The island of Illaunonearaun as viewed from the coastal road. The cliffs here are c. 48m high. A prominent sandstone bed is displaced and has foundered into the underlying siltstones (white arrow), whilst the overlying siltstones possess sandstone blocks and deformed siltstones (yellow arrows). See online GigaPan image.
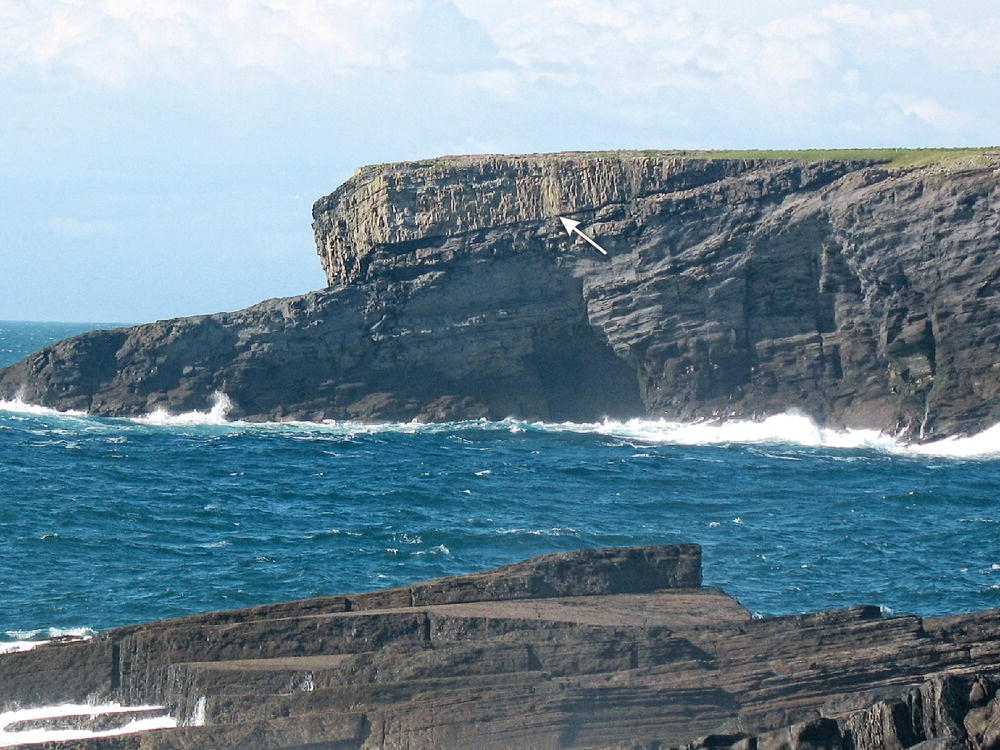
Fig. 9.4.2. The island of Illaunonearaun as viewed from Goleen Bay. The Doonlicky Sandstone outcrops on the Atlantic side of the island, forming the upper one third of the cliffs and possesses a sharp contact (arrowed) with the underlying siltstones. The cliffs are c. 45 m high.
Continue driving north along this road, until the road takes a right bend and you can see a stretch of cliffs at Foohagh Point in front of you (viewpoint at UTM 453083 m E, 5835424 m N; Map 63, 085461 m E, 158586 m N; Foohagh Point at UTM 452950 m E, 5835860 m N; Map 63, 085334 m E, 159025 m N; Fig. 9.4.3; see online GigaPan image). These cliffs reveal another spectacular series of syn-sedimentary faults within the Doonlicky Cyclothem, including an orthogonal section through a pair of back-to-back listric faults at the left (north-western) edge of the cliffs (labelled f1 and f2, Fig. 9.4.3), where the right-hand fault shows clear displacement of the interbedded sandstones and siltstones by several metres, but with little deformation within these beds. On the left side, the fault scarp is infilled by a series of siltstones and thinly bedded sandstones, with no trace of the interbedded sandstones and siltstones. A thin sandstone is seen to overly these two fault zones a little further up the cliff (labelled s1, Fig. 9.4.3), demonstrating the syn-sedimentary nature of the faulting. Another fault is present just to the left side of the sea arch (labelled f3, Fig 9.4.3) but the sense of movement here is reversed as the beds to the left are uptilted to the left. The same sandstone bed noted to the left (labelled s1, Fig. 9.4.3) also drapes over this deformed region, although this sand thins to the right (south-east) side of the cliffs. Finally, two more normal faults are present to the right side of the cliffs (labelled f4 and f5, Fig. 9.4.3), with f4 showing sandstone beds thinning and terminating against this fault on both the hangingwall (labelled s2 and s3, Fig. 9.4.3) and footwall (labelled s4 and s5, Fig. 9.4.3) sides of the fault. A rafted block of sandstone is also present on the down thrown side of this fault (labelled b1, Fig. 9.4.3); and deformed and tilted strata can be seen between f3 and f4 (labelled d1, Fig. 9.4.3). This superb cliff exposure also provides views of a range of smaller-scale deformation associated with these large features described above, developed during progradation of a highly unstable delta slope.
Transfer to Excursion 9.5
From the coast road south of Kilkee, continue to drive north into Kilkee and head towards the West End car park on the south-west side of Moore Bay (UTM 455115 m E, 5837090 m N; Map 63, 087517 m E, 160225 m N; Fig. 9.5.1).
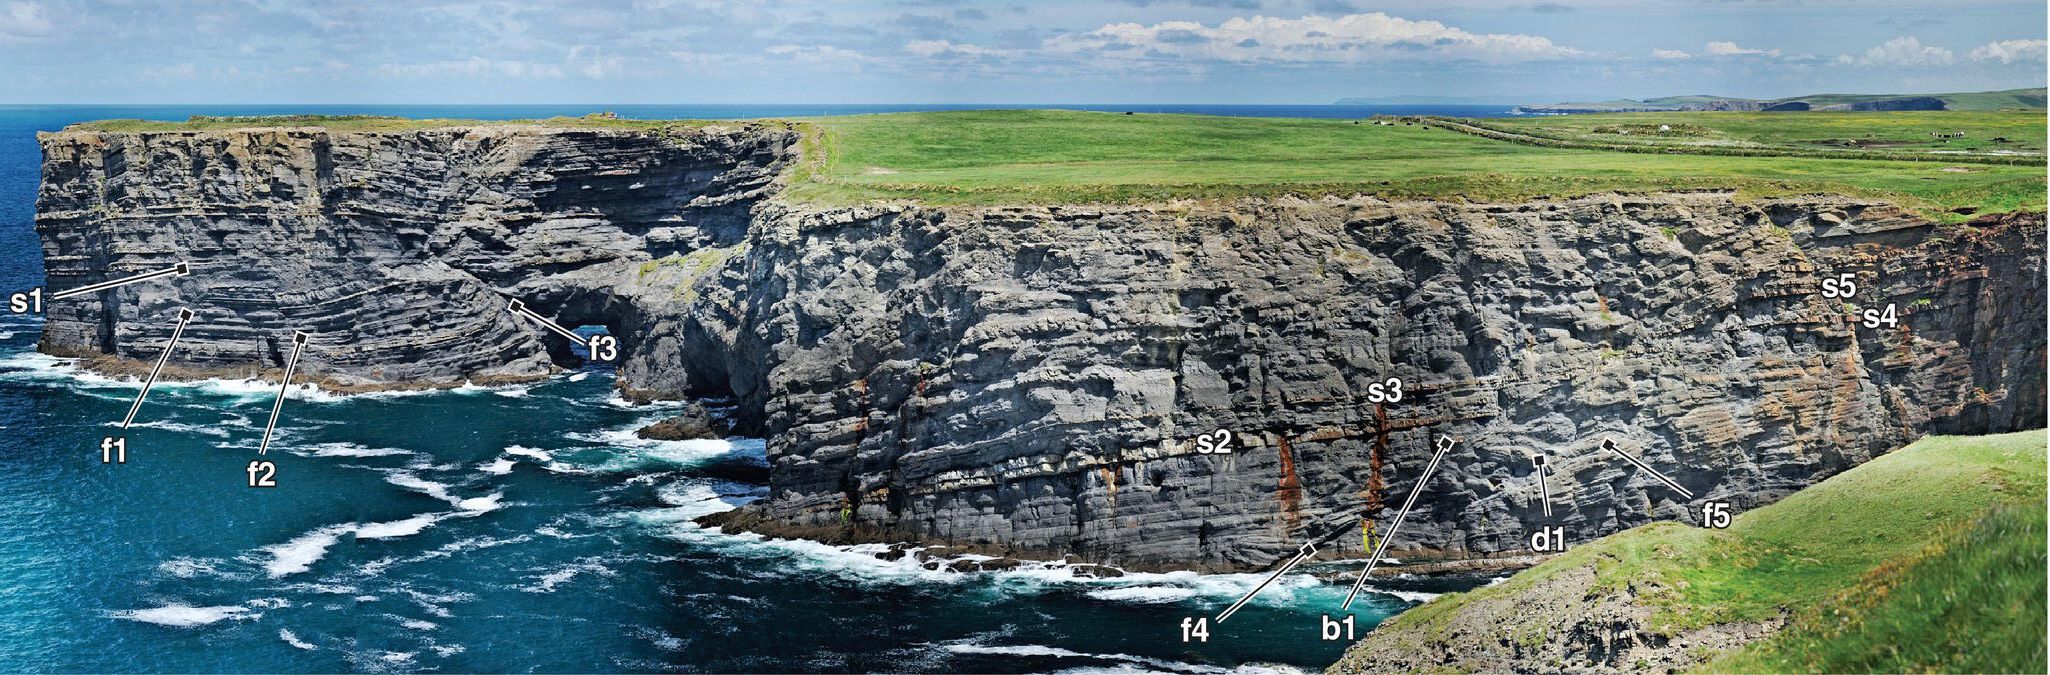
Fig. 9.4.3. Photomontage of the spectacular cliffs at Foohagh Point, which reveal a series of syn-sedimentary faults within the Doonlicky Cyclothem. The cliffs at the far left of the image are c. 57 m high. Five faults are depicted on the photomontage (labelled f1 to f5), together with several sandstone marker beds (labelled s1 to s5), a block of rafted sandstone (labelled b1) and an area of deformed strata (labelled d1). See text for explanation. See online GigaPan image.
Fig. 9.5.1. Geological map of Moore Bay, Kilkee.
9.5 Moore Bay, Pollack Holes, Diamond Rocks and George’s Head, Kilkee
Moore Bay, Pollack Holes and Diamond Rocks
The upper parts of the Tullig Cyclothem are exposed to the north and south sides of Moore Bay, Kilkee (Fig. 9.5.1). These outcrops afford an opportunity to view the uppermost transgressive sediments of the Tullig Cyclothem, including some truly superb exposures of large-scale, soft-sediment deformation. The two localities on either side of Moore Bay are easily reached by road and visitors should use the car parks near West End on the south-west side of Moore Bay (UTM 455115 m E, 5837090 m N; Map 63, 087517 m E, 160225 m N) and at East End near the golf course to the north-east side of the bay (UTM 455990 m E, 5837580 m N; Map 63, 088399 m E, 160704 m N). West End is reached by driving along the road to the west side of Kilkee Bay and parking near the café at Diamond Rocks.
The walk along the south side of Moore Bay from West End towards Knockroe Point Beach allows examination of readily accessible rocks that begin in the upper part of the Tullig Cyclothem and finish in the overlying Kilkee Cyclothem. These exposures to the south side of Moore Bay will take half a day to complete.
Stop 1 (UTM 455035 m E, 5837118 m N; Map 63, 087437 m E, 160255 m N)
The lowest strata consist of a sandstone body, termed the Moore Bay Sandstone (Wignall & Best, 2000) that is exposed close to high-tide level over an extensive stretch of coastline from the Pollack Holes (Gill, 1979) to Duggerna Rocks and to Knockroe Point. Duggerna Rocks are at the mouth to Moore Bay and witnessed the wrecking of the Edmond, a ship taking emigrants to the USA during the Great Irish Famine, on November 19th 1850, with the loss of 98 lives. Access to this section and onto the rocks near the Pollack Holes (a series of natural holes in the rocks with steps into them, where bathing is possible at low tide) is easy from near the café at the car-park, but care should be taken both to observe tide times and to watch one’s footing as the rocks become extremely slippery and hazardous when wet.
The low cliff sections on the foreshore (UTM 455035 m E, 5837118 m N; Map 63, 087437 m E, 160255 m N) adjacent to the café display a series of mouth-bar deposits (Fig. 9.5.2). The cliff trends north-west to south-east and shows a series of decimetre-thick sandstone beds that are arranged in large accretion surfaces that dip and thin markedly to the SE, with the lower surfaces possessing metre-scale swaley/hummocky cross-stratification and with the upper domal surfaces well preserved (yellow arrows on Fig. 9.5.2), often with superimposed oscillatory flow ripples. The outcrops that lie slightly to the NW just above this exposure also show a series of well-bedded sandstones that possess hummocky surfaces (Fig. 9.5.3) and again bear witness to the combined flows in this mouth-bar/shoreface depositional environment. The exposure of the foreshore at Pollack Holes displays a wide range of large-scale bedforms and planform exposure that Gill (1979) documents as showing a series of thin sheet slumps that show movement directions to the SE and ENE (Fig. 9.5.4), comprising three phases of thin sheet slumping and displaying four ‘discontinuity’ (erosion) surfaces (Fig. 9.5.4). However, the exposure is heavily covered with barnacles and these details are difficult to discern.
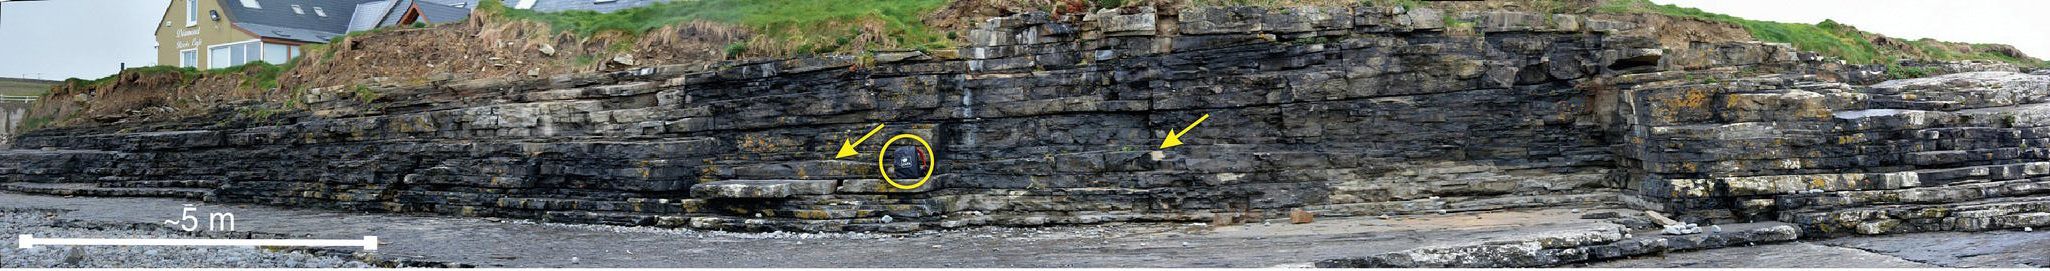
Fig. 9.5.2. Photomontage of outcrop by Diamond Rocks café (Stop 1) showing sandstone with large accretion surfaces that dip and thin markedly to the SE. Undular bedding surfaces possessing HCS are indicated by yellow arrows. Rucksack (height 0.45 m) is circled in yellow for scale. See online GigaPan image.
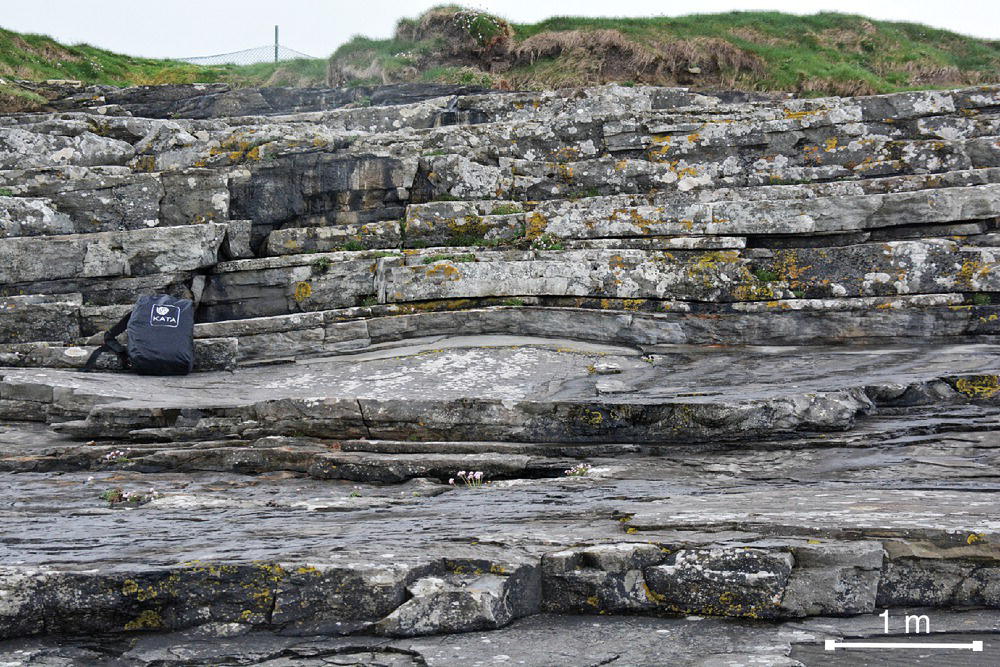
Fig. 9.5.3. HCS exposed on bedding planes above, and to the north-west of, those shown in Fig. 9.5.2.

Fig. 9.5.4. Planform map and section of the features exposed at Pollack Holes
(redrawn from Gill, 1979; copyright Geological Society of Ireland).
Evidence for such slumping is more easily seen by walking carefully along the foreshore (only accessible at low tide) to UTM 454917 m E, 5837150 m N (Map 63, 087319 m E, 160288 m N), to view the outcrop that is a westerly extension of the last exposure. Here, a series of deformational and erosional (?) features are visible in the cliff face, with bedding planes (Fig. 9.5.5) that can be easily accessed. This exposure was described in Gill (1979) and shows a series of small slumps/slides in the upper cliff face with movement directions to the east/south-east, which Gill (1979) speculated could be influenced by the slope generated by nearby mud diapirs (see Stop 3 below). The exposure shows a series of small, 1 to 1.5 m high listric fault surfaces (Figs 9.5.5), above what Gill (1979) termed Discontinuity 2, which dip to the east/south-east and show a series of massive and deformed sandstones between them. Below this, a series of rippled, massive and deformed sandstones infill a depression (labelled ‘D’, Fig. 9.5.5) that is draped by rippled sandstone beds. Gill (1979) documents this as being part of a slump complex that is linked to deformed horizons to the west (Fig. 9.5.4). It is also noticeable here that the western and eastern margins of the depression are very sharp, that the overlying beds drape onto this surface and that the planform expression of the depression is rather curved. Although occurring in association with the deformed slump sheets in which the sediments possessed some shear strength, it may be that this depression is partly erosional in nature, defining a shallow channel associated with topography, due to slumping. It is worthy of note here that the unidirectional palaeocurrents at this site are consistently to the north-east (Gill, 1979; Obrock, 2011) with oscillatory flows orientated north-west–south-east and with some south-west–north-east.
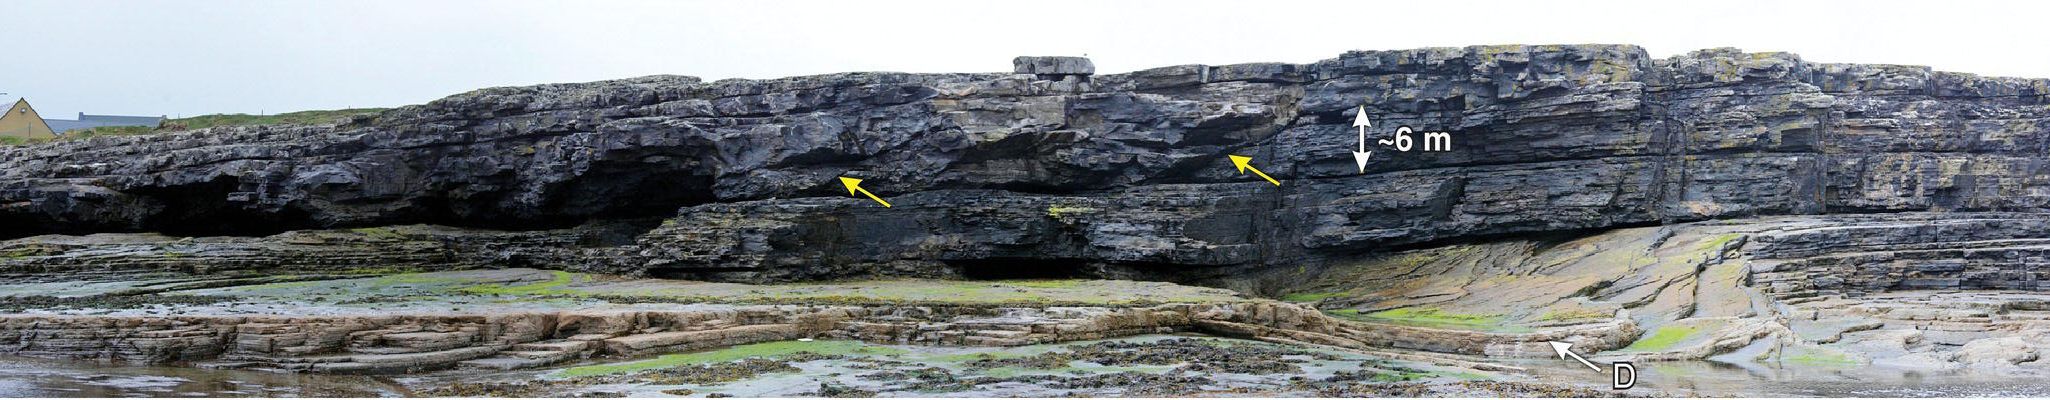
Fig. 9.5.5. Photomontage of the growth fault complex, Stop 1, Kilkee. The yellow arrows point to two, 1 to 1.5 m high listric faults, with the depression discussed in the text being labelled ‘D’. See online GigaPan image.
Stop 2 (UTM 454460 m E, 5836920 m N; Map 63, 086859 m E, 160064 m N)
From Stop 1, rejoin the cliff-top pathway and walk up the hill to a viewpoint where the cliff to the north-east displays some large-scale soft-sediment deformation features. The Moore Bay Sandstone at Kilkee is best known for its series of mud diapirs and a spectacular view of one example is exposed in the cliffs at Knockroe (Fig. 9.5.6), which can be viewed best from the cliff path and by looking back to the east. This cliff, some 30 m in height, shows a cross-section through a domal structure that does not appear to have penetrated to the palaeo-seafloor, except perhaps at one point. The beds at the top of the sequence can be seen to be deformed but drape the diapir and on the right-hand side a chaotic assemblage of blocks is present that bears witness to the entrainment of surrounding partly-lithified sediments as the diapir was rising. The change in dip of the beds on the right-hand side of the diapir also suggests probable deflation of the diapir, which caused drag on the surrounding beds and tilted them downwards at the diapiric contact. If the tide is low, it is possible to walk onto Duggerna Rocks to examine a series of small-scale, syn-sedimentary graben structures in the upper part of the Moore Bay Sandstone. These can be interpreted as the response of the sea bed to doming by non-penetrative diapirs.

Fig. 9.5.6. Mud/siltstone diapir in the upper Tullig Cyclothem, Stop 2, Kilkee. Note the tilting of beds down towards the diapir on the right hand side of the diapir (blue arrow). The yellow arrow depicts the top of the diapir penetrating into the sandstones above, whilst the white arrow highlights the chaotic assemblage of blocks on the right side of the diapir. See online GigaPan image.
Stop 3 (UTM 454337 m E, 5836953 m N; Map 63, 086737 m E, 160099 m N)
From Stop 2, proceed slightly further up the path and look for the steps that descend to Diamond Rocks. After descending these steps, a sequence can be examined that shows a section through the very uppermost Moore Bay Sandstone and the overlying Reticuloceras aff. stubblefieldi marine band. Several features can be observed here:
- Another diapiric intrusion low in the outcrop (Fig. 9.5.7).
- A series of broad, swaley, hummocky and large-scale cross-stratified units, which together with parallel-laminated upper-stage plane beds, show sedimentation on a wave-influenced and storm-influenced coast (Fig. 9.5.8). Some of these features have also undergone later soft-sediment deformation, as evidenced by overlying load structures (Fig. 9.5.8A).
- The topmost metre of the Moore Bay Sandstone at this locality rests abruptly on a surface covered in small, spherical calcite concretions interpreted to be reworked from a palaeosol (Fig. 9.5.9). Large logs showing Lepidodendron bark are also associated with this surface, which is considered to have its origin in ravinement erosion, marking the passage of a zone of shoreface erosion at the start of transgression.
- The topmost Moore Bay Sandstone fines rapidly upward and the succeeding retrogradational package culminates with marine shale. In this transgressive section, wave-rippled sandstones are replaced with intensely bioturbated, muddy sandstone (Zoophycos dominated), then calcareous siltstones with a diverse marine fauna (crinoids, brachiopods, bivalves, gastropods) and finally a thin black shale with the goniatite R. aff. stubblefieldi. This rapid transgression, culminating in deep-water anoxic deposition, marks the boundary between the Tullig and Kilkee Cyclothems.
- A maximum flooding surface represented by the R. aff. stubblefieldi marine band that contains abundant goniatites, Dunbarella, crinoid debris and rounded phosphate clasts.
- The lower shales of the Kilkee Cyclothem show evidence of later tectonic deformation, with thrusting and production of a duplex structure at this locality that is responsible for repeating the lower several metres of the strata.
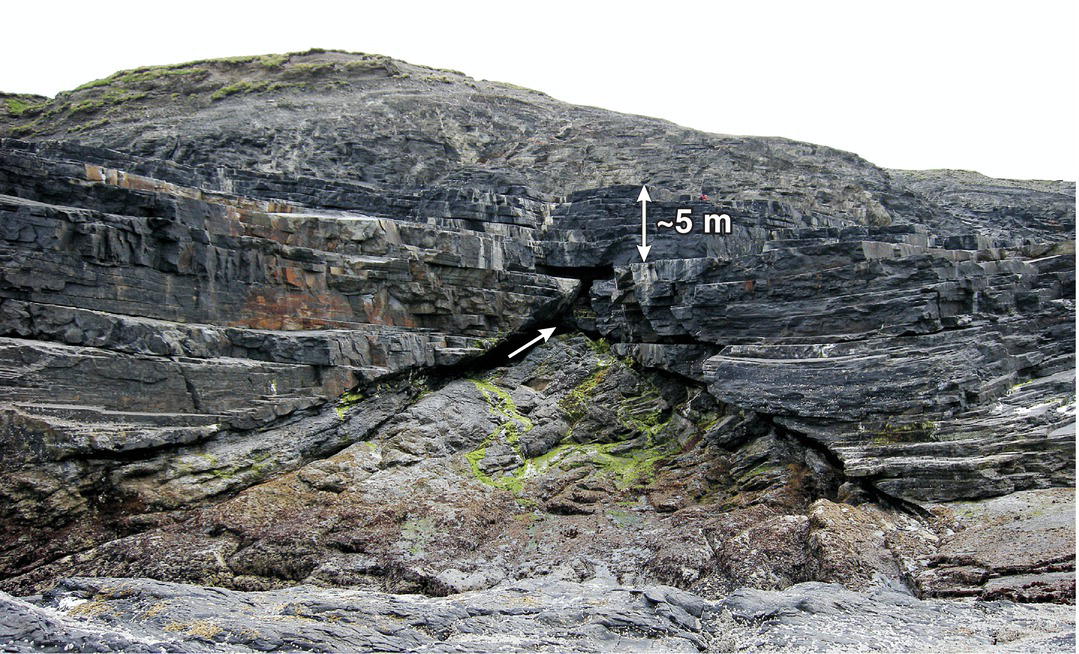
Fig. 9.5.7. Mud/siltstone diapir in the upper Tullig Cyclothem at Diamond Rocks, Stop 3, Kilkee, with white arrow pointing to the top of the diapir.

Fig. 9.5.8. Hummocky cross-stratified beds exposed at Diamond Rocks, Stop 3, Kilkee. A) Small HCS bedforms with wave-rippled tops, lying below a bed with extensive soft-sediment deformation. Person’s feet for scale. B) Undular tops (white arrows) to HCS and low-angle dipping internal accretion surfaces (yellow arrow).

Fig. 9.5.9. Spherical, calcite-cemented concretions (rhizoconcretions?) concentrated on a ravinement surface in the upper part of the Moore Bay Sandstone, Tullig Cyclothem, Diamond Rocks, Stop 3, Kilkee.
From this section, a view to the south-west also shows the coarsening-upwards sequence of the Kilkee Cyclothem that terminates in the thick and erosively based Kilkee Sandstone. The lower Kilkee Cyclothem again records delta progradation and this can be seen in the cliffs beneath West End, Kilkee (UTM 455680 m E, 5837005 m N; Map 63, 088081 m E, 160133 m N), which can be reached by retracing your steps from Diamond Rocks, past the café and car park and heading towards Kilkee town. The erosive basal contact of the Kilkee Sandstone can be examined adjacent to Kilkee beach – take the small concrete steps on your left just before a sharp, right-hand bend in the road. These take you onto a rocky platform that varies in size according to the tide, but plenty can be seen even at high tide. The base of the Kilkee Sandstone is marked by an erosive surface draped in large intraclasts, mostly rafts of shale, some approaching a half-metre in size. This contact is interpreted to be a sequence boundary associated with incised valley generation and subsequent infill by a fluvial system (Hampson et al., 1997). The fluvial nature of the Kilkee Sandstone is suggested by the lenticular geometry of the stacked sandbodies and the local presence of trough cross-stratification and unidirectional palaeoflow indicators (Fig. 9.5.10). However, many of the sandstones appear massive.
The Kilkee Sandstone is overlain by two packages of mudstone-dominated strata that have well-developed palaeosols at their tops. These exhibit a mature soil profile, siderite concretions, abundant rootlets and stigmarian root systems. By this stage in basin development, aggradation had clearly reached base-level. Higher levels in the stratigraphy are often hidden beneath the sandy beach, but in some years a thick succession of black shales (basal Doonlicky Cyclothem strata) can be seen in a narrow outcrop at the foot of the seawall.

Fig. 9.5.10. Large, stacked unidirectional dune cross-sets in the upper part of the Kilkee Sandstone near Kilkee Beach. Rucksack for scale.
Transfer to Stop 4 (UTM 455990 m E, 5837580 m N; Map 63, 088399 m E, 160704 m N)
From West End, head back into Kilkee and take the road around the bay, turning left onto George’s Head Road, where you will pass the Kilkee Aquatic Centre on your right-hand side. Proceed along this road for c. 0.6 km and then park at East End car park, near the golf course on the north side of Moore Bay. These exposures at George’s Head to the north side of Moore Bay will take c. 2 hours to complete.
Stop 4: George’s Head (UTM 455445 m E, 5838238 m N; Map 63, 087863 m E, 161369 m N)
From East End car park, walk along the coastal path to George’s Head, where another diapir at the top of the Tullig Cyclothem is beautifully exposed in both section and planform. At this locality, a mud diapir is seen to intrude through the overlying siltstones and sandstones and breaks through these beds (Fig. 9.5.11). The internal structure of the siltstone is very blocky and structureless, demonstrating the substantial dewatering that has occurred. Various blocks of the surrounding lithologies can be found rafted within this diapiric mud/silt. Some of the sands overlying the diapiric siltstone have also undergone soft-sediment deformation (labelled ‘d’, Fig. 9.5.11). If you continue to walk around George’s Head, the sediments in the upper part of the Tullig Cyclothem can be examined, consisting of a series of sideritic siltstones and deformed sandstones (UTM 455810 m E, 5838480 m N; Map 63, 088231 m E, 161606 m N), with the R. aff. stubblefieldi marine band being located approximately 500 m to the east of the mud diapir in a small bay at UTM 455903 m E, 5838583 m N (Map 63, 088326 m E, 161708 m N).
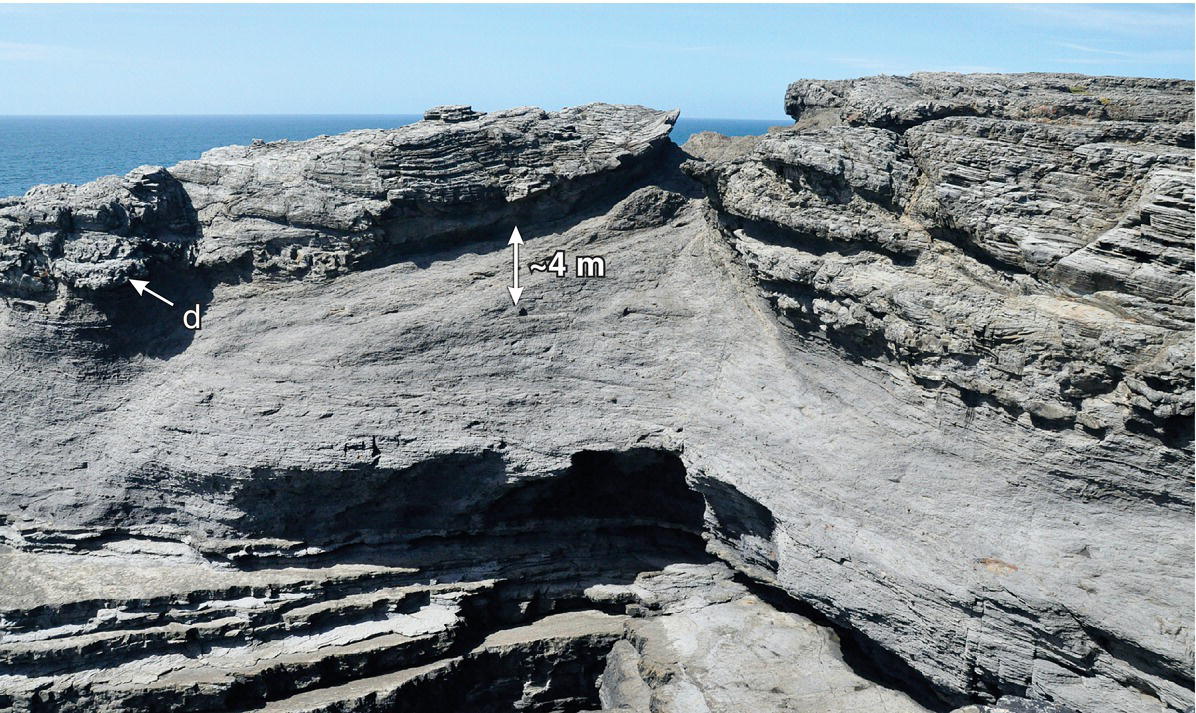
Fig. 9.5.11. Mud diapir in the upper Tullig Cyclothem, George’s Head, north side of Moore Bay, Kilkee. Soft-sediment deformation in the sandstones overlying the diapiric siltstone is labelled ‘d’.
Transfer to Excursion 9.6
From Kilkee, take the N67 north and after c. 10 km you will reach the village of Doonbeg. As you enter Doonbeg, turn left (north) just before a large Catholic church and proceed along this road, around the south-western edge of Doonbeg Bay, then follow the road up the hill for c. 2 km towards Killard. At the top of the hill, turn right at the T-junction and follow the road downhill towards the beach at White Strand. Park at the car park at White Strand (UTM 462780 m E, 5844385 m N; Map 63, 095287 m E, 167417 m N), where there is a monument dedicated to Pat McDonald, who was born in the nearby village of Doonbeg and won an Olympic Gold Medal in 1912 representing the USA in the men's shot put.
9.6 The Tullig and Kilkee Cyclothems at Killard and Carrowmore Point
The Tullig Cyclothem is exposed in extensive sections of low outcrop on either side of Doonbeg Bay, around Killard to the south and at Carrowmore Point to the north. These outcrops afford an opportunity to examine sections showing both the Tullig Cyclothem and the transition into the overlying Kilkee Cyclothem.
Killard (UTM 462780 m E, 5844385 m N; Map 63, 095287 m E, 167417 m N)
This excursion will begin at the White Strand car park, with a walk to the north-east and north, to examine the wave-cut platforms along this stretch of coast. Some of the exposure, especially that displaying the lower sediments of the Tullig Cyclothem, becomes covered at high tide, and thus it is best to time field study for low tides in this part of the outcrop. The sediments are exposed in a broad syncline in this excursion area and so the guide first describes walking up through the succession and into the core of the syncline, and then walking back down through the repeated stratigraphy on the other limb of the syncline (Figs 9.6.1 and 9.6.2).

Fig. 9.6.1. Image of the Killard area with the major features detailed in the field excursion marked.
Image courtesy GoogleEarth; © DigitalGlobe.

Fig. 9.6.2. Simplified geological map of the Killard area. Inset shows location of Fig. 9.6.10.
The whole section affords a superb exposure through a mouth-bar to fluvial channel sequence, as well as some of the sediments from the end-Tullig transgression at the centre of the syncline. Three broad exposures will be described: 1) the first coarsening-upwards sequence and three overlying parasequences; 2) the Tullig Sandstone; and 3) the overlying sediments that represent the transgression at the top of the Tullig Cyclothem. These three stops at Killard can take a day to view fully.
Stop 1: The first coarsening-upwards sequence and three overlying parasequences (UTM 455445 m E, 5838238 m N; Map 63, 087863 m E, 161369 m N)
From the car park, walk along the footpath that runs along the low cliff top on the south-west side of Doonbeg Bay. The sediments exposed in the adjacent wave-cut platforms (Figs 9.6.1 and 9.6.2) largely consist of a series of massive and bedded siltstones that have occasional thin sandstones within them. As you proceed up-section to the north-east and north, the succession generally coarsens with an increasing abundance of fine sandstones, which eventually display oscillatory flow ripples, marking shallowing of the sequence from sub-wave-base to between fair-weather and storm wave-base (Pulham, 1989). This coarsening-upwards sequence ends in a laterally extensive thick sandstone, herein termed the Killard Mouth-bar Sandstone (UTM 463000 m E, 5844748 m N; Map 63, 095512 m E, 167777 m N; Stirling, 2003; Figs 9.6.3 and 9.6.4). This sandstone shows extensive soft-sediment deformation at its base and possesses a wide range of sedimentary structures and trace fossils, including Lockeia resting traces, on wave-rippled surfaces.

Fig. 9.6.3. The Killard Mouth-bar Sandstone exposed on the south side of the Killard syncline. The figures refer to the heights in the sedimentary log shown in Fig. 9.6.4.
Fig. 9.6.4. Sedimentary log of the Killard Mouth-bar Sandstone exposed on the south side of the Killard syncline. Arrows indicate palaeocurrent directions. See Table 9.3.1 for facies codes and descriptions.
Above the Killard Mouth-bar Sandstone, a small inlet (Figs 9.6.1 and 9.6.2) exposes three smaller parasequences (Fig. 9.6.5; Pulham, 1989) that have been interpreted as recording mouth-bar progradation and relative sea-level fall, but it is unclear if each successive parasequence records a deepening- or shallowing- upward trend. These parasequences contain a wide range of wave and combined-flow bedforms (including HCS) and a variety of shallow marine/shelfal ichnofacies dominated by Asterophycus and Planolites, but also with rare evidence for limulid resting traces. These parasequences represent both mouth-bar progradation within a largely wave-influenced environment and perhaps interdistributary bay-fill sequences in a marine-influenced setting. It is worthy of note that the upper parasequence ends in a dark, organic-rich, shale that contains wood fragments, which suggests this may thus have formed more proximal to the Tullig river channels, perhaps within an interdistributary bay or mud-filled abandoned channel. If this is the case, then the upper parasequence demonstrates a continued shallowing-up in the Tullig Cyclothem.

Fig. 9.6.5. Sedimentary log of wave-influenced bay-mouth sequence, Tullig Cyclothem, Killard
(redrawn from Pulham, 1989, with permission from the Geological Society of London).
Stop 2: The Tullig Sandstone (UTM 462955 E, 5844780 N; Map 63, 095467 m E, 167851 m N)
The third parasequence is sharply overlain by the Tullig Sandstone that forms the distinct promontory at Killard (UTM 462955 E, 5844780 N; Map 63, 095467 m E, 167851 m N; Figs 9.6.1 and 9.6.2). Stirling (2003), from detailed study of both sides of the syncline, recognised two storeys (Fig. 9.6.6) within the Tullig Sandstone at Killard:
- Storey 1 shows well-developed horizontal and low-angle cross-bedding, with the palaeocurrents being consistently towards the NNW. Lateral variation within this storey shows the well-bedded facies to be occasionally interrupted by internal erosion surfaces and conglomeratic lags, which are rich in plant material and deformed mudstone rip-up clasts. Stirling (2003) interpreted these scours and coarser facies to represent flood-related erosion and deposition and perhaps individual channel bases within the storey. Storey 1 possesses less than 0.25 m of erosion at its basal surface and reaches a maximum thickness of 5.1 m, before being abandoned and draped by a laterally persistent, laminated silty mudstone that averages 0.45 m thick (Fig. 9.6.7).
- Storey 2 erodes into the first storey with a relief of up to 4 m and reaches a maximum thickness of 18.2 m on the north limb of the syncline (see below). Internally, Storey 2 is similar to Storey 1, with vertical accretion of facies Sp, Sh and St (Table 9.3.1). The main differences between the two storeys are the lack of conglomeratic facies and reduced abundance of fine-grained facies in Storey 2, compared with Storey 1. Flow depths estimated from the cross-set sizes are approximately 5 to 6 m in Storey 2, with unidirectional palaeocurrents in this storey predominantly to the north- north-east (Fig. 9.6.7). Towards the top of Storey 2 in the Tullig Sandstone at this outcrop, an extensive large-scale deformation horizon is present, with 0.5 to 0.8 m high flame and load structures being present solely within the sandstone. This horizon probably represents seismically-induced liquefaction. The top surface of Storey 2 (Figs 9.6.1 and 9.6.2) represents an abandonment surface, with extensive large-scale stigmarian rootlets, with the fragile tap roots often still visible in situ (Fig. 9.6.8) and shaley coal above (UTM 462644 m E, 5844678 m N; Map 63, 095155 m E, 167712 m N). A thin, bioturbated sandstone and sideritic mudstones lie above this low-quality coal and mark a flooding surface (see Stop 3 below). Fragments of small, pyritized brachiopods are found in the base of these mudstones.

Fig. 9.6.6. Sedimentary log of the Tullig Sandstone exposed on the south and north side of the Killard syncline, detailing sediments in the Killard Mouth-bar Sandstone and Tullig Sandstone. Arrows indicate palaeocurrent directions. See Table 9.3.1 for facies codes and descriptions.

Fig. 9.6.7. Sedimentary log, palaeocurrent roses and magnitude of cross-bed foreset dips from the stacked fluvial channel deposits of the Tullig Sandstone at Killard. Redrawn from Williams & Soek (1993), who demonstrated that only dips in the range of 17 to 35° should be used to reconstruct palaeoflow, as these were in the axial zone of the bedform leeside and in the direction of the palaeocurrent and sandbody elongation. Dips of lower magnitude were associated with the arms of more lunate, three-dimensional dunes and were thus at an oblique angle to the principal flow direction.
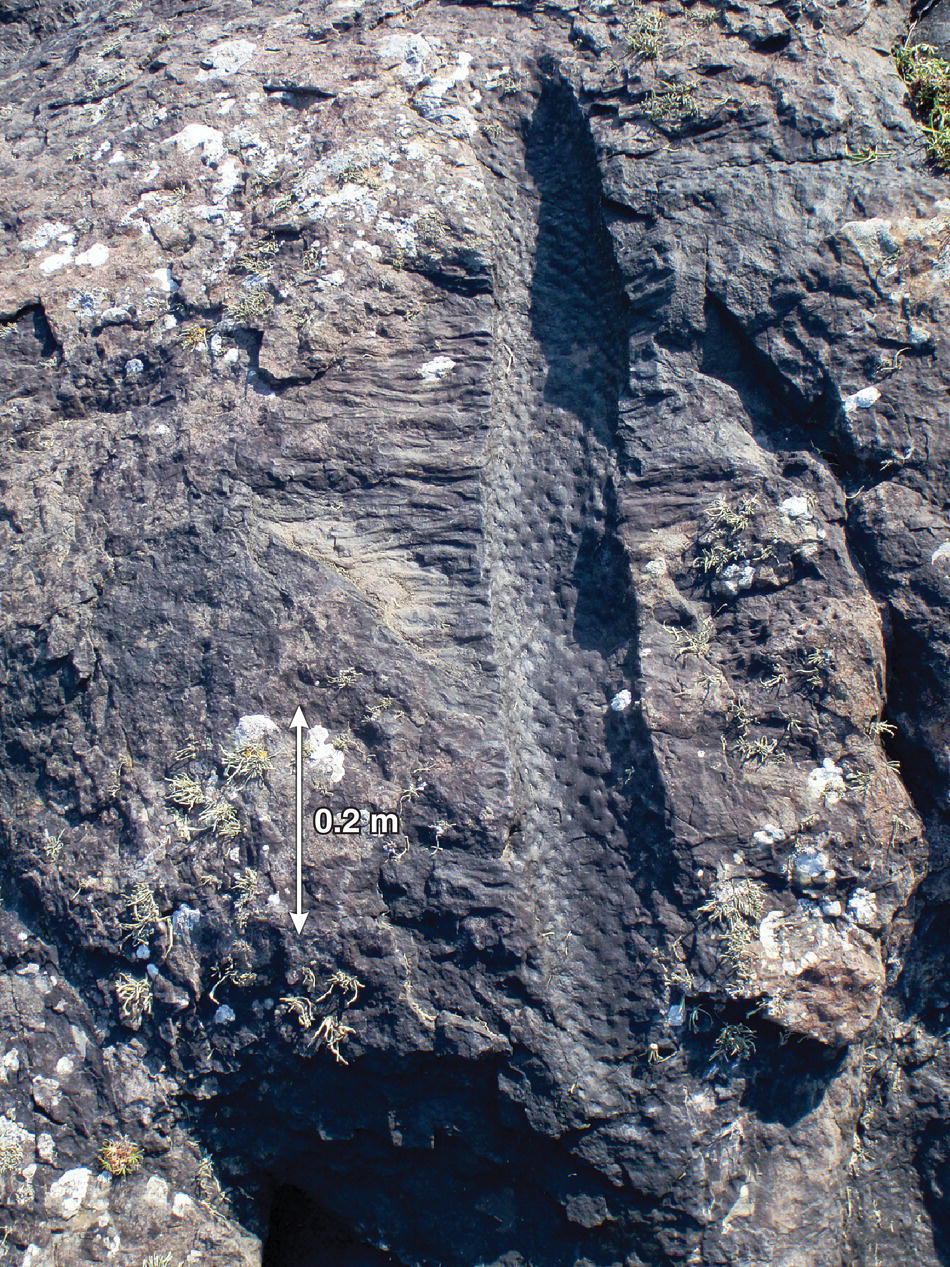
Fig. 9.6.8. In situ Stigmaria roots preserved at the top of the Tullig Sandstone, Killard.
Stop 3: The transgressive Tullig at Killard (UTM 462630 m E, 5844730 m N; Map 63, 095141 m E, 167765 m N)
Above the thin coal and shale that overly the Tullig Sandstone lies a shale (Figs 9.6.1 and 9.6.2) that in its lower several metres contains abundant sideritic nodules, which are often of sufficient number and density to form thin, persistent sideritic bands. Above these beds, the shale loses this siderite and contains occasional thin siltstones and sandstones, which in places possess rare Psammichnites plumeri traces (resembling Scolicia). As you progress up-section to the north, these siltstones are overlain by a sandstone bed that has an extensively loaded base and that passes upwards into a section with abundant soft-sediment deformation (Fig. 9.6.9). This zone also corresponds to the hinge of a Variscan syncline (UTM 462595 m E, 5844790 m N; Map 63, 095107 m E, 167825 m N), with the centre of this NE-plunging syncline being occupied by a complex series of sandstones and siltstones that show a series of growth faults in both planform and section. A map and log of this succession are given in Figs 9.6.10 and 9.6.11, respectively. The throw on these growth faults is between approximately 2 and 10 m. We will examine three principal localities in this area:
- A view from the top of the outcrop looks down onto a large growth fault (UTM 462603 m E, 5844800 m N; Map 63, 095115 m E, 167835 m N; Fault 1, Figs 9.6.10 and 9.6.12) that down-throws to the N/NE and in which the side-view rotational contact and arcuate planform shape can be easily viewed. The beds in the hangingwall of the fault can be seen to be back-tilted towards the footwall. A section through the side of this fault at this locality (Fig. 9.6.12) shows that the sediment was soft when deformation occurred, with sediment being squeezed along the fault planes; and that the surface depression created by the growth fault was infilled by a massive deformed sandstone, which is extensively dewatered with abundant fluid injection features.
- A section through Fault 2 (UTM 462558 m E, 5844786 m N; Map 63, 095070 m E, 167822 m N, Fig. 9.6.13; see Fig. 9.6.10 for location) shows that the beds thicken towards the fault, typical of syn-depositional fault growth.
- Two viewing points at the north-west side of this deformed region (UTM 462540 m E, 5844780 m N; Map 63, 095052 m E, 167816 m N) show a section through the growth fault complex (Fig. 9.6.14). These again illustrate the complex interplay between extension at the back (south) of the fault region (that also develops east-west trending conjugate shear fractures in the siltstones to the south of the southerly growth fault) and a progressive increase in soft-sediment deformation towards the north, where the sequence eventually develops into a series of growth faults. It is also evident that later quartz-veining, associated with the Variscan compression, has exploited these earlier soft-sediment growth faults, with thick quartz veins now lining the original growth fault surfaces.
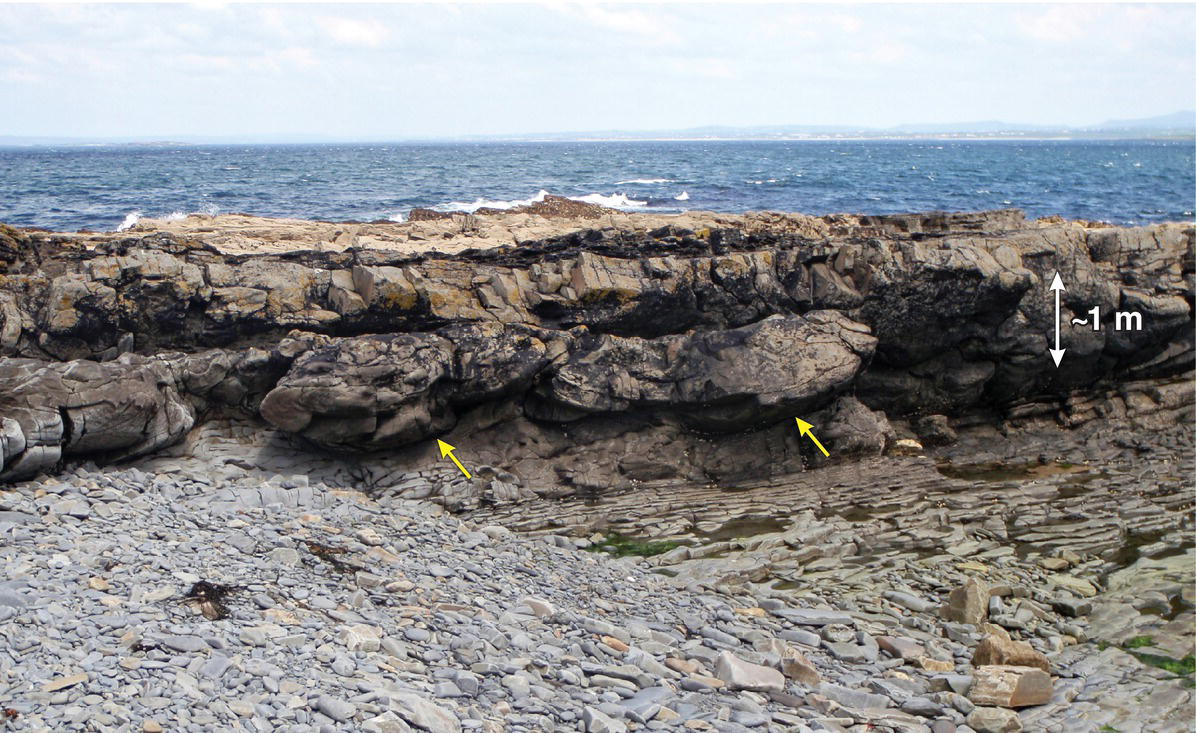
Fig. 9.6.9. Intense soft-sediment deformation at the base of a sandstone in the transgressive Tullig sediments, Killard, with large-scale load structures indicated by yellow arrows.

Fig. 9.6.10. Map of major lithological units and structural features in the centre of the syncline, Tullig Cyclothem, Killard. U and D denote upthrown and downthrown sides to growth faults respectively.
Fig. 9.6.11. Sedimentary log through sediments above the Tullig Sandstone and in the centre of the syncline, Tullig Cyclothem, Killard.

Fig. 9.6.12. Growth fault in transgressive Tullig Cyclothem at Killard. See online GigaPan image.

Fig. 9.6.13. Section through Growth Fault 2 (see Fig. 9.6.10 for location) in transgressive Tullig sediments, Killard. Note thickening of beds towards the fault (yellow arrow), with downthrow to the left (white arrow).

Fig. 9.6.14. Section through Growth Fault 3 (see Fig. 9.6.10 for location) in transgressive Tullig sediments, Killard. Downthrow to the left (white arrows). Person for scale.
This complex zone of soft-sediment deformation has been caught up in the centre of the later Variscan syncline and these fault blocks appear to have reoriented slightly in this later deformation, such that some of the beds show some divergence from the major plunging synclinal axis. A conceptual model for the structural features at Killard (Figs 9.6.15 and 9.6.16) suggests they can be grouped into two broad categories: 1) syn-depositional growth faulting with associated structures; and 2) post-lithification Variscan deformation. Syn-depositional structural features include large listric growth faults, fluid-escape structures and conjugate shear fractures in semi-consolidated mouth-bar sands. Post-lithification structural features include pressure-solution cleavage, pencil cleavage, shear bands with en echelon (sigmoidal) veins, broad asymmetric folding with small-scale roof-thrusts, high-angle reverse faults and brecciated fault zones with prevalent slickensides.
Fig. 9.6.15. Schematic cross-section of conjugate shear fractures, showing the inception and development of growth faults. A) Conjugate shear fractures are initiated, with the principal stresses σ1 (maximum) and σ3 (minimum) oriented vertically and horizontally respectively. Any offset of beds is minimal. B) Offset occurs predominantly along the basinward dipping fracture (fault) and marks the initiation of slumping. C) Progressive deformation leads to fault plane rotation, which defines the listric normal faults found at Killard.

Fig. 9.6.16. Schematic cartoon of the structural evolution of the Killard syncline. A) Development of conjugate shear fractures and initiation of listric faulting during the Namurian. Shear sets and growth faults formed under extension, probably from over-steepening of the distributary mouth-bars. Fluid-escape features along the fracture planes indicate these features are syn-depositional with only minimal compaction. Dashed lines in planform represent strike lines at the time of deposition. B) Further development of faulting (slumping) during the Namurian. C) Wrench faulting and reactivation of listric growth faults during Variscan compression. The black arrow shows the ~ 25° hangingwall rotation due to differential throw along the major reactivated growth faults. Growth strata are evident in the hangingwalls of downthrown (upthrown) fault blocks.
Sedimentation associated with mouth-bars of the Tullig delta resulted in local, gravitational extension that was accommodated by the development of conjugate shear fractures and listric normal faults (Figs 9.6.15A to C and 9.6.16A). Steeply dipping fracture sets (42 to 60°) are most prominent in the upper interbedded silts and sandstones, displaying undular surfaces due to stress refraction between the two lithologies. Fluid-escape conduits follow these fractures, with offset along the shear fractures increasing to the north, ultimately giving way to larger-scale slope failures and gravitational slides (Fig. 9.6.16B). This illustrates the genetic relationship between syn-depositional slope failures and the conjugate fractures present at Killard.
During later Variscan times, the principal stress orientation shifted from vertical to in-plane (planform) as compression began from the south. Structural evidence for this compression at Killard is seen in the weak pressure-solution cleavage and broad folds that characterise the area. At the centre of the syncline, former growth faults appear to have served as planes for later mineral-rich fluid movement during Variscan compression, and potentially became re-activated in the form of high-angle reverse faults (see Fig. 9.6.16C). Evidence for post-lithification fluid flow is shown by secondary mineralization along upthrown sections of the hangingwall blocks.
At the north-west side of the outcrop, you walk out through the other limb of the syncline and thus back down section (Figs 9.6.1 and 9.6.2). As we progress back down section, we pass firstly through shales that become increasingly siderite-rich down-section and then into two coals that are separated by a sandstone — this contrasts with the single coal horizon found on the south-east side of the syncline. Below these coals is the thick Tullig Sandstone (UTM 462400 m E, 5844805 m N; Map 63, 094912 m E, 167843 m N) that again displays an array of large, dune-scale cross-sets with a palaeoflow to the north/north-east. Large in situ Stigmaria roots are abundant on the upper surface of the Tullig Sandstone, where they gently curve across the bedding surface for many metres. The top sandstone surface was thus extensively vegetated. The zone of abundant large-scale soft-sediment deformation present at the top of the Tullig Sandstone on the south-east side of the syncline is again present here. The very north-west side of the outcrop (UTM 462300 m E, 5844815 m N; Map 63, 094812 m E, 167854 m N) affords another excellent view of the erosive contact between the Tullig Sandstone and the underlying parasequences of mouth-bar/interdistributary bay facies and the exposure allows close examination of these features (Fig. 9.6.17).

Fig. 9.6.17. Photomontage of the Tullig Sandstone and underlying mouth-bar sediments on the northern limb of the syncline, Killard. Lower diagram shows facies interpretation. Note the erosive base to the Tullig Sandstone in foreground of image. See Table 9.3.1 for facies codes and descriptions.
Transfer to Carrowmore Point (UTM 466415 m E, 5846512 m N; Map 63, 098953 m E, 169495 m N)
This locality lies across Doughmore Bay from Killard and allows inspection of another section through the upper Tullig Cyclothem, the Tullig Sandstone and into the Kilkee Cyclothem. From the Killard parking area, proceed back to the N67 at Doonbeg and turn north. Follow the N67 for c. 6 km to where the road takes a tight right-hand turn to the east and a small road forms a junction. Take this small road at this junction (the smaller road heads off straight from the main road at the right-hand turn) and follow the smaller road for c. 1 km and then turn left along another small road towards Doughmore and Carrowmore North. After c. 1 km at Doughmore, the road takes a tight turn to the right, but here you should drive straight on towards the coast, where access to the beach and outcrops can be gained across the fields. Parking in the farmyard at the end of this road may be possible after seeking permission from the farmer, from whom permission for access across the fields should also be gained. The locality is best visited at low tide, although the upper parts of the succession here are accessible at all tides. The two stops at Carrowmore Pont will take c. 3 hours to visit.
Stop 1: Carrowmore Point
These Tullig Cyclothem sediments outcrop on the limbs of an ENE-WSW-trending anticline (UTM 466415 m E, 5846512 m N; Map 63, 098953 m E, 169495 m N), the core of which is exposed at Carrowmore Point (Fig. 9.6.18A). Much of the progradational sequence of the Tullig mouth-bar is covered by beach sands, but the erosional contact with the Tullig Sandstone is well-exposed at this location (UTM 466318 m E, 5846519 m N; Map 63, 098856 m E, 169503 m N). The maximum total thickness of the Tullig sandbody here is c. 22 m and its erosive base cuts down into underlying deltaic facies. A photomontage of this locality on the northern limb of the anticline (Fig. 9.6.18B) shows an outcrop c. 150 m in length. Like the Killard section, Stirling (2003) recognised two storeys in the Tullig Sandstone at Carrowmore Point that are separated by a strongly erosive surface (see logs in Fig. 9.6.19).

Fig. 9.6.18. A) Anticlinal exposure of the Tullig Cyclothem at Carrowmore Point. The person at the right of the photomontage (arrowed) is standing at the base of the Tullig Sandstone that is detailed in Fig. 9.6.18B. B) Photomontage of the Tullig Sandstone at Carrowmore Point, showing facies interpretations. Panels run from west to east, top to bottom in the figure. Note erosional base of Storey 2 as it cuts into facies Sp and Sh of Storey 1. See Table 9.3.1 for facies codes and descriptions.
Fig. 9.6.19. Correlation panel of sedimentary logs at Carrowmore Point, showing logs from northern (NE, NC, NW) and southern (SE, SW) limbs of the fold. See Fig. 9.6.18B for log locations and Table 9.3.1 for facies codes and descriptions. Only logs marked with asterisks reach the top of the sandbody. Arrows indicate palaeocurrent directions.
Storey 1 contains very well-developed low-angle and planar cross-bedding with north-easterly dipping internal erosion surfaces and co-set surfaces, denoting flow towards the north-east. Rare conglomeratic lags line the base of this storey, which has a basal erosional relief of c. 1.5 m. Correlation of this basal surface across the two limbs of the anticline suggests it has a relief up to 4 m. This storey reaches a maximum thickness of 2.5 m before being eroded by Storey 2. Flow depths estimated from cross-set thickness here are a maximum of c. 5 m.
Storey 2 is far thicker than Storey 1 and reaches a maximum thickness of 21.7 m, with a basal erosional relief of up to 4 m. It completely erodes out Storey 1 at the east of the outcrop. Storey 2 possesses a range of facies, including massive sandstone with intraformational conglomerates, well-bedded sandstones with horizontal bedding surfaces and finer-grained facies that are interbedded with trough and planar cross-stratified sandstones, climbing unidirectional ripples and some wave ripples. The unidirectional flow indicators show flow to the north-east, as seen in most Tullig Sandstone outcrops (Fig. 9.6.20). Channel depth, as calculated from cross-set thicknesses, is c. 7 m. Within the top 4 m of the sandbody on the northern limb of the anticline there is a return to fine-grained facies, with the occurrence of a silty mud bed ~ 1.5 m thick, which is laterally continuous across the outcrop (~ 80 m). This bed coarsens up from silty mud to fine sandstone and is succeeded by fine-to-medium planar cross-bedded sandstone, which has a thickness between 1.3 and 2.6 m. This final sandy interval is interrupted by thin beds of silty sand (< 20 mm thick), which are characterised by thin layers of current ripples within the sandy intervals, showing current directions to the north and north-east. The top surface of Storey 2 again possesses in situ rootlets and large Stigmaria.
Fig. 9.6.20. Summary of palaeocurrent data for the Tullig Sandstone from various localities in County Clare.

Fig. 9.6.21. Sedimentary log of the upper parasequences of the Tullig Cyclothem at Carrowmore Point.
The Tullig Sandstone at Carrowmore Point has some similarities to the outcrops examined at Trusklieve and Killard, but also significant differences. Storey 1, with its downflow dipping accretion surfaces and well-developed cross-bedding, is similar to Storey 2 at Trusklieve. Stirling (2003) interprets this storey to represent the downstream migration of a bar form within a fluvial channel. The second storey at Carrowmore Point is initially very similar to Storey 4 at Trusklieve, with a strongly erosional base and an upward transition from massive to planar and trough cross-bedded sandstone. The principal differences between the Tullig Sandstone at Carrowmore Point when compared to Trusklieve and Killard are at the base and top of the sandbody. Stirling (2003) reports that the basal contact is locally more erosive at Carrowmore Point (4 m of scour relief) than at Killard (0.25 m) and Trusklieve (2.5 m). Additionally, the top of the Tullig Sandstone at Carrowmore Point shows a more gradual transition to abandonment than at Killard, with interbedded muds, silts and fine sands (facies Flh) interrupting sand deposition. These finer-grained facies are evidence of prolonged periods of abandonment during the later stages of channel evolution, prior to its permanent abandonment. The wave reworking seen within the sandy and silty facies near the top of the sandbody at Carrowmore Point is further evidence of abandonment and could indicate the influence of basinal waves (Stirling, 2003; Obrock, 2011). A 0.5 m thick, low-grade, shaley, pyritic coal is present above this sandstone, which marks the initial flooding surface at the top of the Tullig Sandstone; this thus offers a different character to the commencement of the Tullig transgression to that seen at Trusklieve, but it is similar to that at Killard.
Stop 2
Above the Tullig Sandstone, the sequence shows three distinct parasequences that record an overall transgression and the transition to the Kilkee Cyclothem (Fig. 9.6.21; Obrock, 2011). The first parasequence is 9.5 m thick (Fig. 9.6.21) and commences with a siderite-rich laminated siltstone capped by a thoroughly bioturbated sandstone. The second parasequence is c. 28 m thick (Fig. 9.6.21) and again consists firstly of laminated siltstones, which possess several distinct small slumps. A series of thicker, well-bedded sands lie above these siltstones and show either a massive character, probably due to bioturbation, or well-developed lamination. Parasequence 3, which is c. 11 m thick, begins with 6 m of deformed siltstones (Fig. 9.6.21) that coarsen upward into sandstones that possess wave ripples and Helminthoidea burrows, as well as a range of undifferentiated vertical and horizontal burrows. A dark shale lies directly on top of these sands, with a fossil assemblage including Reticuloceras aff. stubblefieldi, crinoid ossicles and rare orthocone nautiloids. This marks the maximum flooding surface and top of the Tullig Cyclothem.
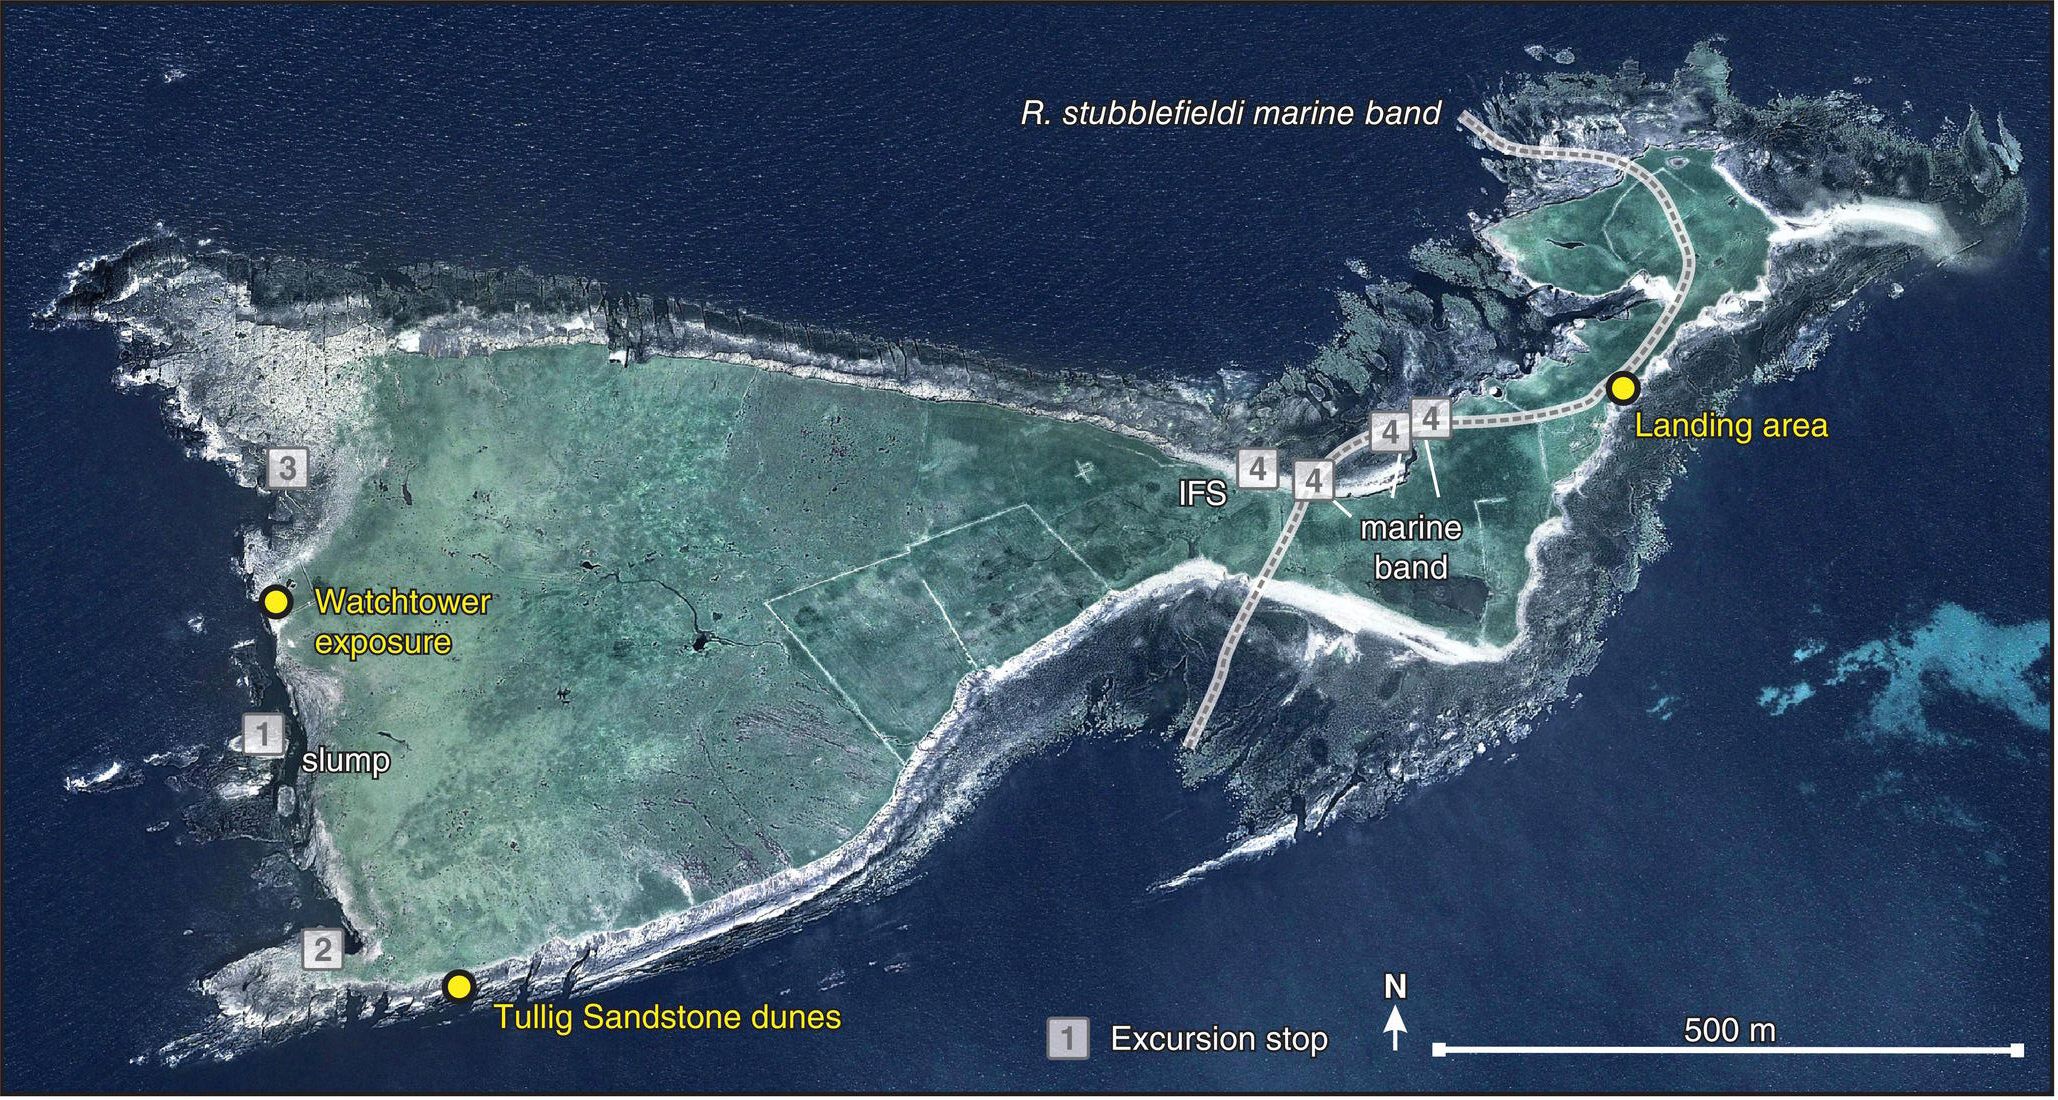
Fig. 9.7.1. Map of Mutton Island showing the stops detailed in the field guide.
Image courtesy GoogleEarth; © DigitalGlobe
Transfer to Excursion 9.7
From Carrowmore Point head back to the N67 and turn north, where after c. 4 km you will meet the junction with the R483. Turn left (north) at this junction and continue for c. 3.5 km until you arrive at the town of Quilty. Seafield Harbour can be reached by turning left at the bend in the road as you approach the seafront at Quilty. Permission should be sought to go onto Mutton Island since it is privately owned (details should be sought in Quilty). The island can be reached in calm seas from boats that can be rented at Seafield Harbour. Information about local fishermen who may be willing to undertake this journey can be obtained in the Post Office or the Quilty Tavern. The journey takes approximately 20 to 30 minutes and it is possible to land on the shingle beaches. As there are now no piers or landing ramps on the island, you may need to resort to wading in shallow water to get onshore. We have successfully and easily landed on the southern shore of the island (at high tide it is easier) near the abandoned houses at UTM 465510 m E, 5851626 m N (Map 57, 098119 m E, 174624 m N; Fig. 9.7.1). Despite these difficulties of access, if the weather is good, you will be rewarded with spectacular exposures in a part of the succession that has received virtually no study, except for the work of the Irish Geological Survey and the map displayed in Gill (1979). This excursion takes a full day and due to boat access should only be attempted in good weather and avoiding windy weather.

Fig. 9.7.2. Photographs of unidirectional flow dunes, Mutton Island, showing: A) planar dune foresets, flow to the right; and B) planform exposure of dune (crest arrowed in yellow) with ripple fans in its leeside. Flow towards observer with ripple migration direction arrowed in white.
9.7 Mutton Island
Mutton Island (Fig. 9.7.1) is located 1.5 km offshore from the town of Quilty (Figs 1.2.1 and 9.7.1) and was inhabited until the mid-1940s, latterly being used to harvest seaweed that was processed at the nearby Seafield Harbour at Quilty. The remains of several houses are still present near the south-east coast of the island and there is a Spanish graveyard in the middle of the island. Here, sailors from the ship Sao Marcos are buried, a ship that was part of the Spanish Armada and ran aground off Mutton Island in 1588 (Ancient Origins, 2015). The island allegedly derived its name from sheep carried aboard this ship and brought ashore, although it is uncanny how the planform shape of the island also resembles a leg of mutton!
Mutton Island comprises an easterly plunging anticline, with its axis running c. W-E along the centre of the island. The beds on the south of the island dip towards the south, whilst those on the northern Atlantic shores dip gently to the north (Fig. 9.7.1; Gill, 1979). The plunge results in the youngest sediments (of the Kilkee Cyclothem) being present at the east end of the island. The outcrops on Mutton Island display the upper part of the Tullig Cyclothem, with extensive exposures of the Tullig Sandstone, the marine band at the top of the Tullig Cyclothem and the deformed sediments of the lower Kilkee Cyclothem. Four locations are detailed below but the perimeter of the island has excellent exposure and displays many sections, principally through Tullig mouth-bar sequences and Tullig Sandstone on the south, west and north-west shores and especially around the higher cliffs on the west and north-west sides.
Stop 1 ( UTM 464345 m E, 5850995 m N; Map 57, 096944 m E, 174009 m N)
After landing on the foreshore, proceed towards the 19th Century watchtower at the western end of the island. The southern edge of the island provides an excellent walk along a series of sandstones that lie within the Tullig Cyclothem, with exposed sandstones around UTM 464345 m E, 5850995 m N (Map 57, 096944 m E, 174009 m N; Fig. 9.7.1) displaying large-scale trough cross-stratification within the Tullig Sandstone and beautiful planform exposures of dunes with steep planar foresets (Fig. 9.7.2A) and sometimes foresets that have leeside ripple fans (Fig. 9.7.2B).
Head towards the watchtower at the NW of the island until you reach a semi-circular-shaped outcrop, approximately 100 m long, located at UTM 464167 m E, 5851280 m N (Map 57, 096770 m E, 174296 m N; Fig. 9.7.1). This exposure shows a 15 m thick sequence (Fig. 9.7.3) characteristic of an uppermost Tullig mouth-bar and the basal surface of the Tullig Sandstone eroding down into these sediments. The mouth-bar sediments exposed here show a series of large bedding planes that possess a range of sedimentary structures, including: i) small- and large- scale oscillatory flow ripples (Fig. 9.7.4A,B; with flow directions being W-E), with occasional beds showing reversals in flow direction as revealed by opposed foreset directions (towards 90° and 325° (Fig. 9.7.3 at 9.55 m on the log) illustrating longer period reversals of flow); ii) beds that have been extensively deformed by liquefaction (Fig. 9.7.4C); iii) surfaces that possess Planolites, Lockeia and Asterophycus; and iv) on some beds accumulations of large, spherical calcite concretions (Fig. 9.7.4D) that are interpreted to be reworked from palaeosols. The Tullig Sandstone cuts erosively down into these sediments at the northern end of this exposure (Fig. 9.7.5), with shale clasts sometimes occurring on the foresets of cross-stratification in the Tullig Sandstone. The Tullig Sandstone here comprises a series of large cross-sets (Fig. 9.7.6) that show a flow direction towards the north-east.

Fig. 9.7.3. Sedimentary log of Tullig Cyclothem, Stop 1, Mutton Island.

Fig. 9.7.4. Photographs of outcrop at Stop 1, Mutton Island. A) large symmetrical ripples; B) small symmetrical ripples with Lockeia traces (some examples indicated by white arrows); C) soft-sediment deformed horizon (arrowed) and D) spherical calcite concretions.

Fig. 9.7.5. Photograph of the erosive contact of the Tullig Sandstone, Stop 1, Mutton Island. The view is towards the NNW, with the white arrows indicating the erosive base of the Tullig Sandstone and the yellow arrow pointing to the deformed bed shown in Fig. 9.7.4C.

Fig. 9.7.6. Large-scale cross-stratification in the Tullig Sandstone, Stop 1, Mutton Island.
The sediments at this location thus reveal a section through a strongly wave-influenced mouth-bar, which bears many similarities to that at Killard (Chapter 9.6). From this locality, the small island that can be seen to the west of the outcrop has a large upper bedding plane that possesses abundant large-scale rafts of sandstone, sandstone balls and distorted strata set in a mudstone matrix (Fig. 9.7.7). The size of this exposure (c. 80 × 40 m) suggests this deformed horizon probably represents part of a growth fault and associated slump sheet that has been emplaced in this part of the mouth-bar sequence, possibly towards the top of an underlying parasequence, as the sediments above this horizon in the cliff face are noticeably finer grained and silty. The abundance of soft-sediment deformation in these interbedded sands and silts is shown by both large-scale slumps such as this and smaller-scale bed liquefaction and sandstone balls in the outcrop (Fig. 9.7.4C).

Fig. 9.7.7. Slump sheet exposed on the small island near Stop 1, Mutton Island (see location on Fig. 9.7.1). The yellow arrows point to blocks of rafted sandstone within the slump. The width of the field of view is approximately 40 m.
Stop 2 ( UTM 464215 m E, 5851032 m N; Map 57, 096815 m E, 174047 m N)
From Stop 1, walk approximately 250 m to the south, around an inlet and onto the promontory of rock at the SW corner of the island (Fig. 9.7.1), where one can gain excellent views over several distinctive features in this part of the section. If one looks to the north towards the watchtower, two features are of note (Fig. 9.7.8). Firstly, the erosive base of the Tullig Sandstone can be seen in the exposure that lies towards the watchtower (white arrows on Fig. 9.7.8), with the depth of erosion here being c. 2 to 3 m. The lateral equivalent of this erosion surface was viewed in the outcrop at Stop 1 (Fig. 9.7.5). Second, the island directly to the north and in front of you contains a clear erosion surface towards its top, with more planar laminated sands cutting down into underlying siltstones (Fig. 9.7.8). These sands are within the parasequences underlying the Tullig Sandstone and bear witness to the erosive surfaces that can occur in the emplacement of mouth-bar sands and may be associated with growth faults and slumps. To further view this erosion, if the viewer turns to look at the main cliff face to the north-east of the viewpoint, these mouth-bar sands can again be seen in splendid cross-section.

Fig. 9.7.8. Photograph taken from Stop 2, Mutton Island, towards the north and the watchtower. The white arrows point to the erosive base of the Tullig Sandstone, whilst the yellow arrow highlights an erosive surface in the underlying mouth-bar sands.
Lastly, the Tullig Sandstone is exposed in the upper cliff face in the corner of the inlet at this location (UTM 464250 m E, 5851050 m N; Map 57, 096850 m E, 174065 m N). Here, the erosive base of the Tullig Sandstone cuts down into a series of interbedded siltstones of the underlying parasequence. Below these siltstones, a thick mouth-bar sand is present and this can be traced laterally along the outcrop (Fig. 9.7.9), with distinct internal erosion surfaces and beds that thicken and thin appreciably across the outcrop. The siltstones underlying this mouth-bar sand are laterally equivalent to those exposed further north and which form the island that possesses the large-scale slump (see Stop 2). In the Tullig Sandstone at this locality in the corner of the inlet, a series of small channels can be viewed in cross-section that are infilled by intraformational mudclast conglomerates (Fig. 9.7.10) and then overlain by sands.

Fig. 9.7.9. Erosive surface (indicated by white arrow) in mouth-bar sands viewed from Stop 2, Mutton Island. The cliffs are approximately 25 m high.
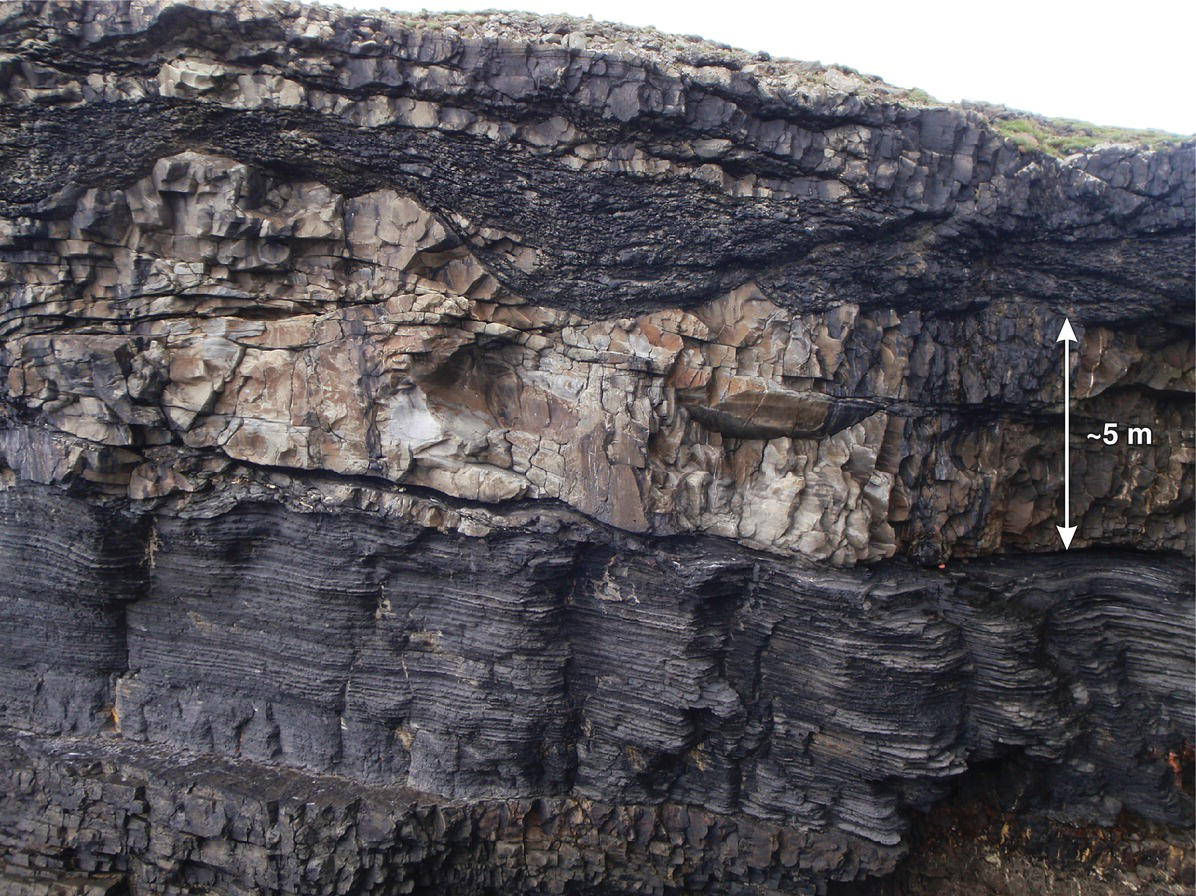
Fig. 9.7.10. Mudclast-filled small channels in the Tullig Sandstone, Stop 2, Mutton Island.
Stop 3 (UTM 464105 m E, 5851395 m N; Map 57, 096710 m E, 1744412 m N)
From Stop 2, walk back north around the exposure of Stop 1 and towards the watchtower. The outcrop immediately to the west of the watchtower (Fig. 9.7.1) displays some large, three-dimensional trough cross-stratification produced by large sinuous-crested dunes and rare casts of large tree trunks. The entire outcrop to the N and NNW of the watchtower is within the Tullig Sandstone and allows access to three-dimensional exposure within these fluvial sands.
Walk north from the watchtower for approximately 80 m and descend the outcrop to a section of c. 13 m in height, which runs north-north-west to south-south-east (UTM 464090 m E, 5851540 m N; Map 57, 096697 m E, 174557 m N). This section exhibits three stacked fluvial channels with large-scale, low-angle, accretion surfaces in the lower and upper parts of the outcrop that dip to the west/north-west (Fig. 9.7.11).

Fig. 9.7.11. Photomontage of channels and accretion surfaces in the Tullig Sandstone, Stop 3, Mutton Island. Labels a to f are discussed in the text, with a sedimentary log given in Fig. 9.7.12. See online GigaPan image.
Walk onto the bedding plane, taking especial care if it is wet, and then down another c. 6 m drop onto a bedding plane that can be accessed at low tide (Fig. 9.7.11). At the base of this section, a marked erosion surface within the Tullig Sandstone can be found, with a mud clast conglomerate lining a basal scour (Figs 9.7.12 and 9.7.13; labelled ‘a’ on Fig. 9.7.11). Above this basal scour, a series of sands possess very low-angle laminae and trough cross-stratification (labelled ‘b’ on Figs 9.7.11 and 9.7.13), probably produced by large, low-angle dunes that eventually (in beds above a marked, large ferroan carbonate concretion; labelled ‘c’ on Figs 9.7.11 and 9.7.13) pass into large dune-scale cross-sets, with flow towards the north-west, north and north-east. The top of these sandstones (at 7 m in the log in Fig. 9.7.12) is the same surface as the notable bedding plane in the outcrop at the base of the main exposure (labelled ‘d’ on Fig. 9.7.11) and shows an erosive relief across the outcrop of several metres, with erosion becoming greater to the NW with incision of c. 3 to 4 m. Low-angle accretion surfaces in the sands above this erosive surface dip to the W/WNW with flow also towards the NW. These sandstones are overlain by a series of siltstones with occasional thin rippled sands (Fig. 9.7.12), with the topmost mudstones and siltstones containing abundant wood fragments, occasional ferroan carbonate concretions and pinching out laterally to the south-east. Above these finer beds, a second series of channel sands erode down into these underlying siltstones and sandstones (c. 11 m on log Fig. 9.7.12), with the erosion surface being very evident in the outcrop (Figs 9.7.11 (labelled ‘e’) and 9.7.12). The base of this sandstone shows flutes and large grooves, with flow direction towards 320°, and the first bed above this surface contains mudstone intraclasts. The beds above show a series of sandstones, which are often discontinuous across the outcrop, and siltstones/mudstones with starved ripples and abundant wood fragments. These beds again gently dip to the NW, with flow direction towards the NE-NW. At the right (southern) end of the outcrop, a third channel is present (Fig. 9.7.11, labelled ‘f’) eroding into these interbedded sandstones and siltstones, with the depth of erosion to the left (north) being c. 2 m. The bed above the erosion surface comprises a basal channel lag of intraformational conglomerate to the south of the outcrop, with large-scale trough cross-stratification in the sandstones above this showing flow towards 350°. Planform exposure of these sandstones displays large-scale trough cross-stratification clearly. The basal conglomerate is eroded into by the overlying sandstones and, to the left (NW), is eventually replaced by these sands.

Fig. 9.7.12. Sedimentary log of Tullig Sandstone, Stop 3, Mutton Island.

Fig. 9.7.13. Photograph of lower section, Stop 3, Mutton Island (see sedimentary log in Fig. 9.7.12). Labels a to c are discussed in the text, with ‘c’ highlighting a large ferroan concretion.
This exposure thus reveals a series of three stacked channels within the Tullig Sandstone, with the thickness of the lower two storeys being c. 8.5 m and 6 m. The channels display large, low-angle accretion surfaces that dip broadly to the north-west and with palaeoflow directions from ripples and dunes giving a mean of 325°. Erosion on the basal contact of these channels at this outcrop is c. 3 to 4 m and the channel-fills generally fine upwards, with abundant wood fragments and occasional thin siderite concretions. These characteristics match well those of the Tullig Sandstone at both Trusklieve and Killard and are interpreted to indicate fluvial channels of relatively low sinuosity, with larger bedforms (dunes) migrating either in the channel thalweg or along the low-angle surfaces of larger bar macroforms. The channels and associated finer-grained sediments do not show any evidence for subaerial exposure or in situ vegetation here, but the abundant wood fragments in these outcrops attest to the nearby presence of large trees. Importantly, these fluvial channels bear witness to the presence of major feeder channels transporting sediment broadly from south to north at this locality, which is the last exposure of the Tullig Sandstone before the outcrops at Liscannor and Furreera Bay to the north. It appears that the Tullig delta at this point still comprised major trunk channels that were feeding a delta fringe to the north.
Stop 4
From Stop 3, walk east along the northern shore of Mutton Island (Fig. 9.7.1), which displays further exposure within the Tullig Sandstone. As you walk east, you are walking up-section, although the outcrop becomes progressively more poorly exposed as the strata dip gently to the east. The boundary between the Tullig Sandstone and the initial flooding surface of the upper Tullig Cyclothem, as also seen at Trusklieve (Chapter 9.3, Stop 4), is difficult to locate on the outcrop due to cover by boulders on the foreshore. However, as you walk east around UTM 465020 m E, 5851585 m N (Map 57, 097628 m E, 174590 m N), the upper 4 to 5 m of the Tullig Sandstone comprises fine sandstones that are interbedded with mudstones and siltstones. The very top portion of the Tullig Sandstone is intensely folded in some areas due to soft-sediment deformation (similar to that at Killard and Diamond Rocks), is bioturbated and contains thick, metre-scale, sandstone beds that contain occasional symmetrical wave-rippled surfaces indicating 060° north-west to south-east flow oscillations, wood fragments, and 0.05 m thick organic-rich beds that contain compressed logs.
The initial flooding surface that marks the beginning of the end-Tullig transgression (UTM 465125 m E, 5851545 m N: Map 57, 097732 m E, 174548 m N) is obscure but is marked by two consecutive, 0.1 m thick siltstone beds that possess Zoophycos. Above this surface, a log of the upper Tullig Cyclothem (Fig. 9.7.14) can be pieced together using partially exposed segments between the covering boulders. The silty mudstones above the flooding surface are dark grey and contain sparse siderite nodules that form along poorly defined bedding planes. The silty mudstones above these nodules are mostly barren, with a 1 m thick deformed siltstone bed being present (Fig. 9.7.14), which is capped by a slickenside surface at 4 m. The silty mudstone coarsens upward to a siltstone, which contains some large siderite nodules and that is overlain by a thin, structureless, fine sandstone. The sediment fines upward to a siltstone, and the sequence is capped by a shale bed containing small R. aff. stubblefieldi goniatites that can be located in the beach (Fig. 9.7.14; UTM 465180 m E, 5851535 m N; Map 57, 097787 m E, 174537 m N) and nearby low cliffs (UTM 465279 m E, 5851592 m N [Map 57, 097887 m E, 174593 m N]; UTM 465301 m E, 5851606 m N; [Map 57, 097909 m E, 174607 m N]). This small succession marks the top of the Tullig Cyclothem, and the sediments to the east of this point lie within the Kilkee Cyclothem.

Fig. 9.7.14. Sedimentary log of succession within the upper Tullig Cyclothem, Stop 4, Mutton Island.