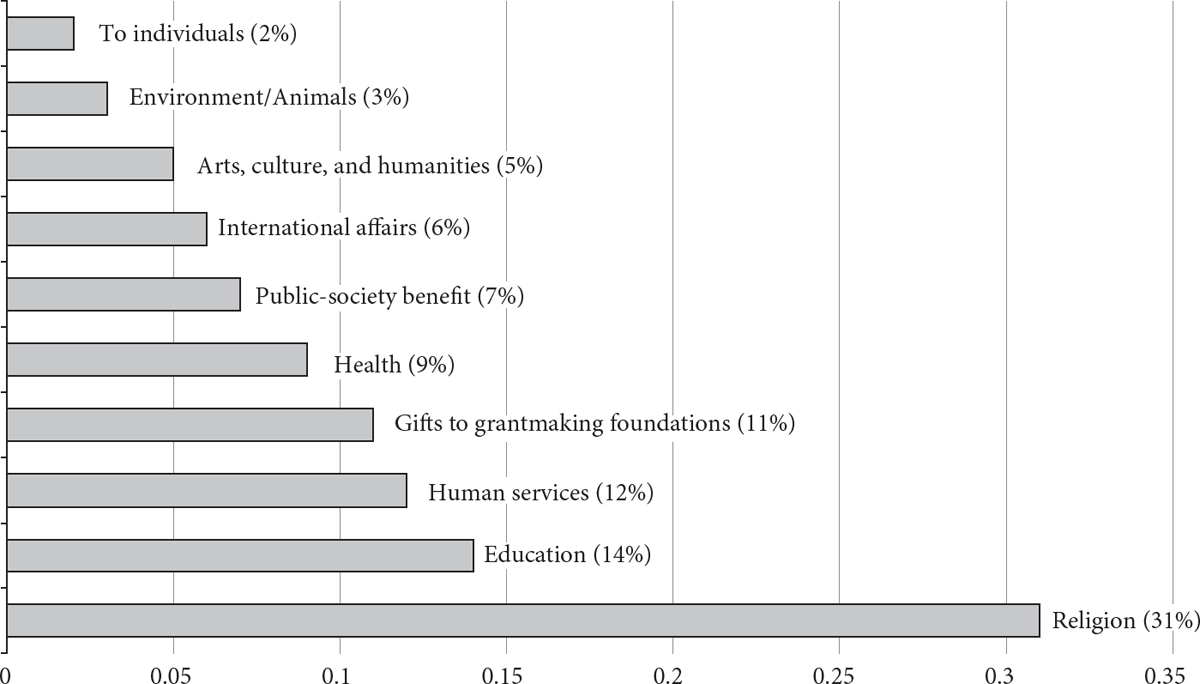
Figure 23.1 Percentage of total contributions by recipient category
Source: Data from Giving USA 2018a.
WHAT INFLUENCES CHARITABLE GIVING?
Pamela Paxton
CHARITABLE GIVING IS CENTRAL TO NONPROFITS. In 2017, $410 billion was contributed to nonprofit organizations, and 70 percent of that giving came from individuals (Giving USA 2018a). Charitable giving is an important source of revenue for nonprofits. Although on average, only 13 percent of nonprofit organizations’ income comes from charitable donations (Salamon, Sokolowski, and List 2004), this average conceals substantial variation. Some nonprofits use donations to supplement fees they charge or government support they receive, but others rely on donations almost entirely (Rose-Ackerman 1996). Charitable giving is strongly supported by and subsidized through the U.S. tax system (Clotfelter 1985; Reich 2010).
In this chapter, I begin by describing the extent of charitable giving, noting differences in giving priorities between wealthy and nonwealthy donors. I also explain that a focus on formal giving typically underestimates total giving. I then discuss three influences on charitable giving. A charitable gift is fundamentally a relationship between a donor and a nonprofit. To understand charitable giving, therefore, we must examine the traits and motivations of individual donors (the supply side), the characteristics and activities of nonprofits (the demand side), and the social, economic, and political forces that are external to but influence the individual–nonprofit relationship. I close by introducing the new movement to make charitable giving more effective, discuss the ways that giving can be improved, and ask whether donors can truly be expected to privilege dispassionate calculations over subjective preferences.
What Are Rates of Charitable Giving in the United States and Where Does the Money Go?
According to the Philanthropy Panel Study through the Panel Study of Income Dynamics, about 55 percent of households donated at least $25 to charity in 2014 (Ottoni-Wilhelm 2017). This percentage has changed over time, rising from 61 percent in 2000 to a high around 65 percent in 2008 and then dropping to 55 percent in 2012 (Meer 2017). The average household donation is $2,514, while the median is $900 (Ottoni-Wilhelm 2017).
These numbers matter because individual giving is by far the dominant source of contributions to nonprofit organizations. In 2017, individual donations made up 70 percent of total giving to charities. If bequests (giving after death as directed in a will) are included, this percentage rises to 79 percent. Apart from dips during recession years, the total amount of giving has steadily increased over time, reaching $410 billion in 2017. (As a percent of the nation’s gross domestic product (GDP), giving remains steady at about 2 percent of GDP (Giving USA 2018a; see also Havens, O’Herlihy, and Schervish 2006:543).) Altogether, individual giving was responsible for $287 billion in contributions to nonprofits in 2017.
These numbers actually underestimate total giving, because they reflect only formal giving and do not consider a wide range of informal giving. Impulsive gifts to a charity cash box or five dollars thrown in a collection plate are not counted. Person-to-person donations to homeless individuals are excluded too. Nondeductible contributions to political or 501(c)(4) organizations are not typically included, and crowd-funded donations are often missed (Soskis 2017). When informal giving is included, estimates of the incidence of giving and the total amount given increase substantially (O’Neill 2001; Rooney, Steinberg, and Schervish 2004; Hall 2001; Soskis 2017). A focus on formal giving may particularly underestimate giving by immigrant communities, some racial and ethnic groups, and those at lower income levels. For example, remittances from immigrants or their descendants to family outside the United States, along with other forms of diaspora giving, can outstrip official development aid (Newland, Terrazas, and Munster 2010; Adelman, Schwartz, and Riskin 2016). And gifts to extended, nonhousehold family members make up a large part of the giving of some communities of color (Stack 1997; Smith et al. 1999). Indeed, an ethnographic study of eight communities of color found that members of these communities expressed a preference for terms such as sharing rather than charity or philanthropy (Smith et al. 1999).
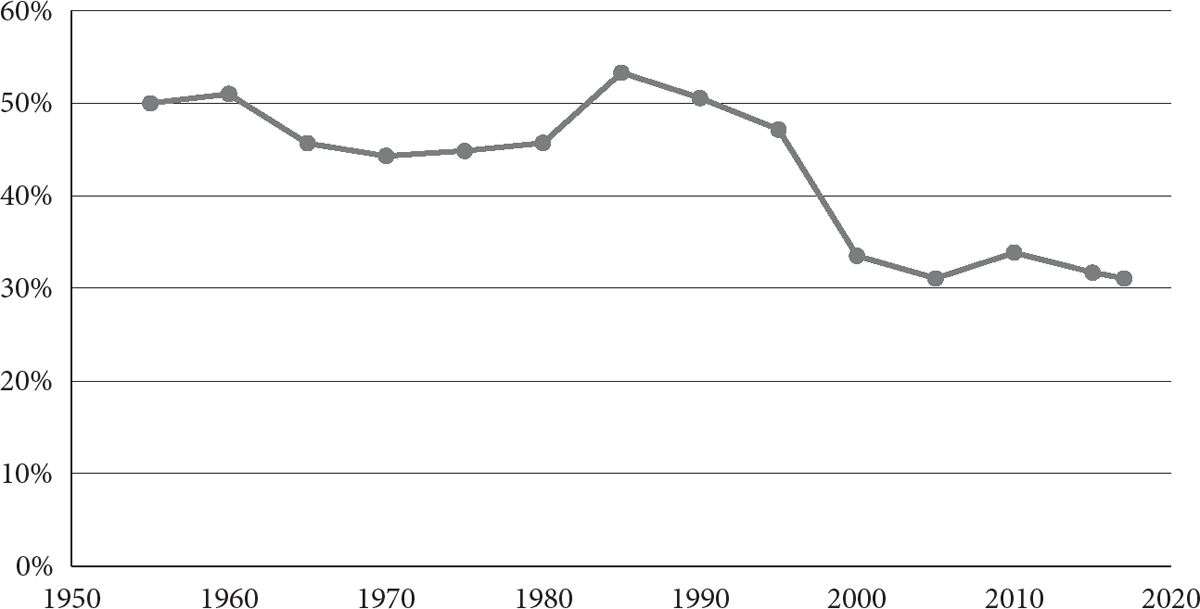
Where do people give? Figure 23.1 shows what percentage of total contributions go to different types of nonprofits using data from Giving USA (2018a). Religious organizations receive the largest proportion at 31 percent of all contributions. The second largest category is education at 14 percent of all contributions. These percentages have changed over time; although the percentage of gifts to education has increased, giving to religion has decreased. Figure 23.2 shows how giving to religion has changed over the last sixty years. From 1955 to 1965, giving to religion was about 50 percent of total giving. This decreased slightly in the 1970s to about 45 percent and remained steady at around that level through 1995. Between 1995 and 2017, the percent of giving to religion dropped to 31 percent. Benjamin Soskis (2017) explains, “Such figures clearly reflect deep-seated cultural trends. For example, much of the early decline in religious giving stemmed from a drop in enrollment in Catholic parochial schools, which had constituted as much as one-tenth of all private philanthropic contributions in 1950. More recently, increased secularization and a declining attachment to religious institutions have likely contributed as well” (see Fulton, Chapter 26, “Religious Organizations,” for an extended discussion of giving to religious organizations).
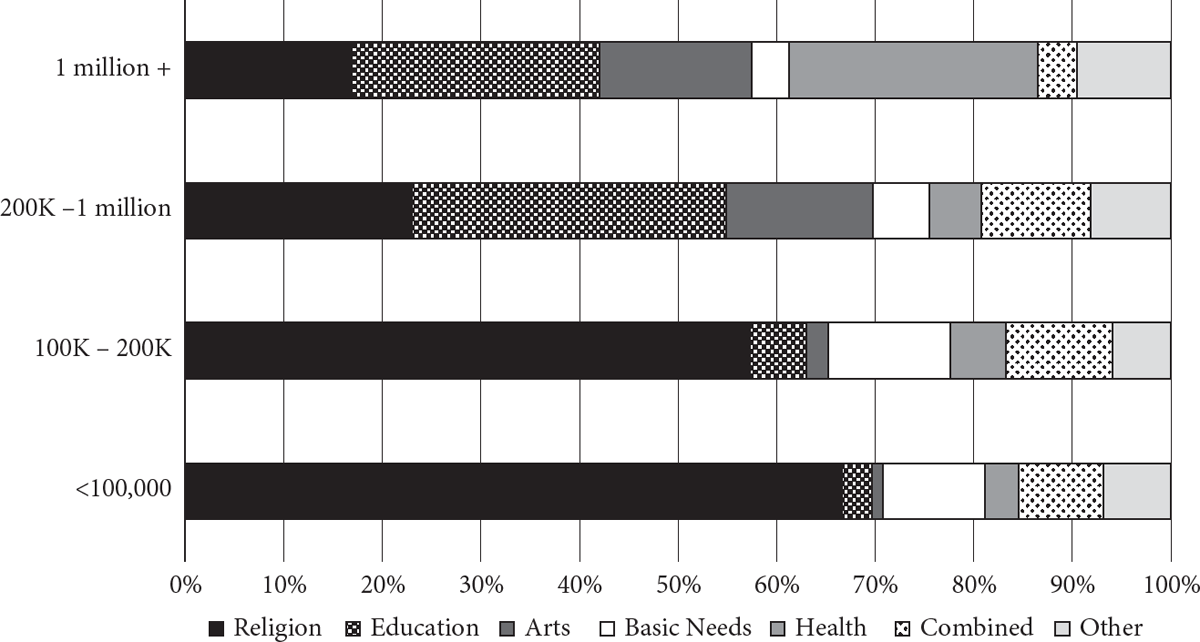
Wealthy and nonwealthy people give to different kinds of organizations. Although religious organizations receive one third of all donors’ contributions, they receive only 12 percent of contributions from high-net-worth donors.1 Generally, the higher a household’s income, the smaller the share of its donations that goes to religion (Rooney et al. 2007). High-net-worth donors are far more likely to give to education, especially higher education (U.S. Trust 2014); this group gave 27 percent of its donations to education. Figure 23.3 shows how different income groups allocated their donations to different categories of nonprofits. Differences in priorities are immediately apparent. For example, higher-income groups give a far larger percentage of their donations to arts and health organizations than other groups do.
Figure 23.1 Percentage of total contributions by recipient category
Source: Data from Giving USA 2018a.
Figure 23.2 Change in the percentage of total contributions to religious groups, 1955–2017
Source: Data from Giving USA (various years).
Wealthy donors’ different priorities appear again in donor-advised funds. Only 11 percent of donations from donor-advised funds go to religious organizations, while 29 percent go to education (Giving USA 2018b). Different giving preferences across income levels matters to the nonprofit sector. Rob Reich (2010) argues that since the U.S. tax code provides greater rewards for giving by the wealthy, it creates a “plutocratic bias” where the interests of the wealthy prevail.
Figure 23.3 Percentage of total contributions going to recipient categories by income group, 2005
Source: Rooney et al. 2007.
High-net-worth donors are also more likely to give to foundations, charitable trusts, and donor-advised funds. In 2013, 28 percent of all giving from high-net-worth households went into these kinds of holdings (U.S. Trust 2014). Since 1978, foundations have tripled their percentage of total giving from 5 percent to 16 percent of total giving, while individual giving has declined as a percentage of total giving from 83 percent to 71 percent (Giving USA 2018a). A focus on funding future giving vehicles such as foundations solidifies the influence of wealthy donors on the direction of giving over time and generations (Reich 2016).
What Influences Charitable Giving?
A charitable gift is essentially a relationship between a donor and a nonprofit. So to understand charitable giving, we need to examine the traits and motivations of individual donors (the supply side), the characteristics and activities of nonprofits (the demand side), and the external social, economic, and political forces that influence the individual–nonprofit relationship. In this section we address each of these explanations in turn.
Supply Side: Donor Traits and Motivations
Why does an individual choose to make a donation to a nonprofit? Individuals may donate to receive some sort of private benefit from their donation. When people donate, they can receive rewards ranging from concert tickets to schooling for their child to a building named after them. They may also receive social acclaim (Becker 1974), entrée to an elite gathering (Rose-Ackerman 1996), or renown for their wealth (Glazer and Konrad 1996; Harbaugh 1998). As Lise Vesterlund (2006:573) explains, “At the most extreme level the private benefit of donating is no different from that of purchasing any other private good.”
But what about those who give to achieve more than private gain? Researchers ask whether people donate from altruism—a desire to increase others’ well-being or the public good (Kolm 1969; Sen 1977)—or because they want to achieve a “warm glow”—a sense of satisfaction just from making the gift (Andreoni 1990; Arrow 1972). Neuro-imaging studies suggest that both motivations exist. The same neural pathways are activated when people make payments to themselves, when they see a charity receive money, and when they choose to donate money to a charity. So people get both altruistic and warm-glow satisfaction from giving to charity (Harbaugh, Mayr, and Burghart 2007). But motivations still vary: some people experience a stronger neural response when they see a charity receive money than when they receive money themselves (Harbaugh et al. 2007). Altruism versus warm glow is a useful way to distinguish two different motivations that both result in charitable giving.2
The most proximate cause of a charitable gift is being asked to give. So when we ask what characteristics make some people more likely to donate than others, the answer is often about which characteristics make it more or less likely that the person will be asked to donate in the first place. In the simplest sense, the larger a person’s network, the more likely it is that he or she will be solicited. But it isn’t just ego-to-alter-network ties that increase solicitation chances: memberships in voluntary associations, religious groups, or other “communities of participation” (Schervish and Havens 1997) embed people in recruitment networks that make them more aware of opportunities to donate and nurture the social connections that facilitate solicitation. And when other people in one’s network are giving, there is social pressure to contribute as well (Frey and Meier 2004; Shang and Croson 2009; Meer 2011; Croson and Shang 2013).
Take involvement in religious organizations. Belonging to a religious organization, attending religious services, and participating in smaller religious gatherings are all associated with higher rates of charitable giving (Independent Sector 2002; see Bekkers and Wiepking 2011b for an extensive review). Although all major religions instruct on morality and teach adherents to care for others, it is not this “conviction” aspect of religion that matters for charitable giving (Wuthnow 1991). More important is that religious groups provide “community”—the organizational context where giving is mobilized (Wuthnow 1990, 1991; Hodgkinson 1990; Jackson et al. 1995). Religious organizations provide “a place to hear about needs in the community, social networks that can be used to recruit volunteers, and subgroups that plan helping activities” (Wuthnow 1990:12). And participating in religious groups isn’t just associated with giving to religious organizations and causes; it’s also associated with secular giving. But it’s not simple attendance that’s associated with secular giving—it’s deeper participation in groups within the church and the networks those groups create (Jackson et al. 1995). A similar dynamic helps explain the often-reported association between participating in voluntary associations and charitable giving (Jackson et al. 1995; Brown and Ferris 2007). Or consider education, which is strongly linked to charitable giving (see Bekkers and Wiepking 2011b for a review). Education increases awareness of need and can lead to increases in income. But more importantly, education also draws people into group memberships that increase the likelihood that they’ll be asked to donate (Brown and Ferris 2007).
Charitable giving generally increases with income. This relationship is often described as a U; giving is highest among both lower- and higher-income people as a proportion of their income. As John A. List (2011) says, “Households with incomes between $20,000 and $40,000 give 5 percent of their income to charity. As incomes grow to about $75,000, gifts fall to 2 percent of income, but then rise slightly to 3 percent.” Studies of high-net-worth donors (incomes greater than $200,000 or net worth more than $1,000,000) suggest that they give more: 7 percent to 8 percent of their income (U.S. Trust 2014). There are several explanations for this U shape. First, as Figure 23.3 shows, lower-income households tend to give a higher proportion of their donations to religious organizations, which may expect their members to give a certain percentage of their income (e.g., 10 percent). Second, income is not the same as wealth. If some “low-income” people are actually wealthy (e.g., retired with high assets), they’re actually donating not from their income but from their accumulated wealth (James and Sharpe 2007). However, John J. Havens and his colleagues (2006) argue that the observed U-shaped relationship between charitable giving and income is a myth generated by survey methodologies that leave out of their calculations the large proportions of low-income households that contribute nothing. They argue, “When these ‘zeros’ are included and the percentage of income is calculated for all households in the sample, the left-hand side of the U virtually disappears. What remains of the uptick at the lower end of the income spectrum can be explained by taking into account household wealth in addition to income” (Havens et al. 2006:545).
Some studies have found a gender difference in giving (e.g., Andreoni, Brown, and Rischall 2003; Mesch et al. 2006); women are more likely to donate then men. Because charitable giving is recorded at the household level, it can be difficult to disentangle gender from other factors. For example, as income and educational level are included in a model, observed gender differences in charitable giving tend to decrease (Wiepking and Bekkers 2012). Men and women may also prefer to give their money to different causes (see Wiepking and Bekkers 2012 for a review). In married couples, men and women make different decisions about how to allocate charitable gifts (Andreoni et al. 2003).
Demand Side: Nonprofit Characteristics and Activities
Nonprofits differ in ways that may make them more or less appealing to different donors. Further, nonprofits actively work to attract donations and retain donors. What kinds of characteristics and activities of nonprofits attract donations?
To begin, a substantial body of research spanning public administration, organizational studies, and accounting has asked which organizational characteristics help nonprofits attract private donations. This largely financial literature predicts nonprofit donations with organizational elements such as administrative expenses, organizational wealth and asset hoarding, and executive compensation (e.g., Weisbrod and Dominguez 1986; Tuckman and Chang 1991; Tinkelman and Mankaney 2007; Calabrese 2011). Occasionally, studies also assess more unusual factors, such as whether a nonprofit is endorsed by a celebrity (Harris and Ruth 2015) or signals an attachment to a community (Ressler et al. 2018). This research is typically based on data that nonprofit organizations submit to the Internal Revenue Service. The key document is Form 990, an annual return that the IRS requires from many nonprofit organizations that contains detailed financial information.
This research has found a number of connections between the characteristics of nonprofits and their donations. Consider employee compensation. Some donors express discomfort with high executive salaries, apparently seeing intrinsic rather than extrinsic motivations as a prerequisite for working in the nonprofit sector (Charity Navigator 2010; see Pallotta 2009 for an impassioned rebuttal to this perspective). Steven Balsam and Erica E. Harris (2013), for example, find that high executive compensation dissuades donors from contributing. Sophisticated donors actively seek out information about executive salaries by looking at Form 990s, whereas small donors respond only when a nonprofit’s compensation levels attract media attention. The response from donors was robust: Balsam and Harris observe that two years after organizations were mentioned in media articles about compensation, they experienced 15 percent lower growth in donations, and growth decreased even more for nonprofits with explicitly charitable missions. And donors aren’t looking only at executive compensation: Wenli Yan and Margaret F. Sloan (2016) find that median employee compensation also suppresses donations.
Consider also nonprofit efficiency—the ratio of program expenses to total expenses. This ratio has been heavily publicized by charity watchdogs such as Charity Navigator and the Better Business Bureau’s Wise Giving Alliance, which criticize nonprofits with high overhead (management and fund-raising expenses). At issue is “the use of efficiency measures by donors in determining which organizations receive individual contributions” (Calabrese 2011: 860). Donors do penalize nonprofit organizations that display less efficiency (i.e., have high overhead costs) with decreased contributions (e.g., Weisbrod and Dominguez 1986; Jacobs and Marudas 2009).
Nonprofits are not passive players in their Form 990 reporting; many have lowered their reported overhead ratios below the guidelines recommended by charity watchdogs. But nonprofits have some choice in which expenses they classify as related to program services, and some may also be responding to efficiency pressures by underreporting their administrative or fund-raising expenses on their Form 990s. Ranjani Krishnan, Michelle H. Yetman, and Robert J. Yetman (2006) examine nonprofits that report zero fund-raising expenses and find that 50 percent of these nonprofits’ websites and 38 percent of their audit statements show evidence of fund-raising activities that they should have reported on the Form 990. They also find that underreporting fund-raising expenses is positively associated with managerial incentives such as higher compensation.
Nonprofits have more strategies available to them. Many nonprofits actively fund-raise; they find potential donors through prospect research, build a solid base of annual contributors, cultivate relationships with major gift prospects, and steward their donors to deepen the relationship after a gift (Sargeant and Shang 2010). Every year, nonprofits spend an average of $100,000 in fund-raising to raise over $750,000 in gifts (Andreoni and Payne 2011). At its core, fund-raising is an attempt by a nonprofit to influence an individual’s decision making about giving.
For decades, nonprofits had only the vague recommendations of professional fund-raisers to advise them about what techniques work to increase charitable donations. But in the past twenty years, a growing body of research is providing concrete data about how donors respond to different fund-raising techniques. Consider a matching grant—a pledge from a lead donor to match other donors’ contributions dollar for dollar or by some other ratio. Intuition might tell us that larger matches (2:1 or 3:1 versus 1:1) would provoke a larger response from donors, but this turns out not to be the case. In a study by Dean Karlan and John A. List (2007), having a match increased the donation rate by 20 percent, but donors who were offered a 1:1 match gave as often and as much as those offered higher match rates. Other studies have confirmed this result (e.g., Karlan, List, and Shafir 2011; Eckel and Grossman 2008; Martin and Randal 2009). Laura K. Gee and Michael J. Schreck (2018) find that threshold matches that require a certain number of donors to be awarded are more effective at raising the donation rate than a 1:1 match. Importantly, using data from the website donorschoose.org, Jonathan Meer (2017) finds that matching money for one project does not crowd out donations to other projects.
Acquiring seed money is another fund-raising technique: nonprofits can announce that one or more lead donors have already contributed some funds. Seed money sends a message to potential donors that the charity is high quality and pre-vetted by experienced donors. Field experiments suggest that seed money can be extremely effective. John A. List and David Lucking-Reiley (2002) told potential donors that 10 percent, 33 percent, or 67 percent of the total needed for the goal had already been raised. More seed money led to both higher donation rates and a higher average size of the gift. Moving from the 10 percent to the 67 percent condition resulted in a sixfold increase in contributions (see also Rondeau and List 2008; Verhaert and van den Poel 2012). Seed money is most effective if donors are told that the seed money will be used to cover administrative expenses so that any additional gift will go entirely to programming (Gneezy, Keenan, and Gneezy 2014).
The findings on matching grants and seed money suggest that donors compare themselves with other donors when they’re deciding whether and how much to give—and that’s exactly what a series of field experiments have found. For example, Bruno S. Frey and Stephan Meier (2004) find that students are more likely to donate to a charitable fund when they’re told that a high proportion of other students have already donated. Hearing about other donors influences not only donation rates but also the amount donated. During a public radio station’s fund-raising drive, Jen Shang and Rachel Croson (2009) told some callers making a pledge about other donations. Callers who were told that a prior donor had given a median-size gift to the station ($75) gave no more than callers who were not told about a prior donor. But when callers were told that a prior donor had given a $300 gift, they gave on average $13 more. Apparently, receiving information about a larger-than-average gift by a prior donor inspired or shamed donors into making larger donations themselves (see also Smith, Windmeijer, and Wright 2015). Social distance matters here; matching the gender of the caller and the prior donor led to higher contributions than when the reference donor and caller were gender-mismatched (Shang, Reed, and Croson 2008). And in a study of alumni giving, being asked to give by a former acquaintance (especially a former roommate) increased both the likelihood of a donation and the size of the gift (Meer 2011).
These field experimental studies provide useful information for nonprofits. Nonprofits can generate higher levels of giving by securing private funds early for seed money or matching grants. But in the case of matching, there is no need to waste the lead donation with an overly generous match. In contrast, securing a seed grant that covers the largest possible percentage of the total need will reap significant benefits. And by making donors aware of other donor choices, nonprofits can create social pressure that will yield higher donation rates and higher returns.
External Forces: Government, Economy, and Social Change
While the characteristics and motivations of each side of the individual–nonprofit partnership are critical to understanding charitable giving, so too are a range of social, economic, and political forces that are external to but influence the individual–nonprofit relationship. To begin with, government regulations and policies may change an individual’s calculus about charitable gifts.
Nonprofits enjoy a favored U.S. tax status—they are exempt from taxes themselves, and most can also receive tax-deductible gifts—because they are thought to be public serving (Frumkin 2002; Hopkins 2011).3 The justification for state subsidization of this sector is that the forgone tax revenue stimulates the production of public goods—that it “produces greater social value than what the state could have produced on its own” (Reich 2010:182). The centerpiece of this state subsidization is the charitable donation tax deduction, first enacted in 1917, that can reduce a taxpayer’s tax burden (Clotfelter 1985).
Economists describe the charitable donation tax deduction as “reducing the price” of a charitable gift. Consider a taxpayer in the 24 percent marginal tax bracket who itemizes deductions. The “price” of a one-dollar donation for this taxpayer is actually only 76 cents because the charitable gift is tax deductible. This makes governmental tax policy quite important for charitable giving. If the government raises marginal tax brackets so that the taxpayer’s marginal bracket changes to 32 percent, the taxpayer now faces a lower “price”—68 cents for a $1 donation instead of the original 76 cents. On one hand, this change in tax policy may increase charitable gifts, since the price of the gift is lower. On the other hand, the taxpayer has just paid more taxes and may therefore feel that he or she has less money to give.
So how do changes in the price of giving affect donations? Findings are quite mixed, both within and across observational and experimental studies (see Vesterlund 2006 for a review). Economists care about the effect of changes in the price because it determines whether charitable contributions should be tax deductible at all. In particular, they are concerned with whether charitable giving is “price elastic.” That is, for the charitable donation tax deduction to be effective, the deduction must increase contributions by more than the government’s cost of providing the deduction. If charitable giving is not price elastic, then the government should not offer the tax deduction and should instead just transfer the tax money it collects to charities itself.
Is charitable giving price elastic? List (2011:169–172) reviews the existing evidence and concludes, “Combining the totality of the evidence . . . I am left with the thought that there is a fair amount of evidence, although not universal agreement, that charitable giving is at least unitary price elastic if not price elastic, especially amongst the high-income classes. This result suggests that if one were interested in stimulating the charitable sector, one avenue is to enhance the tax deductibility of individual charitable contributions” (2011:172).
Another way a government can influence the individual-nonprofit relationship is by providing supplementary funding to some nonprofits.4 Individual giving is not the only source of revenue for nonprofits—government grants are important to many. Of concern, however, is whether government grants “crowd out” giving by individuals. Remember the basic motivations that individuals could have about giving: individuals may donate from “altruism”—the desire to increase others’ well-being (Kolm 1969; Sen 1977)—or they may donate to achieve a “warm glow”—a sense of satisfaction just from making the gift (Andreoni 1990; Arrow 1972). If people are only looking for increases in the public good (altruism) then government grants to nonprofits should crowd out (possibly even dollar for dollar) charitable gifts (Bergstrom, Blume, and Varian 1986). But if donating also gives people a “warm glow,” we should not see crowd-out from government grants.
Although some experiments show crowding out, research that draws on tax or donation data suggests that government grants do not crowd out private giving, or crowd it out at very low levels (e.g., Clotfelter 1985, Kingma and McClelland 1995; de Wit and Bekkers 2016; see Gee and Meer, Chapter 24, “The Altruism Budget,” for a review).5 Evidence that a warm-glow benefit overcomes any crowding out also comes from neural imaging studies. William T. Harbaugh and his colleagues (2007) found that people had a stronger neural response to giving voluntarily than to having money taken from them and given to charity (a taxlike transfer). This suggests that people do feel a “warm glow” when they give. But these neural pathways were also activated in the taxlike transfer, suggesting that altruism also motivates people to give.
Beyond government regulations or policies, the general economic climate is likely to influence the individual–nonprofit relationship. Using a simple regression of the percentage change in charitable giving on the percentage change in the S&P 500, List (2011) finds that 40 percent of the variation in charitable giving can be explained just by changes in the stock market. He finds that a 1 percent increase in the S&P 500 correlates with a 0.19 increase in giving the following year. So, good economic times lead to more charitable gifts. On the flip side, during economic recessions demand for services increases and nonprofits need donations more than ever, but individuals feel constrained in their ability to give (Salamon 2003). Giving USA tracks overall giving to nonprofits over time and finds that giving either levels off or declines during recession periods (Giving USA 2018a:42). However, using the same data, List (2011:161) finds that charitable giving is generally “sticky downwards”: it does not decline as rapidly under poor economic conditions as it increases during good conditions. He speculates that this is due to the social pressure on donors to maintain past levels of giving. Certainly, nonprofits are not passive actors and may step up their fund-raising and stewardship to maintain donor gifts. List’s analysis ends in 2008. In contrast, new research that uses individual panel data to analyze the Great Recession that began in 2008 finds sharp declines in giving during that recessionary period, most likely due to increased economic uncertainty on the part of donors (Meer, Miller, and Wulfsberg 2017).
In addition to governmental and economic forces, a variety of other external forces can influence charitable giving. For example, many observers have noted generational change in giving behaviors, with younger generations giving differently than older ones. In the past, people tended to give to umbrella organizations such as the United Way or Catholic Charities, which decided for them how the funds should be spent. Today, donor advisors argue that new generations wish to pursue “strategic” or “venture” philanthropy, sometimes called the “new philanthropy” (Cobb 2002; Bick 2007; Frumkin 2008; Moody 2008). These donors are more engaged and likely to adopt business principles in making donations. They choose for themselves the recipients of their gifts and monitor the effects of the gift. The rise of new philanthropy has gone hand-in-hand with the rise and increased use of charity aggregator and evaluation sites such as Charity Navigator or GiveWell (but see Szper and Prakash 2011). It also corresponds to the rise of an organizational norm for more metrics, efficiency, and effectiveness (Espeland and Stevens 2008; Barman 2016; Bromley, Chapter 4, “The Organizational Transformation of Civil Society”). On one hand, these new philanthropy donors are empowered, directed, and engaged in their giving. They may be more comfortable with failure and support riskier projects. On the other hand, nonprofits are now being asked to expend time and money demonstrating effectiveness in ways they did not traditionally have to (Snibbe 2006; Brest, Chapter 16, “The Outcomes Movement in Philanthropy and the Nonprofit Sector”).
Another change that nonprofits confront is the growing importance of technology and increasing use of social media. Technology is transforming the sector. A range of smartphone apps and websites now market easy fund-raising to nonprofits, while advocacy organizations use social media to raise awareness and incite public discussion about their issues. The combination of social media attention and online ease of donation can be incredibly powerful for a nonprofit. Consider two recent charitable giving “moments”: the 2014 ALS ice bucket challenge and the 2018 RAICES Facebook viral fund-raising campaign. During August 2014, the “ice bucket challenge” allowed friends to challenge others through social media to dump a bucket of ice water over their heads and donate to the Amyotrophic Lateral Sclerosis (ALS) Association. The challenge helped the ALS Association raise over $115 million in just a few months and increased awareness dramatically. “Over 6 million videos were shared on YouTube, and the videos of celebrities such as Bill Gates received over 20 million views. . . . the Wikipedia page on ALS went from around 3,000 daily views to a surge of traffic peaking on August 21st with over 450,000 views in a single day” (Wicks 2014:479). Similarly, in June 2018, nationwide outrage over the Trump administration’s forced separation of more than 2,500 migrant children from their parents found an outlet: a Facebook fund-raising page set up by a couple in California. Over a two-week period, the recipient of the Facebook fund-raiser, the Refugee and Immigrant Center for Education and Legal Services (RAICES) received $20.5 million in donations and another $5 million through their official website (which crashed briefly because of the increased traffic). This amount was three times their annual budget and more than forty times what the nonprofit raised in the entirety of 2017 (Yaffe-Bellany 2018).
These were impressive viral fund-raising success stories in which social media helped create what we might call a “charitable giving moment.” But many nonprofits make appeals over social media, where competition for attention is intense. Why do some appeals result in a “moment” while others do not? An initial assessment of the ice bucket challenge was that it combined “authenticity, vanity, and a brilliant made-to-go-viral design” (Tucker 2014). RAICES likely benefited from a “first mover” advantage; in other words, its fund-raiser provided an early outlet for an upset and angry citizenry. The power of social networks is on display in both examples. The Facebook fund-raiser automatically linked to existing social networks, while the ice-bucket challenges worked through nominations of friends. In each case, not only did donors’ Facebook friends and Twitter followers see the video or donation, but their social network’s social network saw it too.
Researchers and observers are only beginning to understand how new forms of memetic communication matter for nonprofits. When does an appeal culturally resonate? As Christopher A. Bail (2016b:281) explains, “cultural resonance” is the idea that “organizations will be more likely to generate the momentum necessary for a social movement if they produce discourses that fit, or resonate, with the way people understand the world around them.” Advocacy organizations that find ways to resonate or bridge to other issue areas create social media conversations that bring in more people (Bail 2016a, 2016b). Incentives matter too in encouraging donors to share such appeals (Castillo, Petrie, and Wardell 2014). Emotional language and images resonate powerfully for donors (Paxton, Velasco, and Ressler 2019), especially when prior conversation has lacked emotion (Bail, Brown, and Mann 2017). Much remains to be understood before nonprofits can harness the power of technology and social media. However, the enormous text data created by social media, the millions of newly available Form 990 records, and the new analytic tools provided by computational social science suggest more information to come, very soon.
Is Charitable Giving Effective?
Some charitable giving is wasted. Individual donors, foundations, and corporations can make bad choices and fund nonprofits that spend little on programming or that have good intentions but ineffective programs. The most egregious nonprofits can make the news for diverting 96 percent or more of the funds they raise to their for-profit solicitors (often with a name such as “Wishing Well” that closely resembles a legitimate charity like “Make-A-Wish”). But other nonprofits operate under good financials but with programs that do not collect outcome data and have never been evaluated for effectiveness (Molino 2011; Brest, Chapter 16, “The Outcomes Movement in Philanthropy and the Nonprofit Sector”). It’s crucial, therefore, to ask whether donors should try to be more effective in their giving and whether it’s possible for them to do so.
The effective altruism movement was pioneered by Peter Singer (1972, 2010) and argues that donors should take a utilitarian approach to donating; in other words, they should try to produce the most good for the most people with each dollar. Departing from a traditional approach, which advises donors to identify and then fund their passion (e.g., Bronfman and Solomon 2010), effective altruism requests that potential donors be dispassionate, consider every possible cause, and fund those that will do the greatest good (MacAskill 2015). Singer (2010) stresses international giving, using the joined arguments that all lives are equal and that donations are more cost effective in less developed countries.6 Effective altruism, in short, tries to move donors away from “warm glow” or “donor-focused giving” to “recipient-focused giving” (Friedman 2013). A number of nonprofits, websites, and funds have been developed to help donors make better decisions about where to direct their gifts (see Brest, Chapter 16, “The Outcomes Movement in Philanthropy and the Nonprofit Sector”).
How can donors make their giving more effective? There are a wide range of options, each with its own proponents. To begin with, donors are often advised to investigate a charity’s financials, especially its Form 990—the annual return required by the IRS for many nonprofit organizations. In the early days, advice stressed overhead, or the ratio of administrative expenses plus fund-raising to total expenses. Advisors recommended that donors avoid nonprofits with high overhead, variously defined as greater than 10 percent or 25 percent of expenses. But many observers have since argued that a strict focus on overhead causes nonprofits to underfund staff and leadership, avoid evaluating their programs, and put off infrastructure repairs and updates (Gregory and Howard 2009; Pallotta 2009). Better advice is for donors to make use of resources that show how to read a Form 990 (e.g., Institute for Local Government 2010) and one of the many new sites that provide searchable e-filed Form 990s (e.g., ProPublica’s Nonprofit Explorer). With a twelve-page base form (not including additional schedules), the Form 990 is an incredible source of data on nonprofits, including their finances, expenditures, governance, compliance with federal requirements, compensation paid to certain people, and numbers of staff and volunteers.
Another suggested strategy is to consider a gift’s social return on investment. This approach stresses an investment model of philanthropy and works to calculate the ratio of the cost of a nonprofit’s inputs to the value of their outcomes or impact. This can be simple in some cases: If one soup kitchen feeds people for $6.85 per person while another manages $4.25 a person, then, all other things equal, donors may want to maximize their social return on investment by funding the second soup kitchen. Akin to a traditional monetary return on investment, the second soup kitchen produces a greater social return (people fed) for an investment (donation). But in many cases, the benefit is not guaranteed, which makes calculating the benefit/cost ratio far more difficult (Brest and Harvey 2018). For example, a nonprofit that provides job coaching cannot guarantee it will produce a full-time job. So any calculation of benefit would have to include an estimate of the probability of getting a job. The Robin Hood Foundation attempts to “monetize everything” so that social returns on investment can be compared across disparate nonprofit categories. For example, they have calculated the lifetime value of a high school graduation to be $190,000 and of each additional year of college to be $40,000 (M. M. Weinstein and Bradburd 2013). These numbers allow them to compare nonprofits working in quite different areas of education. In the area of health or international development, proponents of maximizing the social return on investment tout the notion of a quality-adjusted life year (QALY), in which a value of 1 represents one year in perfect health. Disparate health interventions can be compared by their costs of creating a QALY (QALY/$).7
Donors can also pay close attention to outcomes and evaluation data provided by nonprofits. At the most basic level, a nonprofit should provide information on its activities and the outputs of those activities. A donor can obtain information about a nonprofit’s activities through written reports, websites, phone conversations, or site visits. For example, the nonprofit that provides job coaching could report the number of people enrolled in coaching and the number of coaching sessions per person. This is a minimum level of reporting that should be expected of most nonprofits (Brest and Harvey 2018). Next-level reporting would include some attention to progress in indicators of outcomes (e.g., short-term effects of activities on recipients’ behaviors, knowledge, or perception) or impact (long-term and aggregate effects of a sustained program, service, or intervention on an overall target population) (see Brest, Chapter 16, “The Outcomes Movement in Philanthropy and the Nonprofit Sector”). For example, a nonprofit may keep records showing that job coaching led to 90 percent of their clients finding and keeping a job for at least six months. A nonprofit may also report declines in unemployment in the community in which they operate to attempt to demonstrate impact.
Unfortunately, however, few nonprofits appreciate the issues of selection that loom large in much of their programming. And many conflate metrics with actual causal impact. Take job coaching: is the fact that 90 percent of a nonprofit’s clients found and kept a job due to the nonprofit’s programming? Or is it due to the social position or motivation of the clients themselves? Is a tutoring nonprofit that reports higher grades for its students the reason for student success, or is it the personal or family characteristics of the students? Though many nonprofit observers have noted these selection issues, few nonprofits take them seriously. Instead, they tend to take credit for all recipient success without considering any counterfactuals. Proponents of effective giving argue that nonprofits must demonstrate cause: that their program caused an observed outcome. They recommend randomized controlled trials (RCTs) as the best method to demonstrate cause. By randomly dividing people into an intervention group (those who participated in some program) and a control group (those who did not participate), nonprofits can argue that any differences between the two groups are due to their programming.
But not every nonprofit can or should undertake RCTs to demonstrate causality, especially those engaged in direct service provision. Does a soup kitchen or clothing closet really need an RCT to demonstrate that it feeds or clothes people?8 Even in the area of direct service provision, however, new approaches are emerging. Some donors are arguing for direct giving based on the success of conditional and unconditional cash transfers in government provision of social welfare (Arnold, Conway, and Greenslade 2011; Hanlon, Barrientos, and Hulme 2010). This approach empowers recipients to choose how to spend donated funds themselves and increases their consumption, food security, and psychological well-being (Haushofer and Shapiro 2016).
So, should donors approach charitable giving dispassionately—maximizing social return or funding only nonprofits with successful RCTs? Can we expect them to? Although a dispassionate observer may direct charitable dollars to do the most good regardless of personal preference, research suggests that donors do not always respond favorably to this approach. Dean Karlan and Daniel Wood (2017) used a field experiment to investigate donor response to information about a charity’s effectiveness. Partnering with Freedom from Hunger, they sent solicitation letters to potential donors. Some recipients got the standard fund-raising letter, which featured a story focused on a beneficiary. Others got that story plus scientific information about the program’s impact. The addition of scientific information had no overall effect on whether people donated or the amount they donated. This information did, however, make an important difference across large prior donors and small prior donors. Large prior donors gave more when they received the scientific impact information, suggesting that they were willing to consider evidence in accord with suggestions from the effective altruism movement. However, small prior donors gave less when they received additional scientific information. Karlan and Wood argue that these smaller donors were motivated largely by warm-glow giving. The scientific information, they speculate, “turned off” these positive emotions by reminding the donors that the effectiveness of charitable giving is inherently uncertain. Without the warm glow, the donors weren’t motivated to give.
Donors simply believe in subjective choice themselves and more than effective altruists do. Jonathan Z. Berman and his colleagues (2018) find that when given the choice to donate across charitable fields, individuals feel that donors have subjective preferences that can override evaluations of effectiveness. People choose less effective charitable options in favor of their subjectively preferred category and also judge others who also choose subjectively less harshly. But within charitable cause areas, people do respond to effectiveness (Caviola et al. 2014). Because effective altruism can be powerful within charitable cause areas and among large donors, it’s an important direction for the field, even if it remains a small part of charitable giving. Meanwhile, proponents of effective altruism may get more traction with other donors if they abandon cause neutrality and allow people to donate passionately across causes but effectively within causes.
The landscape of charitable giving has changed over the past few decades and will continue to change going forward. Understanding the nonprofit–donor relationship, how external forces shape that relationship, and how giving can be improved will allow both donors and nonprofits to increase charitable giving, plan for negative external shocks, and better allocate charitable gifts to produce the most effective outcomes.