This chapter provides an overview of HTML5 Canvas, which is a technology that enables you to write graphics programs that draw directly to a part of a Web page. HTML5 Canvas supports various APIs for rendering 2D shapes with an assortment of graphics effects. Although there are many online Canvas-related and CSS3-related tutorials available (which you can confirm via a quick Internet search), few of them provide code examples of using both HTML5 Canvas and CSS3 graphics effects.
As you will see, various code samples in this chapter contain (sometimes striking) combinations of HTML5 Canvas, CSS3 graphics, and CSS3 2D/3D animation effects that you are unlikely to find in any online resources or topic-related books. These code samples provide a starting point for you to create your own visually compelling graphics effects.
In addition, most of the sections in this chapter start with the syntax of the APIs that are used in the associated code listings, partly because the code samples contain a lot of details and also illustrate multiple concepts. So, even though this is an “introductory” chapter about HTML5 Canvas, you will learn considerably more than you would expect from a basic overview that you might find in other books.
The first part of this chapter shows you how to render line segments, rectangles, and circles in HTML5 Canvas, and also how to combine HTML5 Canvas with CSS3 stylesheets.
The second part introduces you to linear and radial gradients in HTML5 Canvas, with examples of how to apply them to Bézier curves and JPG files. The third part of this chapter discusses jCanvas, which is a jQuery plugin for HTML5 Canvas, and also an example of combining Canvas-based graphics with jQuery Mobile.
The concepts and code samples in this chapter will help you understand the HTML5 Canvas-based charts and graphs. If you want to explore additional HTML5 Canvas graphics after you have finished reading this chapter, an extensive set of code samples is available here:
http://code.google.com/p/html5-canvas-graphics
This chapter provides techniques for creating various visual effects that you can use in your custom charts and graphs. At the same time, it’s also important for you to assess the trade-off (time, effort, and cost) between writing low-level Canvas-based graphics code, such as the code samples in this chapter, versus the availability of open source projects and commercial products.
One more point to keep in mind: HTML5 Canvas does not have any sort of “dependency” on jQuery or jQuery Mobile. If necessary, you can create hybrid HTML5 mobile applications containing HTML5 Canvas in conjunction with other toolkits (such as PhoneGap) or even without a toolkit.
Several years ago Canvas began in OS X as a widget toolkit. After Canvas had already been available in the Safari browser, it became a specification for the Web. Now, it is commonly referred to as HTML5 Canvas.
HTML5 Canvas and SVG both allow you to programmatically render graphics in a browser via JavaScript. However, HTML5 Canvas uses “immediate mode,” which is a write-and-forget approach to rendering graphics. Thus, if you want to write a sketching program in HTML5 Canvas and you also want to provide an “undo” feature, then you must programmatically keep track of everything that users have drawn on the screen. On the other hand, SVG uses a “retained mode,” which involves a DOM (Document Object Model) structure that keeps track of the rendered objects and their relationship to one another.
If you are going to write HTML Web pages that make extensive use of graphics effects, you’ll probably need to understand the differences between HTML5 Canvas and SVG in terms of performance. You have the freedom to use one technology exclusively, but you can also create HTML Web pages that contain a mixture of HTML5 Canvas, SVG, and CSS3. Performance-related information can help you decide how you are going to code your HTML Web pages.
Although this chapter does not delve into the preceding points in any more detail, you can find a good overview of some features/advantages of HTML5 Canvas here:
http://thinkvitamin.com/code/how-to-draw-with-html-5-canvas/
Incidentally, if you need HTML5 Canvas support in Internet Explorer 8, you can use ExplorerCanvas, which is an open source project that is available here:
http://code.google.com/p/explorercanvas/
You can use the preceding code project simply by including the following code snippet in your HTML Web pages:
<!-- [if IE lt 8]><script src="excanvas.js"></script><![endif]-->
One point to consider is when it’s advantageous to use HTML5 Canvas instead of a technology such as SVG. The following short list contains some features to consider when you are making this type of analysis:
Most modern browsers provide varying degrees of built-in support for SVG, and Adobe’s SVG viewer can be used with Microsoft’s Internet Explorer. If you need filter-based visual effects, then SVG provides a very rich (perhaps even the best) functionality. If you need built-in support for HTML controls, then frameworks such as Wijmo might be a good solution for your needs. Another point to consider is that Adobe no longer supports its SVG viewer. This is a significant decision, because Adobe’s SVG viewer had been the de facto standard for SVG viewers for many years. Although Firefox and Opera have made significant progress in terms of their support for SVG, and both are enhancing their support for SVG, they still lack the feature support of Adobe’s SVG viewer. Thus, you need to weigh the most important factors in order to make the decision that will meet your project-related needs.
A very good article containing examples and diagrams that compares the use of HTML5 Canvas and SVG is here:
http://blogs.msdn.com/b/ie/archive/2011/04/22/thoughts-on-when-to-use-canvas-and-svg.aspx
The HTML5 Canvas Coordinate System
Think back to your days in high school, where you learned that the Cartesian coordinate system identifies any point in the Euclidean plane by means of a pair of numbers, often written as (x,y). The first number represents the horizontal value and the second number represents the vertical value. The horizontal axis is labeled the x-axis, and positive values on the x-axis are to the right of the vertical axis (i.e., toward the right). The vertical axis is labeled the y-axis, and positive values on the y-axis are above the horizontal axis. The origin is the intersection point of the x-axis and the y-axis.
The situation is almost the same in the HTML5 Canvas coordinate system. The x-axis is horizontal and the positive direction is toward the right. The y-axis is vertical, but the positive direction is downward, which is the opposite direction of most graphs in a typical mathematics textbook. In the HTML5 Canvas coordinate system, the origin is the upper-left corner of the screen (not the lower-left corner), and the unit of measurement is the pixel. As this book goes to print, the largest visible display is 2880×1800, and undoubtedly larger displays will be available in the future.
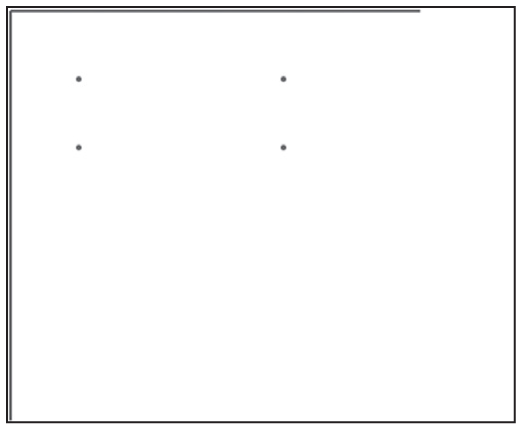
Figure 9.1 Four points rendered in HTML5 Canvas.
As a simple illustration, Figure 9.1 displays four points in an HTML5 <canvas> element.
If you start from the origin (the upper-left corner of the screen) and move 50 pixels to the right, followed by 50 pixels downward, you will reach the upper-left point in Figure 9.1. Next, if you start from the origin and move 200 pixels to the right and 50 pixels downward, you will reach the upper-right point in Listing 9.1. In a similar fashion, the two points in the second “row” have coordinates (50,100) and (200,100). Notice that the two points in the first row have the same value for the y-coordinate, which makes sense because they are the same distance away from the top of the Web page; the same is true for the two points in the second row. Similarly, the two points in the left “column” have the same x-coordinate because they are both the same distance from the left side of the Web page.
Now that you have an understanding of the HTML5 Canvas coordinate system, let’s take a look at the contents of Listing 9.1, which displays a minimal HTML5 Web page that is ready for rendering HTML5 Canvas-based graphics. Every Canvas-based code sample in this book uses the code (or some variant) that is displayed in Listing 9.1. Note that if you launch this code in a browser session, you will only see a blank screen.
LISTING 9.1 Canvas1.html
<!DOCTYPE html>
<html lang="en">
<head>
<meta charset="utf-8">
<title>Canvas Drawing Rectangles</title>
<script><!--
window.addEventListener('load', function () {
// Get the canvas element
var elem = document.getElementById('myCanvas');
if (!elem || !elem.getContext) {
return;
}
// Get the canvas 2d context
var context = elem.getContext('2d');
if (!context) {
return;
}
// Insert your custom Canvas graphics code here
});
// --></script>
</head>
<body>
<canvas id="myCanvas" width="300" height="300">
No support for Canvas.
</canvas>
</body>
</html>
Listing 9.1 contains an HTML <head> element that checks for the existence of an HTML <canvas> element inside the HTML <body> element of the Web page, and then gets the 2D context from the HTML <canvas> element. If you skip over the various conditional statements in Listing 9.1, there are two lines of code that enable us to get a reference to the variable context, which represents a drawable surface:
var elem = document.getElementById('myCanvas');
var context = elem.getContext('2d');
If you launch Listing 9.1 in a browser that does not support HTML5 Canvas, the text message “No support for Canvas.” is displayed.
The following code snippet is executed whenever you launch the Web page because of an anonymous JavaScript function that is executed during the load event:
<script><!--
window.addEventListener('load', function () {
// do something here
});
// --></script>
Now that you understand the underlying code for rendering Canvas-based 2D shapes, you can focus on the code that actually draws some 2D shapes, starting with the example in the next section.
Line Segments, Rectangles, Circles, and Shadow Effects
This section contains an assortment of code samples that illustrate how to render 2D shapes in HTML5 Canvas. There are many concepts introduced in this section, so before delving into the code sample, let’s look at some of the HTML5 Canvas APIs that are used in this section. Chapter 2 contains a section that describes various ways for specifying colors, and the material in that section is relevant for the code sample in this chapter (so you can quickly review its contents now if you need to do so).
HTML5 Canvas provides the fillRect() method for rendering a rectangle, which requires four parameters: the upper-left vertex (defined by its x-coordinate and its y-coordinate) of the rectangle, the width of the rectangle, and the height of the desired rectangle. The Canvas fillRect() API looks like this:
context.fillRect(x, y, width, height);
HTML5 Canvas allows you to render line segments by specifying the (x,y) coordinates of the two endpoints of a line segment. The two new APIs that are used in the code sample in this section are moveTo() and lineTo(), and they look like this:
context.moveTo(x1, y1);
context.lineTo(x2, y2);
The preceding code snippet represents the line segment whose two endpoints are specified by the points (x1, y1) and (x2, y2). Note that you can also render the same line segment with the following code snippet:
context.moveTo(x2, y2);
context.lineTo(x1, y1);
Shadow effects provide a richer visual experience that is an improvement over the use of non-shadow effects. You create a shadow effect by assigning values to three shadow-related attributes that control the size of the underlying shadow and also the extent of the “fuzziness” of the shadow, as shown here:
context.shadowOffsetX = shadowX;
context.shadowOffsetY = shadowY;
context.shadowBlur = 4;
You can also assign (R,G,B) or (R,G,B,A) values to shadowColor (which is an attribute of the drawing context) as shown here:
context.shadowColor = "rgba(0,0,64,1.0)";
The HTML5 Web page RandRectanglesShadow.html in Listing 9.2 (with code sections omitted for brevity) uses this technique in order to render a set of randomly generated rectangles with a shadow effect.
LISTING 9.2 RandRectanglesShadow.html
<!DOCTYPE html>
<html lang="en">
<head>
<meta charset="utf-8">
<title>Canvas Random Rectangles With Shadow Effects</title>
<link href="CSS3Background2.css"
rel="stylesheet" type="text/css">
<script><!--
window.addEventListener('load', function() {
redrawCanvas = function() {
// clear the canvas before drawing new set of rectangles
context.clearRect(0, 0, elem.width, elem.height);
for(var r=0; r<rectCount; r++) {
basePointX = canWidth*Math.random();
basePointY = canHeight*Math.random();
// Alternate shadow effect based on an even/odd
// click count with different (R,G,B,A) values
if(clickCount % 2 == 0) {
context.shadowColor = "rgba(0,0,64,1.0)";
} else {
context.shadowColor = "rgba(64,0,0,1.0)";
}
// code that specifies the size and also the
// "fuzziness" of the underlying shadow effect
context.shadowOffsetX = shadowX;
context.shadowOffsetY = shadowY;
context.shadowBlur = 4;
context.lineWidth = 1;
// render a colored rectangle
colorIndex = Math.floor(basePointX)%fillStyles.
length;
context.fillStyle = fillStyles[colorIndex];
context.fillRect(basePointX, basePointY,
rectWidth, rectHeight);
++clickCount;
}
}
// render a set of random rectangles
redrawCanvas();
});
// --></script>
</head>
<body>
<canvas id="myCanvas" width="800" height="350">No support for
Canvas
</canvas>
</body>
</html>
The HTML5 code in Listing 9.2 starts by initializing some JavaScript variables and then defining the JavaScript function redrawCanvas() that contains a loop for rendering the rectangles on the screen. The loop calculates the coordinates of the upper-left vertex of each rectangle as shown here:
basePointX = canWidth*Math.random();
basePointY = canHeight*Math.random();
The next part of the loop assigns the background color (which alternates between a dark blue and dark red shadow), and then sets up the shadow effect by specifying values for the attributes shadowOffsetX, shadowOffsetY, and shadowBlur, as shown here:
context.shadowOffsetX = shadowX;
context.shadowOffsetY = shadowY;
context.shadowBlur = 4;
The actual rendering of each rectangle is performed by the following code:
context.fillRect(basePointX, basePointY,
rectWidth, rectHeight);
Notice that the clickCount variable is incremented each time users click inside the HTML5 Canvas element, and its value determines which shadow color is applied to the randomly generated rectangles.
Although shadow effects create a pleasing effect, they also have an impact on performance. If you need shadow-like effects but performance becomes an issue, one alternative is to render a background shape in black (or some other dark color), and then rendering the same shape (with a small offset) using a different color.
For example, you can create a shadow effect for rectangles by first rendering a black rectangle and then rendering a red rectangle on top of the black rectangle, as shown here:
// render a black rectangle
context.fillStyle = '#000';
context.fillRect(50+shadowX, 50+shadowY, 200, 100);
// render a red rectangle
context.fillStyle = '#f00';
context.fillRect(50, 50, 200, 100);
The values for shadowX and shadowY determine the size of the background “shadow,” and the choice of positive versus negative values for shadowX and shadowY will determine the relative position of the black rectangle with respect to the red rectangle.
 The CSS stylesheet CSS3Background2.css that is referenced in the HTML5 Web page RandRectanglesShadow1.html is available on the CD. This CSS stylesheet contains two similar CSS3 selectors for rendering the HTML5 <canvas> element defined in Listing 9.2, as well as a hover-based selector that changes the background of the HTML5 <canvas> element whenever users hover over this element with their mouse. The #myCanvas selector defines a radial gradient, followed by two repeating radial gradients that specify various combinations of red, green, yellow, and blue at different pixel locations. A key point involves the use of transparent, which changes the gap between consecutive colors that are rendered.
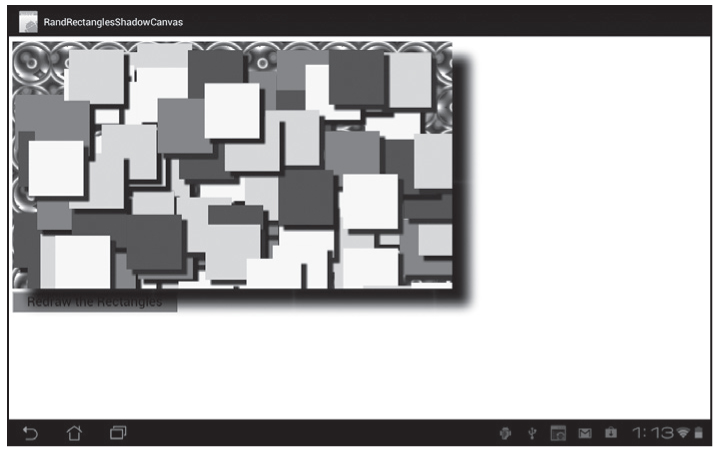
Figure 9.2 Canvas random rectangles on an Asus Prime tablet with Android ICS.
Figure 9.2 displays a set of randomly generated rectangles with a shadow effect based on RandRectanglesShadow.html in Listing 9.2, rendered in landscape mode on an Asus Prime Tablet with Android ICS.
HTML5 Canvas provides two primary types of color gradients (similar to SVG and CSS3): linear gradients and radial gradients.
Linear color gradients can be further sub-divided into three types: horizontal linear gradients, vertical linear gradients, and diagonal linear gradients. Thus, HTML5 Canvas provides color gradients that enable you to create pleasing visual effects.
A linear gradient is defined in terms of ColorStop elements, each of which contains a decimal (between 0 and 1) and a hexadecimal value that represents a color. For example, if you define a linear gradient with an initial color of #FF0000 (the hexadecimal value for red) and a final color of #000000 (the hexadecimal value for black), then the resultant color gradient will range (in a linear fashion) from red to black. Linear gradients enable you to create vivid and interesting color combinations, and they are available in three varieties: horizontal, vertical, and diagonal. Note that “linear gradient” and “linear color gradient” are used interchangeably in this book.
Horizontal, Vertical, and Diagonal Linear Gradients
As you learned in the introduction of this chapter, HTML5 Canvas supports the method createLinearGradient()that you can use to programmatically create linear gradients. Its syntax looks like this:
context.createLinearGradient(startX, startY, endX, endY);
The HTML5 page LGradRectangles1.html in Listing 9.4 demonstrates how to render a set of rectangles with horizontal, vertical, and diagonal linear gradients. Listing 9.3 references the CSS3 stylesheet HoverAnimation1.css that applies CSS3 keyframes-based 2D animation to the first HTML5 <canvas> element whenever users hover over this <canvas> element with their mouse. Listing 9.4 also references the CSS3 stylesheet HoverAnimation2.css, which acts in a similar fashion. However, this stylesheet applies CSS3 3D animation effects to the second HTML5 <canvas> element in Listing 9.3. Since the animation techniques in these CSS stylesheets were discussed in Chapter 2, we will omit them from this chapter, but the entire source code is available on the CD.
LISTING 9.3 LGradRectangles1.html
<!DOCTYPE html>
<html lang="en">
<head>
<meta charset="utf-8">
<title>Canvas Linear Gradient Rectangles</title>
<link href="HoverAnimation1.css"
rel="stylesheet" type="text/css">
<link href="HoverAnimation2.css"
rel="stylesheet" type="text/css">
<script><!--
window.addEventListener('load', function () {
redrawCanvas = function() {
// clear the canvas before drawing new set of rectangles
//context.clearRect(0, 0, elem.width, elem.height);
//context2.clearRect(0, 0, elem.width, elem.height);
// upper left rectangle: horizontal linear gradient
currentX = basePointX;
currentY = basePointY;
gradient1 = context.createLinearGradient(
currentX,
currentY,
currentX+rectWidth,
currentY+0*rectHeight);
gradient1.addColorStop(0, '#f00');
gradient1.addColorStop(1, '#00f');
context.fillStyle = gradient1;
context.fillRect(currentX, currentY,
rectWidth, rectHeight);
// upper right rectangle: vertical linear gradient
// similar code omitted for brevity
// render the lower rectangles in the second <canvas>
// element
// lower left rectangle: diagonal linear gradient
// similar code omitted for brevity
// lower right rectangle: diagonal linear gradient
// similar code omitted for brevity
++clickCount;
basePointX += 4;
basePointY += 2;
}
// render linear gradient rectangles
redrawCanvas();
}, false);
// --></script>
</head>
<body>
<div>
<canvas id="myCanvas" width="600" height="250">
No support for Canvas
alt="Rendering linear gradient rectangles.">
</canvas>
</div>
<div>
<canvas id="myCanvas2" width="600" height="250">No support
for Canvas
alt="Rendering linear gradient rectangles.">
</canvas>
</div>
<div>
<input type="button" onclick="redrawCanvas();return false"
value="Redraw the Rectangles" />
</div>
</body>
</html>
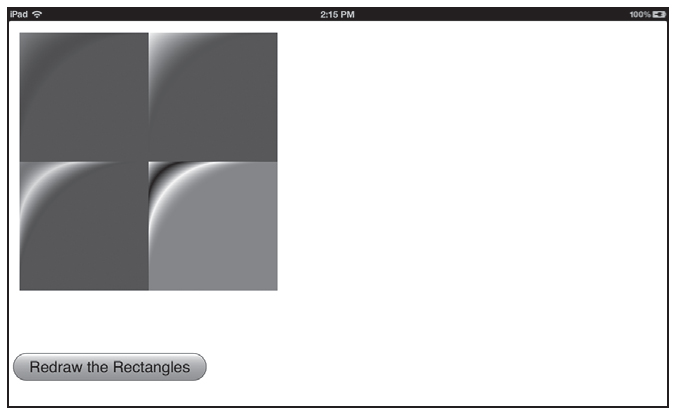
Listing 9.3 renders four rectangles with linear gradient shading. The linear gradients have two, three, or four invocations of the addColorStop() method, using various combinations of colors (expressed in hexadecimal form) so that you can see some of the gradient effects that are possible.
Experiment with different values for the color stop definitions to see how their values change the appearance of the rendered rectangles.
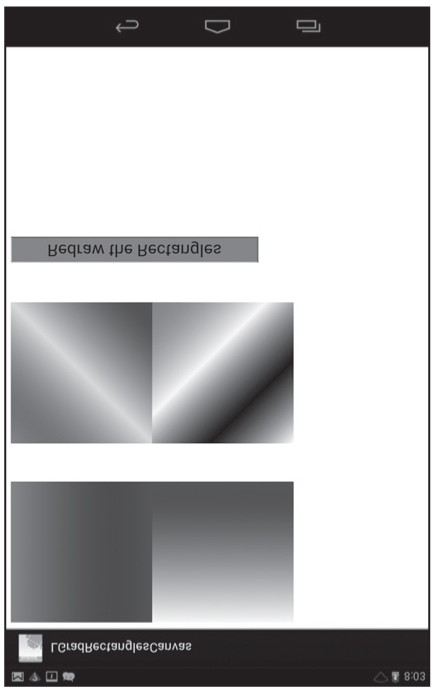
Figure 9.3 Linear gradient rectangles on a Nexus 7 tablet with Android JellyBean.
Figure 9.3 displays a set of randomly generated rectangles with a shadow effect based on LGradRectangles1.html, in landscape mode on a Nexus 7 tablet with Android JellyBean.
A radial color gradient is the second type of HTML5 Canvas-based color gradient. You can define a radial color gradient via the createRadialGradient() method, using the addColorStop() method to add color values. Its syntax (without the addColorStop() method) looks like this:
context.createRadialGradient(startCenterX, startCenterY,
startRadius, endsCenterX, endCenterY, endRadius);
A radial color gradient can be compared to the ripple effect that is created when you drop a stone in a pond, where each “ripple” has a color that changes in a gradient fashion. Each ripple corresponds to a color stop element. For example, if you define a radial gradient with a start color of #FF0000 (which is red) and an end color of #000000 (which is black), then the resultant color gradient will range—in a radial fashion—from red to black. Radial gradients can also contain multiple start/stop color combinations. The point to keep in mind is that radial gradients change colors in a linear fashion, but the rendered colors are drawn in a set of expanding concentric circles. Note that “radial gradient” and “radial color gradient” are used interchangeably in this book.
The HTML5 Web page RGradRectangles1.html, which renders line segments, rectangles, and circles in an HTML5 <canvas> element using linear and radial gradients, is available on the CD.
gradient1 = context.createRadialGradient(currentX,
currentY,
0,
currentX+rectWidth,
currentY+rectHeight,
rectWidth);
gradient1.addColorStop(0, '#f00');
gradient1.addColorStop(1, '#00f');
context.fillStyle = gradient1;
context.fillRect(currentX, currentY,
rectWidth, rectHeight);
The HTML5 Web page RGradRectangles1.htmlis similar to Listing 9.3, except for the use of a radial gradient (instead of a linear gradient) that ranges in a radial fashion from blue to red. The method addColorStop() is invoked four times in order to add four “color stop values” to the radial gradient. This Web page also references HoverAnimation1.css, whose entire source code is available on the CD.
Figure 9.4 Radial gradient rectangles on an iPad3.
Figure 9.4 displays a set of rectangles with a radial gradient based on RGradRectangles1.html in landscape mode on an iPad3.
HTML5 Canvas Transforms and Saving State
HTML5 Canvas enables you to rotate, scale, shear, or translate (shift horizontally and/or vertically) 2D shapes and text strings with the following methods:
rotate(x,y)
scale(x,y)
transform(x1,y1,x2,y2,x3,y3)
translate(x,y)
One thing to keep in mind is that you specify the transforms you want to apply (along with setting attributes values) before actually rendering a graphics shape in your HTML5 Web pages.
The following code snippets illustrate sample values that you can use in the preceding Canvas methods, where context is a JavaScript variable that references the context of an HTML5 <canvas> element:
context.rotate(30*Math.PI/180);
context.scale(0.8, 0.4);
context.translate(100, 200);
context.transform(1, 0, 0.5, 1, 0, 0);
The rotate() method in the preceding code block references the JavaScript constant Math.PI whose value represents PI radians. In case you have forgotten, PI radians equal 180 degrees, so 2*PI radians is 360 degrees, and PI/2 radians is 90 degrees. Hence, Math.PI/6 radians (or 30*Math.PI/180) is the same as 30 degrees. You won’t need to know anything more about radians, but feel free to perform an Internet search if you want to read some tutorials that provide additional examples.
Two additional APIs in HTML5 Canvas are save() and restore(), which enable you to save the current state of a canvas state, make some changes, and then restore the original state of the canvas. The save() method “pushes” the current state on a stack, and the restore() method “pops” the most recent state that was pushed onto the stack.
You can save (and later restore) a canvas state after having applied any of the transformations listed in this section, and also after having specified values for shadow-related attributes (among others). You can invoke the save() and restore() methods multiple times on a canvas state, which makes these two methods very useful for game-related Web pages. We will not use these two methods in any code samples in this chapter, but you can perform an Internet search to read tutorials and also find code samples.
The HTML5 Web page JQMCanvasTransforms1.html on the CD illustrates how to apply four HTML5 Canvas transforms to a text string.
jCanvas: a jQuery Plugin for HTML5 Canvas
The jCanvas jQuery plugin enables you to use jQuery syntax in order to specify 2D shapes that are rendered in an HTML5 <canvas> element. Its homepage is here:
http://calebevans.me/projects/jcanvas/
The HTML5 Web page JCanvasSamples1.html on the CD illustrates how to render several 2D shapes using jCanvas.
Figure 9.5 The jQuery jCanvas plugin on an iPad3.
Figure 9.5 displays the result of rendering JCanvasSamples1.html in landscape mode on an iPad3.
You can also use jQuery Mobile with HTML5 Canvas, as shown in the code sample in the next section.
HTML5 Canvas with CSS3 and jQuery Mobile
By now, we hope you understand how to render 2D shapes in HTML5 Canvas. This section contains a code sample that shows you how to combine jQuery Mobile, HTML5 Canvas, and the dynamic creation of HTML <div> elements whenever users tap inside the HTML5 <canvas> element in this Web page.
Keep in mind that although the graphics effects are not necessarily relevant to your requirements, this code sample does illustrate how to handle dynamic creation of elements as well as tap events in jQuery Mobile (which are handled differently from tap events in jQuery).
Listing 9.4 displays the contents of the HTML5 Web page JQMCanvas1.html, and Listing 9.5 displays the CSS stylesheet JQMCanvas1.css whose CSS3 selectors match elements in the HTML5 Web page JQMCanvas1.html.
LISTING 9.4 JQMCanvas1.html
<!DOCTYPE html>
<html lang="en">
<head>
<title>JQueryMobile and Canvas Graphics</title>
<link rel="stylesheet" href="JQMCanvas1.css" />
<link rel="stylesheet"
href="http://code.jquery.com/mobile/1.1.0/
jquery.mobile-1.1.0.min.css" />
<script src="http://code.jquery.com/jquery-2.0.0b1.js">
</script>
<script
src="http://code.jquery.com/jquery-migrate-1.1.0.js">
</script>
<script
src="http://code.jquery.com/mobile/1.1.0/
jquery.mobile-1.1.0.min.js">
</script>
<script>
var tapCount = 0;
var xCoord = 0, yCoord = 0;
var rectWidth = 20, rectHeight = 20;
var rectColors = new Array('#ff0', '#0f0', '#00f');
var elem, context;
var gradient1 = '-webkit-gradient(radial, 5 25%, 5, 10 50%, 20, from(red), color-stop(0.05, orange), color-stop(0.4, yellow), color-stop(0.6, red), color-stop(0.9, blue), to(#fff))';
var gradient2 = '-webkit-gradient(radial, 5 25%, 5, 10 50%, 20, from(blue), color-stop(0.05, orange), color-stop(0.4, red), color-stop(0.6, black), color-stop(0.9, blue), to(#f00))';
var gradient3 = '-webkit-gradient(radial, 5 25%, 5, 10 50%, 20, from(blue), color-stop(0.05, yellow), color-stop(0.4, green), color-stop(0.6, red), color-stop(0.9, blue), to(#fff))';
var gradient4 = '-webkit-gradient(radial, 5 25%, 5, 10 50%, 20, from(blue), color-stop(0.05, yellow), color-stop(0.2, green), color-stop(0.6, blue), color-stop(0.8, red), to(#fff))';
var currentBG;
$("#page1").live('pageinit', (function(event){
// Get the canvas element
elem = document.getElementById('MyCanvas');
if (!elem || !elem.getContext) {
return;
}
// Get the canvas 2d context
context = elem.getContext('2d');
if (!context) {
return;
}
// user tapped MyCanvas...
$("#MyCanvas").live('vmousedown',function(event) {
xCoord = 0.40*(event.clientX)*window.devicePixelRatio;
yCoord = 0.40*(event.clientY)*window.devicePixelRatio;
context.fillStyle = rectColors[++tapCount%rectColor
s.length];
context.fillRect(xCoord, yCoord, rectWidth,
rectHeight);
$("#MyCanvas").hide("slow");
});
// this makes MyCanvas visible again
$("#tapInside").live('tap',function(event) {
$("#MyCanvas").show("slow");
});
$("#CanvasParent").live('vmousedown',function(event) {
if(tapCount % 4 == 0) {
currentBG = gradient1;
} else if(tapCount % 4 == 1) {
currentBG = gradient2;
} else if(tapCount % 4 == 2) {
currentBG = gradient3;
} else {
currentBG = gradient4;
}
newNode = $('<div>').css({'position':'absolute',
'background': currentBG,
'width':rectWidth+'px',
'height':rectHeight+'px',
top: event.clientY,
left: event.clientX
});
//append the new rectangle to CanvasParent
$("#CanvasParent").append(newNode);
})
})
);
</script>
<style>
#tapInside { color: #f00; }
#MyCanvas { width: 80%; height: 30%; }
</style>
</head>
<body>
<div data-role="page" id="page1"
data-role="page" data-theme="b">
<div data-role="header">
<h2>JQuery Mobile and Canvas Graphics</h2>
</div>
<div data-role="content">
<div id="tapInside">
<p>Tap Inside the Red Rectangle to Hide and Tap Here
to Show:</p>
</div>
<div id="CanvasParent" name="CanvasParent">
<canvas name="MyCanvas" id="MyCanvas"
style="background:#f00;width=80%;height=200px">
</canvas>
<div id="outer">
<div id="radial3">Text3</div>
<div id="radial2">Text2</div>
<div id="radial4">Text4</div>
<div id="radial1">Text1</div>
</div>
<!-- jQuery toggle-handling code -->
<script>
$(document).ready(function() {
$("#outer").toggle(function(){
$("#radial1").show("slow");
$("#radial2").hide("slow");
$("#radial3").hide("slow");
$("#radial4").show("slow");
$("#radial1").hide("slow");
$("#radial2").show("slow");
$("#radial3").show("slow");
$("#radial4").hide("slow");
});
});
</script>
</div>
<div data-role="footer">
<h3>JQuery Mobile and Canvas Graphics</h3>
</div>
</div>
</body>
</html>
Notice that Listing 9.4 contains a single jQuery Mobile page view. After initializing some JavaScript variables, Listing 9.4 contains the definition of the JavaScript variables gradient1, gradient2, gradient3, and gradient4, each of which contains the definition of a Webkit-based radial gradient.
When users tap on the <canvas> element whose id has value MyCanvas, the code adds a new rectangle at the location of the tap event, and then the <canvas> element slowly disappears, as shown here:
$("#MyCanvas").live('vmousedown',function(event) {
xCoord = 0.40*(event.clientX)*window.devicePixelRatio;
yCoord = 0.40*(event.clientY)*window.devicePixelRatio;
context.fillStyle = rectColors[++tapCount%rectColors.length];
context.fillRect(xCoord, yCoord, rectWidth, rectHeight);
$("#MyCanvas").hide("slow");
});
Keep in mind that you must use the vmousedown event, because a tap event in jQuery Mobile does not provide you with the coordinates of the location of the tap event. You also need to use the value of window.devicePixelRatio in the calculations for the location of the tap event.
When users tap on the <canvas> element whose id has value tapInside, the hidden <canvas> element is displayed again, along with any rectangles that were previously rendered via the fillRect() method.
When users tap on the <canvas> element whose id value is CanvasParent, the code first uses conditional logic to determine which radial gradient to select and assign to the JavaScript variable currentBG.
Next, a new HTML <div> element is dynamically created at the location of the tap event and appended to the CanvasParent element, as shown here:
newNode = $('<div>').css({'position':'absolute',
'background': currentBG,
'width':'35px',
'height':'35px',
top: event.pageY,
left: event.pageX
});
//append the new rectangle to CanvasParent
$("#CanvasParent").append(newNode);
Notice that the position property is set to absolute in the preceding code block, which means that this dynamically created <div> element will remain visible whenever the MyCanvas element slowly fades from view. However, all the rectangles that are rendered using the fillRect() method will also slowly disappear.
Finally, whenever users click on any of the bottom four <div> elements that are rendered with radial gradients, the code will cause them to disappear “out of sequence,” and the remaining visible elements will be shifted accordingly.
LISTING 9.5 JQMCanvas1.css
#outer {
position: relative; top: 10px; left: 0px;
}
#radial1 {
color: red;
font-size: 24px;
height: 100px;
width: 300px;
position: relative; top: 0px; left: 0px;
radial, 100 25%, 20, 100 25%, 40, from(blue), to(#fff)
);
}
#radial2 {
color: red;
font-size: 24px;
width: 300px;
height: 100px;
position: absolute; top: 0px; left: 300px;
background: -webkit-gradient(
radial, 100 25%, 20, 150 25%, 40, from(red), to(#fff)
);
}
#radial3 {
color: blue;
font-size: 24px;
width: 300px;
height: 100px;
position: relative; top: 0px; left: 0px;
background: -webkit-gradient(
radial, 100 25%, 30, 100 25%, 20, from(yellow), to(#fff)
);
-webkit-box-shadow: 0px 0px 8px #000;
}
#radial4 {
color: red;
font-size: 24px;
width: 300px;
height: 100px;
position: absolute; top: 100px; left: 300px;
background: -webkit-gradient(
radial, 100 25%, 20, 100 25%, 40, from(green),
color-stop(0.2, orange), color-stop(0.4, yellow),
color-stop(0.6, green), color-stop(0.8, blue),
to(#fff)
);
}
Listing 9.5 contains four selectors that correspond to the HTML <div> elements with id values radial1, radial2, radial3, and radial4 in JQMCanvas1.html. Since each of these selectors defines Webkit-based radial gradients that you have already seen in earlier examples in this book, we won’t discuss the details of those gradients.
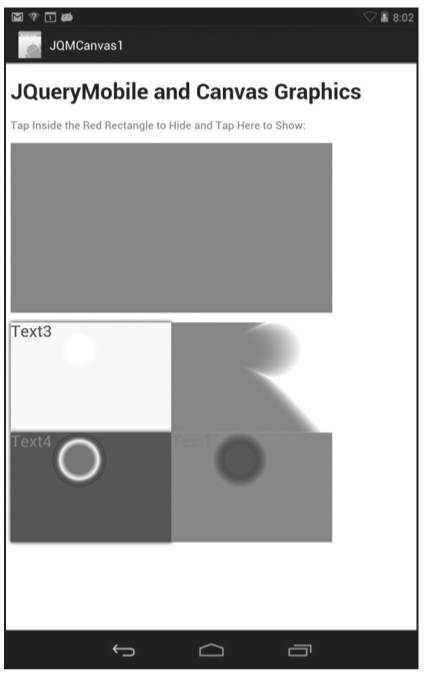
Figure 9.6 A JQuery Mobile application on a Nexus 7 tablet with Android JellyBean.
Figure 9.6 displays the result of rendering JQMCanvas1.html in landscape mode on a Nexus 7 tablet with Android 4.1.
Additional Code Samples on the CD
HTML5 Canvas provides support for both quadratic Bézier curves and cubic Bézier curves. The code samples in this section show you how to generate interesting combinations of Bézier curves by using various types of gradient shading. Later in this book, you will see how to use ECMAScript in order to programmatically change the values of attributes.
Bézier curves are named after Pierre Bézier, who promoted them during the 1970s. Bézier curves can represent many non-linear shapes, they can be found in interesting applications, including PostScript for the representation of fonts. An Internet search will yield many Web pages with interesting demonstrations (some of which also require additional plug-ins). You’ll find computer programs written in C and Java, some of which are interactive, that demonstrate Bézier curves.
Cubic Bézier curves have two end points and two control points, whereas quadratic Bézier curves have two end points and a single control point. The x-coordinate and y-coordinate of a cubic Bézier curve can be represented as a parameterized cubic equation whose coefficients are derived from the control points and the end points. The beauty of HTML5 Canvas is that it allows you to define both quadratic and cubic Bézier curves via the <path> element without having to delve into the mathematical underpinnings of Bézier curves. If you’re interested in learning the specific details, you can browse the Web, where you’ll find books and plenty of articles that cover this interesting topic.
HTML5 Canvas provides the quadraticCurveTo() method for creating quadratic Bézier curves, which requires one control point and an end point. HTML5 Canvas also provides the bezierCurveTo() method for creating cubic Bézier curves, which requires you to specify two control points and an end point. The context point (which is the location of the most recently rendered point) is used as the start point for quadratic and cubic Bézier curves.
The syntax for the HTML5 Canvas quadraticCurveTo() method looks like this:
quadraticCurveTo(controlX, controlY, endX, endY);
The syntax for the HTML5 Canvas bezierCurveTo() method looks like this:
bezierCurveTo(controlX1,controlY1,controlX2,controlY2,endX,endY);
The HTML5 page LRGradQCBezier1.html demonstrates how to render a quadratic Bézier curve with linear gradient shading and a cubic Bézier curve with radial gradient shading. The two CSS stylesheets CSS3Background4.css and HoverAnimation1.css are available on the CD.
The cubic Bézier curve defined in the HTML5 page LRGradQCBezier1.html is rendered with a radial gradient using six color stops, based on several calculated points, as shown here:
context.bezierCurveTo(
currentX+3*multiplier*rectWidth,
currentY+2*multiplier*rectHeight,
currentX+2*multiplier*rectWidth,
currentY-multiplier*rectHeight,
currentX+100, currentY+300);
Experiment with different values for the points in a Bézier curve, and you might find other ways to create pleasing visual effects. The next portion of Listing 9.6 renders a quadratic Bézier curve using a linear gradient with five color stops.
Note that whenever users click on the “redraw” button, another cubic and quadratic Bézier curve are drawn, based on the value of the variable clickCount that is incremented each time that users click on the “redraw” button. The new curves are superimposed on the previous curves, thereby creating a nice visual effect. However, if you want to refresh the HTML5 <canvas> element prior to rendering another pair of Bézier curves, simply uncomment the second line in the following code snippet:
// clear the canvas before drawing new set of rectangles
//context.clearRect(0, 0, elem.width, elem.height);
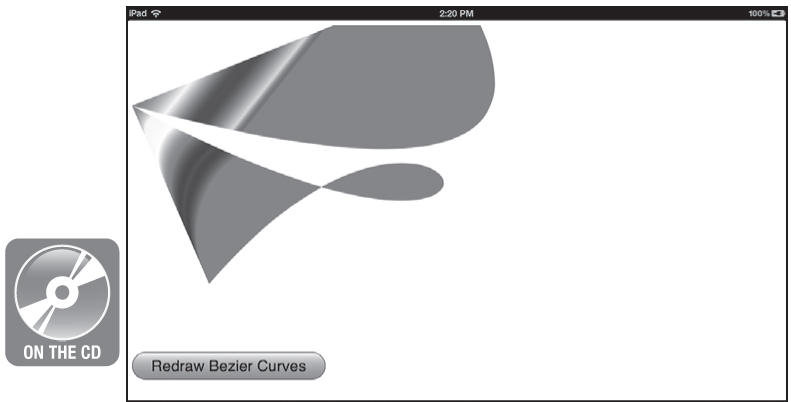
Figure 9.7 Gradient Bézier curves on an iPad3.
Figure 9.7 renders the quadratic and cubic Bézier curves that are defined in LRGradQCBezier1.html in landscape mode on an iPad3.
HTML5 Canvas supports the rendering of JPG files, and you can also apply CSS selectors to the HTML5 <canvas> element. The CD contains the HTML5 Web page Image1.html and Image1.css whose selectors match the HTML5 <canvas> element.
Incidentally, HTML5 Canvas also supports a clip() method that enables you to “clip” JPG files in various ways. Moreover, you can perform compositing effects, and you can even manipulate the individual pixels of a JPG file. Search the Internet for articles that describe the technical details of these effects.
HTML5 Canvas provides the method createPattern(image, type) that enables you to render a set of images according to a pattern type, whose values can be repeat, repeat-x, repeat-y, and no-repeat. An example of the syntax (and also how to use it) looks like this:
var pattern = canvas.createPattern(img,"repeat");
canvas.fillStyle = pattern;
canvas.fillRect(0,0,500,300);
The HTML5 Web page RepeatingImage1.html on the CD illustrates how to repeat a JPG image on an HTML5 <canvas> element.
Figure 9.8 displays RepeatingImage1.html in landscape mode on the Chrome browser on a MacBook.
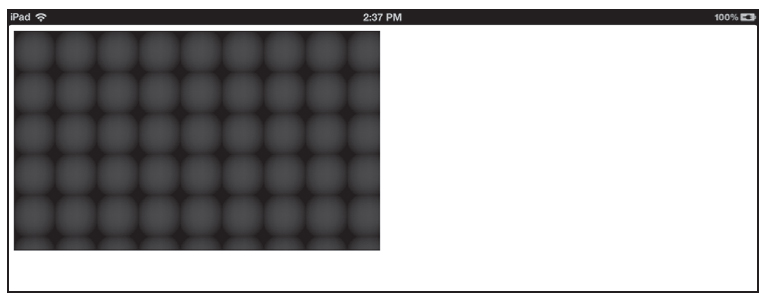
Figure 9.8 Repeating JPG on the Chrome browser on a MacBook.
There are several very good JavaScript toolkits available that provide a layer of abstraction on top of HTML5 Canvas , including Easel.js, Fabric.js, and Paper.js.
In addition to the code samples that are available on the respective homepage of these toolkits, you might enjoy the contents of the following open source project, which uses Easel.js to create graphics code samples:
http://code.google.com/p/easeljs-graphics
This chapter introduced you to HTML5 Canvas and showed you examples of creating 2D shapes with the HTML5 <canvas> element. You also learned how to combine HTML5 Canvas with jQuery custom code so that you can manipulate HTML5 Web pages with Canvas-based 2D shapes. In particular, you learned how to do the following in HTML5 Canvas: