Filtering Data
You may not always want to see all the data in a table. Perhaps you want to see only rows with a specific value in column A, or a higher-than-some-threshold value in column B, or a checkmark in column F. Numbers provides quick filtering for rows through a table’s Column menus, which I describe in Quick Filters. More sophisticated options, such as multiple criteria for filters, are described in Filtering with the Inspector.
Because this chapter is divided between the use of Filter menus and that of the Sort & Filter Inspector for filtering, I’ll mention here two quick items that are common to filtered tables in general:
- You can’t add rows to a filtered table; the Add commands are dimmed.
- Data in hidden rows—those that disappear when a table is filtered—are not included in charts unless you check Hidden Data in the Chart Option section of the Format Inspector’s Chart pane.
Quick Filters
When you want a quick look at a subset of the data in your rows, a “quick filter” is your best friend. You can apply a quick filter instantly by selecting from a Column menu, specifying which values you want to remain visible.
Creating Quick Filters
You can do quick filtering whether the table is active or selected:
- Specify a filter value: Click a column label, and choose from the Filter Table submenu, which lists all the unique values in a column. Choose 2 from the column B (Jack) submenu, and two body rows remain displayed, since only two rows have a 2 in that column. The sums and averages remain related to all the cells referenced in their formulas, no matter how many of them are showing (Figure 83).
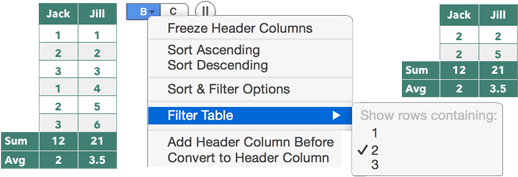
- Add a second filter to a column: Select another item from the same submenu. In your example table, choose 3; now there are four rows displayed, because there are two 2’s and two 3’s in Jack’s column.
-
Filter a second column: Choose from that column’s Filter Table submenu. In your example table, choose 6 from the column C (Jill) Filter Table submenu. Only one row is displayed now, since it’s the only one that gets through both filters: the value in Jack’s column must be 2 or 3, and Jill’s column must contain a 6 (Figure 84).
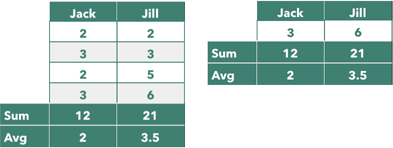
Figure 84: Left: With 2 and 3 filtered for Jack, four rows remain. Right: A second filter, for 6 in Jill, leaves only one row. It’s easier to predict how column filters will interact if you imagine one column winnowing the available rows, and the other then winnowing that group. This concept isn’t “directional”: Jack isn’t filtered first, and then Jill. It comes out the same if you think of Jill being filtered first and then the choices for Jack narrowing down from there.
-
Remove a filter value: Choose a selected filter value from a Filter Table submenu to uncheck it.
In the example file, uncheck 3 in Jack’s submenu. Oh, no! Oh, yes: all your rows disappear because no values can get through the current filter—a 2 in Jack and a 6 in Jill. In the example file, you’ll still see the header and footer rows when the body rows disappear. If you filter all rows from a table with no headers or footers, you’ll get a “No rows match the filter conditions” banner in place of the table. (Otherwise, there would be nothing on the sheet to indicate the filtered table’s existence.)
Quick Filter Quick Points
Here are some small but important points you should know before we move on to the slightly more complex procedure of creating filter rules:
- The Filter Table submenus don’t include any values from header or footer rows, which always remain visible.
- For a column with checkbox formatting, the Filter Table submenu lists TRUE (for checked boxes) and FALSE (for unchecked boxes).
- For a column formatted for star ratings, the Filter Table submenu shows numeric values from zero to 5.
- Footer rows that contain formulas that refer to column data show the results for all rows, including those hidden by the filter.
Because quick filters interact with settings in the Filter pane of the Sort & Filter Inspector:
- Selecting something in a Filter Table submenu creates a rule in the Inspector.
- If a Filter Table submenu includes the phrase “X other filters applied,” there are filter rules active for that column, applied through the Sort & Filter Inspector.
- If a Filter Table submenu is dimmed, it’s probably because the Filters checkbox in the Filter pane is unchecked.
Filtering with the Inspector
While Column menus offer a quick solution for simple filtering, it’s the Sort & Filter Inspector’s Filter pane that does the heavy lifting, letting you create multiple rules to filter a column.
A filter rule is a description like Score is greater than 30 or Name contains “Smith” or even Date is in the next 30 days. This flexibility alone puts filter rules in a different league from quick filters.
A filter is made up of one or more rules. (The fact that a single rule can define a filter muddies the water a bit when it comes to understanding the difference between the two, but you’ll quickly become comfortable with the concepts when you work with them.) You can filter multiple columns, resulting in quite sophisticated data selection for a table. When you want to display all your data again, you can turn your filters off (as a set), preserving the setup for reuse.
Filter Rule Benefits
Rules offer many advantages over quick filters. You can:
- Specify values for filtering that don’t yet exist in a column, since you aren’t limited by a submenu of existing values.
- Use multiple rules to create a complex filter for a column.
- Go beyond the simple “equals” criterion as a filter. Filter rules offer nearly 50 comparison operators that let you look for such things as:
- Numbers that fall in or outside of a range, or are higher or lower than the average for the column.
- Text that begins or ends with, or contains or doesn’t contain, certain characters.
- Dates as they relate to the current date (today, yesterday, tomorrow, last week, next month) or fall before, after, or between specified dates.
- Specify if all filters must be met, or if matching any single one is good enough. So, while one of the multiple-column quick filters described previously results in rows with a 2 or 3 in Jack’s column and a 6 in Jill’s, you can easily set up a more advanced filter that looks for rows that have a 2 or 3 for Jack or a 6 for Jill.
- Easily change a single argument of a complex filter. So, if you’ve filtered for the highest and lowest scores for your Blue team, you need only change the rule that filters for Blue to filter for Red instead, and you’ll get the highest and lowest scores for Red.
- Turn off a filter without losing its definition, so you can turn it back on again to view filtered data without redefining its parameters.
Create a Filter
Add a Filter
Start with a filter that finds the higher scores among the data:
- Select or activate the table, click the Sort & Filter
 button, and click Filter to open the Filter pane.
 - Click Add a Filter and choose a column name from its menu. (If there are no column headers, the menu lists Column A, Column B, and so on.) Choose Score for this example.
Numbers adds a Filters section to the pane; its checkbox is currently unchecked, since there’s as yet no filter applied to the table. A segment for the column you’re filtering—Score, in this example—is also added, and a popover opens from the filter’s Add a Rule button.
- Choose a category in the popover and then select a specific rule: click Numbers at the top of the popover and then click Greater Than or Equal To.
- Enter additional information to complete the rule: type
35in the field, and press Return to enter it.
Numbers selects the Filters checkbox and applies the filter; the table displays rows with scores of 35 and over (Figure 85).
To turn off all filters for a table but keep the rules for quick re-use, uncheck the Filters checkbox (shown in the figure above, top right).
Add a Second Rule to a Filter
You can create more than one rule to define a column’s filter, so you can filter for more than one thing in a column: grades A, A- or A+, for instance, or, in our example, the outlying scores of 35 and over or 25 and under).
With the table selected and the Filter pane showing, add a second rule:
- Click the Or button beneath the existing rule.
- Define the second rule: choose Less Than or Equal To from the popover, type
25in the field, and press Return.
The rows that are left show only the high and low scores, because, as the Filter pane pretty much spells out in its menus and fields, this filter is: Match any of the following rules: the Score is greater than or equal to 35; the Score is less than or equal to 25.
Delete and Edit Rules
You can modify a filter by deleting or editing any of its rules in the Sort & Filter Inspector’s Filter pane.
To delete a rule, hover your pointer toward the top of the rule in the Filter pane and then click the trash  button that appears. To edit a rule, click any of its criteria and make the change—greater than to greater than or equal to, for instance, or the number that you input for that threshold.
If you worked in your sample table following the instructions starting at Add a Filter, you have two rules that together find outlying scores that are 35 and over or 25 and under. To change the current filter to find just the above-average scores:
- Delete the second rule (Less Than or Equal To 25) by clicking its trash button (Figure 86).
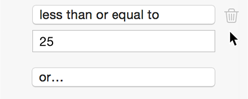
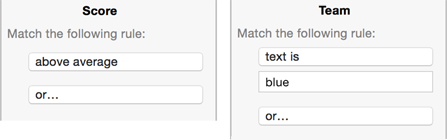
Figure 86: Deleting a rule. - Click the Greater Than or Equal To button in the rule that’s left, and select Above Average from the popover’s Number list to replace it; note its subtitle is “in the column,” just to keep you oriented.
Add a Second Filter
First let me reiterate the terminology: a rule is a description of what you want to remain in the column—numbers higher than 10, or cells that contain the word red, and so on. A filter is one or more rules that define what will show in a specific column. So, there’s only one filter for any column, but the filter may have multiple rules.
You can apply multiple filters to a table by creating them for more than one column. As a result, you can find, for instance, all the members of the Blue team (that’s one column) who had above-average scores (that’s another column).
To add a second filter to a table, work in the Filter pane:
- Click the Add a Filter button, and choose a column from the menu; in your example file, choose Team.
Numbers adds another rule segment at the bottom of the Filter pane and opens a popover from that rule’s Add a Rule button.
- Pick a rule from the popover: click the popover’s Text button, and choose is from the list. This puts text is in the Team filter segment.
- Provide details for the rule: type
bluein the field beneath text is (Figure 87), and press Return to enter it.
All Filters vs. Any Filters
Throughout this chapter, we’ve stuck with the Filter Pane’s default setting of All Filters (it’s in the pop-up menu beneath the Show Rows that Match label), but its alternative, Any Filter, is an extremely useful option.
With All Filters chosen, the filters you’ve defined for your columns are all applied. Say you have a list of student grades, with a column each for the midterm and final exams. If you set up a filter for an A in the Midterm column, and another for an A in the Final column, the All Filters setting means you’ll find only those students who earned A’s in both the midterm and the final. Choose Any Filters instead, and you’ll get a list of the students who scored an A in either the midterm or the final. (That would also include, of course, those who earned A’s in both.)