Introduction
THE DATA IN CHAPTER 5 ABOUT THE TRENDS IN INEQUALITY ESSENTIALLY updates the information contained in the Piketty and Milanovic books and elsewhere and assesses their conclusions critically. The conclusions in Chapter 5 relate to shares of the top 1 and 10% for income and wealth as well as the Gini coefficients. This chapter looks at a completely different issue – the stability of the positions for those with the highest levels of wealth.
After all, in a theoretically extreme case, if everyone had a chance of being rich for a period in their lives, it wouldn’t matter so much if at any point in time there was a wide distribution of income and wealth. Because, a bit like a lottery where everyone won at some point, we would just wait until it was our turn to win. Of course in the real world it is clear that plenty of people are never going to be rich. But there is a difference between a situation where income (and more especially wealth) always goes to the same group of well-off people and one where the cast of well-off is constantly changing.
Old sayings
Many cultures have their equivalent saying of the Lancashire saying ‘Clogs to clogs in three generations’, meaning that wealth rarely survives three generations.1 Typically the first generation earns the wealth, the second generation benefits from it and the third generation squanders it.2 In Japan the expression is ‘Rice paddies to rice paddies in three generations.’ The Scots say ‘The father buys, the son builds, the grandchild sells, and his son begs.’ In China, ‘Wealth never survives three generations.’3 The Americans say ‘Shirtsleeve to shirtsleeve in three generations’, attributing the phrase to Scots-born industrialist Andrew Carnegie.4
A US study by Merrill Lynch’s private banking arm this year found that, in two out of three cases, family wealth did not outlive the generation following the one that created it.5 In 90% of cases, it was exhausted by the end of the third generation – illustrating the ‘clogs to clogs’ adage.
Knowing these sayings, economists have tended to assume that persistence of wealth has not been a major economic issue.
The Bank of Italy study
But the economics world was taken by surprise when two economists from the Bank of Italy,6 Guglielmo Barone and Sauro Mocetti, managed to discover some newly digitalised tax data for Florence from 1427 that purported to show a remarkable continuity and persistence in family wealth for the city and surrounding area.
The study compared tax records for family dynasties (identified by surname) in Florence in 1427 and 2011. Its conclusion was unexpected: ‘When regressing the pseudo-descendant’s earnings on pseudo-ancestor’s earnings, the results are surprising: the long-run earnings elasticity is positive, statistically significant, and equals about 0.04’ (ancestors’ earnings were estimated on the basis of occupation/skill groups). The descendant of a family at the 90th percentile of the earnings distribution instead of the 10th percentile in 1427 entails ‘a 5% increase in earnings among current tax payers’ (after adjusting for age and gender). The intergenerational real wealth elasticity is significant too and the magnitude of its implied effect is even larger: the 10th-90th exercise entails more than a 10% (in fact 12%) difference today.
Looking for non-linearities using transition matrices (a statistical test), they found some evidence of a glass floor that prevents the upper class from ‘falling down the economic ladder … for those originating from the lower class (in terms of earnings), there are fairly similar opportunities to belong to one of the three destination classes (categorized as lower, middle and upper). For those coming from the upper class, in contrast, the probability of falling down to the bottom of the economic ladder is relatively low.’ A similar ‘glass floor’ was observed for the wealth transition matrix; moreover, in this case there also appears to be a ‘sticky floor’: more than two-fifths of descendants from the lower class remain there after centuries.
The results are fascinating, but of course difficult to replicate elsewhere. The homogeneity of Italian society over this period is unlikely to be repeated in many other places; the ability to identify people by name is also less easy in most other societies. It is important also not to exaggerate the conclusions – they show a statistically significant influence from the wealth of the ancestor, but the relationship is not a very strong one. Only about 4% of the earnings for those in the study are explained by their ancestry – and therefore 96% by other factors. Still, even the 4% is a surprise over such a long period.
Italy has been a remarkably static society, particularly compared with the Anglo-Saxon world. Much of the wealth has been in property, and property ownership in Italy has changed hands very much less than has been traditional in many other countries because of exceedingly high transactions charges.7
The St Louis Federal Reserve study
Since this study other central bank economists have applied themselves to the same issue (and indeed many had looked at the issue earlier as well). The St Louis Federal Reserve bank economists George-Levi Gayle and Andrés Hincapié looked at the Panel Study of Income Dynamics data from the US from 1968 to 2013.8
The results are fascinating and seem plausible. First, it takes about five generations (about 125 years9) in the US for the influence of your ancestry on your income to diminish to less than 5%. This compares with Florence where the Bank of Italy study suggests it took roughly 700 years.
The intergenerational elasticity of earnings in the US is 0.4% and that of wealth is 0.38%, meaning that a 10% difference in parents’ incomes will lead to a 4% difference in offspring’s incomes and a 10% difference in parents’ wealth a 3.8% difference in offspring’s wealth. Unfortunately the data on which this is based excludes those with zero or negative wealth who comprise about a fifth of households. So the authors of the study have also looked at the parents’ and offspring’s rank in the income and wealth distributions. These show surprisingly low correlations of 0.3 for wealth and 0.4 for income. They also show that earnings seem to be 33% more persistent than wealth – which supports the concept that education and human skills are more important than wealth per se and is relevant to the ‘superbabies’ concept described later in this chapter.
The Sunday Times Rich List data
Partly because I had access to some valuable data on the rich both in the world economy and in more detail in the UK through my connections with the Sunday Times, we tested the academic conclusions against this real life data.
The Sunday Times Rich List is a list of the 1,000 wealthiest people in the UK and the 250 wealthiest people in Ireland prepared by the UK Sunday Times newspaper. In addition the paper collects data on the 50 wealthiest people in the world. The series has been in existence since the 1980s. The data is collected carefully by a team of investigative journalists who carefully research the wealth of each individual on the list.
We have examined this data very carefully to understand how the cast of the very wealthy changes over the years. In 2016 to enter the world’s wealthiest 50 one needed a wealth of £12.6 billion; to be in the UK top 1,000 the entry level was £103 million, while to enter the Irish top 250 one needed wealth of £42 million.
For our analysis:
• The basic technique of the Florentine study is used – the earliest Sunday Times Rich List data is compared with the latest.
• Individual names are checked for origin and those in the most recent list for relationships with those in the older list.
• Where rich people have entered the UK from abroad, they have been allocated to a separate category.
• Income sources have been categorised, refining the Sunday Times categorisation.10
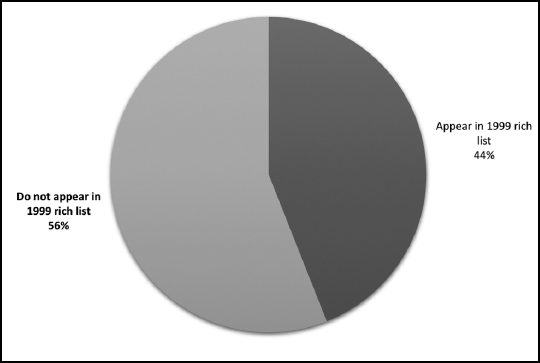
The first analysis is of the global rich list. What it shows is that more than half (56%) of those in the global rich list in 2016 were not in (or were not descendants of those in) the 1999 global rich list. This is shown in Figure 8. So in less than one generation (about 25 years) more than half those in the global rich list drop out.
This compares with the top 50 for the UK (Figure 9) which shows that only 46% of those in the top 50 list in 2016 were not in the top 1000 in 1998. Moreover, of the 46%, 12% migrated to the UK during this period and so might possibly also have been on the list had they been in the country. Meanwhile, the bottom 50 of the top 1,000 show, as might be expected, that the majority are new entrants to the list between 1998 and 2016. Only 14% of the bottom 50 in the top 1,000 in 2016 were in the top 1,000 in 1998, though a further 8% had migrated to the UK during the period and might possibly have been on the list had they been in the UK.
Although the level of churn in the UK list is slightly less than that in the global list, it is still significant – nearly half in much less than one generation.
Figure 8. Entrenchment in the global rich list 2016 (top 50)
Source: Cebr analysis of Sunday Times Rich List.
Figure 9. Entrenchment in the UK rich list 2016 (top 50)
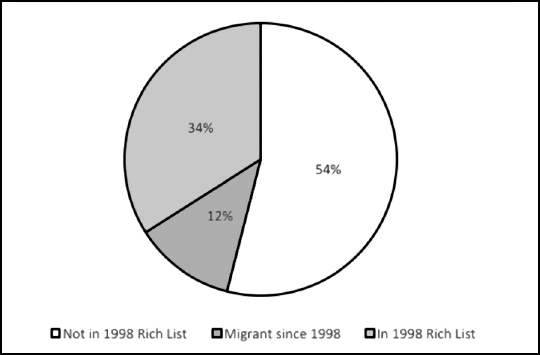
Source: Cebr analysis of Sunday Times Rich List.
Figure 10. Entrenchment in the UK rich list (top 1000)
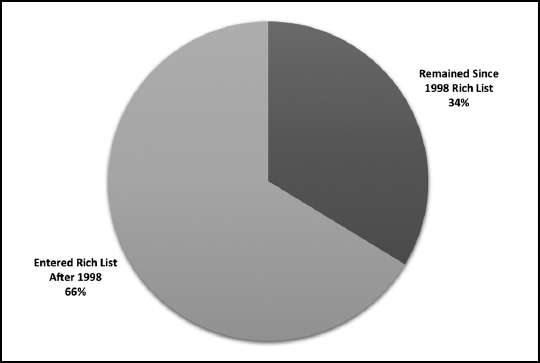
Source: Cebr analysis of Sunday Times Rich List.
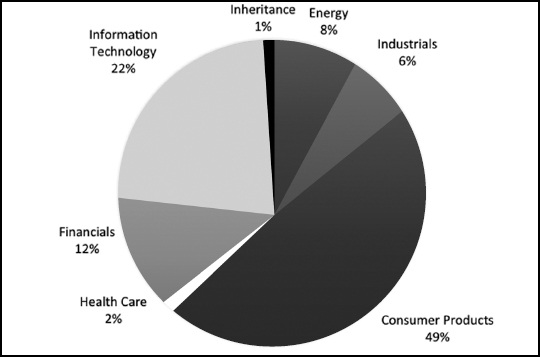
Figure 11. Sources of wealth in the global rich list, 1999
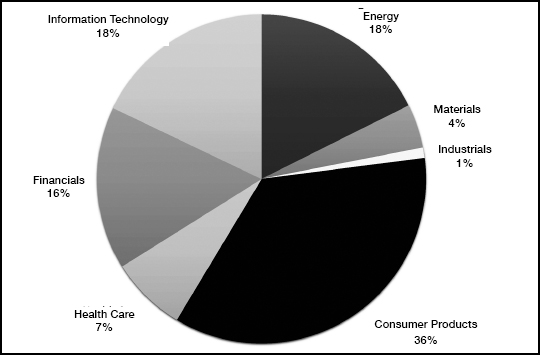
Source: Cebr analysis of Sunday Times Rich List.
Figure 12. Sources of wealth in the global rich list, 2016
Source: Cebr analysis of Sunday Times Rich List.
Figure 10 shows the degree of entrenchment for the whole UK top 1,000 rich list, showing that only 34% of the people and families in the Rich List in 2016 were on the list in 1998. Although the top 1,000 are just a subset of the very richest people, this does support (though not prove) the conjecture that in a country like the UK, the very rich are a changing cast of people.
The next analysis, in Figures 11 and 12, shows the changing sources of wealth for the global top 50. It is interesting to see how the largest single category is consumer products in both 1999 and 2016. But the role of consumer products is significantly larger in 2016. Meanwhile the importance of oil and mining barons has reduced from 22% to 8%. Tech has grown as the main source of wealth for the global top 50 from 18% in 1999 to 22% in 2016. Both the last two results might be partly a function of the state of the cycle for the oil, commodities and tech sectors.
The equivalent analysis for the UK shows an extraordinary concentration of wealth on property. UK property prices have risen dramatically over the period, catalysed by tight planning regulation. This has almost certainly added to inequality and the data supports one of the themes of this book – that one of the causes of inequality in many countries is high and rising property values driven by tight planning regulations.
A causal analysis of wealth in Hong Kong shows a similar result – a disproportionate amount of the benefit of economic growth in Hong Kong goes to those who own the land.
All this analysis is important. It means that a surprisingly small proportion of wealth is inherited – a much greater proportion is created. Although it often takes more than one generation to create wealth, with the fortunes being made in e-businesses this is starting to change and increasing proportions of the rich list are first generation.
‘Superbabies’11
I mentioned above that the results from the Federal Reserve Bank of St Louis indicate that generations pass on levels of earning more than wealth. One potential cause is homogamy which generates Type 4 Inequality. This is the tendency for people to seek out partners similar to themselves. Its prevalence has increased sharply with the growth of women going to university since the Second World War. As universities stopped being largely male institutions they became one of the most important places for people to meet their future partners. An article in the Independent reports on research on this in the US:12 ‘Dan Kopf of the blog, Priceonomics, analysed US Census data and found that the percentage of Americans who marry someone within their own major is actually fairly high.’
Moreover, 71% of college graduates in the US marry other college graduates.13And there are many studies showing how poverty and parenting can interact to make it extremely difficult for social mobility to emerge.14 It is important to note here that pointing out that poverty and less good parenting are correlated is not to imply a moralistic view. Indeed, on any measure of results achieved in relation to resources available, the achievements of many parents in poverty can often be seen as not far short of miraculous. But they are frequently struggling against heavy odds. It is also important to note that this analysis is not meant to be an argument against women going to university; logically it could just as much be an argument against men going there.
One of the consequences of tertiary co-education is that men and women increasingly meet immediately after leaving home and hence partner people of similar background and education. So those with the highest IQ have partners with equally high IQ. The result is ‘superbabies’. Quite apart from their genetic inheritance, they have parents with strong parenting skills. The combination entrenches a meritocracy and is hard to shake off, even though this book contains evidence that fortunes tend eventually to dissipate through consumption running ahead of income for the inheritance generations. Even so, it still takes five generations for a fortune largely to disappear! And with ‘superbabies’ this process may weaken.
It used to be thought that equality of opportunity would solve most problems of inequality. But even in a system where state provision tries to equalise opportunity, differences in opportunities for children emerge from the different parenting skills of the parents. Belsky in an oft-cited work shows how the expected differences in background affect parents’ skills in bringing up children.15 Shaw shows how differences in parenting skills affect how children develop.16
When my father went to Edinburgh University during the war, very few women went to university unless they planned to be teachers.17 Even when I went to Oxford in 1969, Oxbridge undergraduate colleges were single sex and the number of women at my university was about a fifth of the number of men. Our amateur attempts to create de facto coeducation consisted of climbing over walls and through windows. But this has changed and at most universities in the UK now there are roughly equal numbers of women and men. The US (and most universities in the UK) were well ahead of Oxford and Cambridge as were many Continental European universities.
Nowadays most universities worldwide, other than in some emerging economies, coeducate women and men. Huber and Fieder comment: ‘We find a very high prevalence of educational homogamy in all investigated countries irrespective of the women’s education. In almost all censuses, peak sample sizes occurred in homogamous and minimum sample sizes in the most heterogamous mating patterns, particularly in the highest and lowest educated women.’18
This is important because for those people who go to university, this is often their first time away from home and there is a considerable chance, given the ages at which they go to university, that they will meet their future partners there. One of the consequences is that the children of those at the best universities have two parents who are superbly equipped to bring them up. So apart from inheriting intelligence (the latest studies say that between 40% and 75% of intelligence is inherited19) their children benefit from highly competent parents as well. So they get the best nutrition, exercise, early schooling20 and of course intelligent conversation at an early age.
We are creating a generation of ‘superbabies’ who are likely to hoover up many of the key opportunities. The only way to handle the increasing impact of this is to work hard at leaning into the wind to provide opportunities for those whose background is disadvantaged, especially in education. The best teachers need to go to the worst schools – though that is much easier to say than to make happen.
Conclusions
The conclusions of both the St Louis Fed study and the Sunday Times Rich List study suggest that in Anglo-Saxon countries at least, wealth is transferred much faster than in Florence. The Fed study shows that after as few as five generations, the transmission of wealth is such that only 5% persists. So clogs to clogs does happen, only it takes five generations, not three.
Obviously part of this reflects inheritance taxation, yet in the US the tax exemption for inheritance tax at federal level is $5.45 million per person (so if assets are jointly owned the effective allowance could be $10.9 million) though in about half the states there are additional local estate or inheritance taxes. Note that these tax exemptions are for US citizens only – if you are foreign the limit is only $60,000 so if you are foreign and near the end of your life, the US is to be avoided. The rate of tax on more than roughly $1 million of taxable inheritance is 40%.
Most of the failure of wealth to persist, however, must reflect the fact that inherited wealth tends to discourage earnings and to encourage consumption. Clogs to clogs in three generations is surprisingly close to the truth.
But the more important part of the St Louis study is that incomes persist much longer than wealth. This is important because it tells us that the benefits of culture and education which get passed through generations are much more persistent than wealth itself.
The way in which the best educated create ‘superbabies’ with the best nutrition, education and parenting also emphasises the need to reform education so that the best teachers go to the schools with the most disadvantaged pupils.