1 Introduction to SAP BusinessObjects Web Intelligence
The SAP BusinessObjects Business Intelligence 4.2 delivers the most complete BI platform yet, with several important improvements frequently requested by business users. Building on the progress achieved in the 4.0 and 4.1 releases, Web Intelligence in SAP BusinessObjects BI 4.2 continues to strengthen an already powerful enterprise reporting platform with key enhancements that will take your reports to an all new level.
The industry’s most powerful business intelligence ad hoc query and analysis reporting tool is now stronger than ever with the release of SAP BusinessObjects BI 4.2. On the surface, the interface may seem exactly the same as in versions 4.0 and 4.1. But take a closer look and you’ll find even more functionality to help you get the most out of your SAP HANA investments, perform better geographic analysis with new map components, and provide an even more intuitive tool to business users to drill into business data in reporting documents. SAP BusinessObjects Web Intelligence 4.2 (which we refer to as Web Intelligence) comes with a new collection of geocharts for natively creating maps in reporting documents. Combining this important new visual capability with the growing number of chart styles truly gives users more capabilities than ever before and further blurs the lines among reports, data stories, and dashboards.
Web Intelligence delivers an ideal self-service reporting experience with the capability to connect directly to live data in an SAP HANA view with SAP HANA Online, utilize the SAP Business Explorer (SAP BEx) queries, access analysis views generated from SAP BusinessObjects Analysis workspaces for multidimensional reports, or access traditional relational databases through SAP BusinessObjects universes. Connecting directly to SAP’s revolutionary high-performance analytical appliance, SAP HANA, with Web Intelligence allows you to bypass the need for a universe to connect to SAP HANA before creating reports. In version 4.2, perhaps the most requested data source since Desktop Intelligence was retired—behold Freehand SQL. Users can now leverage the countless reporting features of Web Intelligence to create highly formatted reports by writing their own SQL scripts rather than using a traditional universe.
Web Intelligence provides business users with the tools to make better decisions and offer deeper insight into company data. The major benefits include the ability to drill, pivot, chart, track changes, publish, schedule, and share business information online and within a single online portal. The combination of an enhanced Report Panel, seamless connectivity to an extensive list of data sources, and the capability to contain vast amounts of data makes Web Intelligence the premier tool of choice for analyzing data.
This chapter introduces you to the key features and core functionality of the Web Intelligence reporting tool.
1.1 Features of Web Intelligence 4.2
Web Intelligence has been known for many years by report developers as “WebI” (pronounced “webby”). It’s best known as a highly intuitive, web-based query and analysis tool that provides business users with the capability to create and modify queries without having to write a single line of SQL. But if writing SQL is your thing, Web Intelligence is your tool.
Because Web Intelligence reduces the complexity of report building, business users have unprecedented opportunities to analyze and leverage company information. Self-service business intelligence has become a reality in Web Intelligence 4.2, which boasts an enhanced Report Panel designed for more intuitive report development and data interaction. Reporting documents are published and shared through the BI Launch Pad portal, a convenient and efficient way of distributing reports to users across the enterprise.
This means that report viewers of every skill level can easily leverage Web Intelligence to analyze and interact with data to solve business problems. In the coming chapters, we discuss in great detail all of the features this tool provides.
In the following sections, we discuss the core product functionality of Web Intelligence, including its six primary functions (query, report, analyze, share, customize, and integrate).
1.1.1 Core Product Functionality
The primary function of Web Intelligence is two-fold: to provide the capability to query a set of data without any knowledge of the SQL language, and to interactively analyze data to further restrict, expand, and modify the way information is displayed and delivered. After data is retrieved, formatting can be easily applied to present results in a variety of customized formats.
The data retrieved with Web Intelligence is displayed in the report section by using components known in the tool as Report Elements. The Report Element component templates included are:
- Tables: The most common methods of displaying data are with vertical and cross tables, also known as pivots.
- Cell: Blank cells commonly used for titles and pre-defined calculations, such as last refresh date and page numbers.
- Charts: 34 different chart types include three geographic charts introduced to Web Intelligence in SAP BusinessObjects BI 4.2.
After refreshing a report query’s results, you can easily visualize the data by inserting report elements and result objects into your reports.
You can quickly organize reports by inserting breaks or sections to group the data displayed in a table. You’ll also be able to restrict each block of data to a customized result set by applying block-level or report-level filters with just a few clicks of the mouse. An extensive set of shortcut icons are provided in the ribbon toolbar to assist with frequently used customizations. These icons are located at the top of the screen in the Web Intelligence design mode and are grouped into three toolbars.
When you’re ready to share your work, you can easily publish your documents to the BI Launch Pad. Users across the enterprise will then have the opportunity to view and interact with your reports by logging on to the BI Launch Pad through a web browser without any installation requirements.
Extended interaction is available to users by right-clicking on a report or report element for on-the-fly modification and customization in design mode.
Let’s consider the primary functions of Web Intelligence:
-
Query
Building queries in Web Intelligence is easier than in previous versions of this software. Through its intuitive and common interface, you can easily query any data source as follows, without knowledge of its underlying data structures or technical language (SQL, MDX):- Query relational, multidimensional or linked universes created with Universe Design Tool or Information Design Tool.
- Use web services, text files, and Microsoft Excel spreadsheets as data sources.
- Get easy, direct access to InfoCubes through SAP BEx queries.
- Connect directly to an SAP HANA view or live data with SAP HANA online mode.
- Select a relational connection as a data source and write your own query by using the free-hand SQL option when creating a new Web Intelligence document.
-
Report
Over the course of this book, you’ll learn to create everything from simple reports to complex analysis documents with multiple report tabs. You can unlock the full potential of Web Intelligence 4.2 by using the built-in editing and formatting features available for presenting data quickly and accurately. Reporting with Web Intelligence is also very flexible and intuitive. Never again will your reporting solution cause the bottleneck in your BI solution. Add maps to reports for a geographical view of your data and create highly formatted views of data from practically any data source. Reporting features include the following:- Powerful charting engine for creating highly customized visual reports.
- Geographical charting components for displaying data with maps.
- Enhanced reporting styles.
- Add hyperlinks and element links to report objects.
- Add references to specific cells.
- Export your data to different file formats (PDF, XLS, TXT, CSV).
-
Analyze
Web Intelligence 4.2 enables you to provide deep analysis, deliver valuable analytical reports to the user community, and become a more insightful analyst and subject matter expert (SME) with your clients’ data. You can perform detailed, specific analyses with an extensive set of options, as follows:- Learn how to use drill filters, report filters, and block filters to filter your report.
- Set up input controls and input control groups for more intuitive on-the-fly analysis.
- Discover the extensive list of out-of-the-box report functions and contexts available for creating precise variables and formulas.
- When multiple queries are included in a single document, you can merge dimensions or variables from multiple data sources to synchronize them.
- Analyze hierarchical datasets sourced from multidimensional data sources (SAP BEx queries, SAP HANA, multidimensional universes, etc.).
-
Share
For collaborative analysis, Web Intelligence can leverage several capabilities proposed by the BI platform:- Save your Web Intelligence documents to the BI Launch Pad portal. You can organize them within the default folder structure, within a folder-like structure known as categories, or through BI workspaces (previously known as the Dashboard Builder).
- Schedule a document refresh and distribute your documents to different destinations like BI platform user inboxes, external emails, file systems, or FTP.
- They can also be broadcasted and personalized to many recipients (either internal or external to the BI platform) through publications.
- Discuss documents with others users by leaving comments.
-
Customize
Have you ever wanted to create professional Web Intelligence report dashboards that are customized to fit the color and style of your client? With SAP BusinessObjects BI 4.2, this can be achieved easier and more proficiently than ever before. Build fresh, innovative, interactive, and data-rich documents that meet any organization’s style requirements while also delivering powerful BI.
Web Intelligence offers flexibility to developers, partners, and OEM through a full software development kit, which includes the following services:- Web Intelligence REST Web Services, to programmatically perform any workflow.
- Web Intelligence extension, to extend Web Intelligence user interface.
- Web Intelligence custom elements (see Chapter 6, Section 6.5, for more information).
- Web Intelligence custom formulae, to add your own calculation in Web Intelligence formula language.
-
Integrate
Web Intelligence integrates with the whole SAP landscape. As the most used analytical product of the BI platform, it is supported by tools such as the SAP BusinessObjects BI Launch Pad, Promotion Management, Upgrade Management Tool, and the Translation Management Tool.
From data sources point of view, it can query a variety of SAP data sources such as SAP BW, SAP HANA views, SAP BusinessObjects Analysis for online analytical processing queries, and universes created with Information Design Tool or Universe Design Tool.
Finally, you can leverage Web Intelligence content from SAP Live Office (see Chapter 23), SAP Mobile (see Chapter 24), SAP Business Objects BI Launch Pad workspaces or generate web services for use as consumable data sources by other SAP products, such as SAP BusinessObjects Dashboards. There are also other methods to share your Web Intelligence documents.
These areas describe the capabilities of Web Intelligence and are the focus of this book. Throughout the next chapters, we discuss every aspect of building and editing reports.
1.1.2 Reading Mode versus Design Mode
How you will use the Web Intelligence capabilities will depend on your profile. Web Intelligence has the following two main modes that corresponds to the two main workflows:
-
The Design mode is intended for power users who can create, edit, and manage documents. The Design mode gives you access to the full Web Intelligence core product functionalities described in previous section, as follows:
- Creating and editing queries
- Creating the document and the reports
- Formatting your dataset into tables, charts and setting their properties
- Creating input controls, filters, element linking
- Creating formulas, variables and references for advanced analysis
- Sharing report elements as shared elements
- As shown in Figure 1.1, the Design mode offers an exhaustive interface that gives you access to the full Web Intelligence capabilities.

Figure 1.1 Example Web Intelligence Report in Design Mode
-
The Reading mode is used for accessing and refreshing documents and content created by power users and report designers. Most report consumers will only need to read or view reports; however, in order to make better informed decisions as business users, you can refresh the data to get up to date datasets and document comments. While reading reports, users will have the opportunity to drill, filter, and export results to PDF, Excel, text or CSV files.
The Reading mode proposes a simplified interface that contains only the capabilities available in this mode. Figure 1.2 shows a custom-formatted Web Intelligence report with element link filters and a comment added to a bar chart in the BI Launch Pad.
The BI Launch Pad is the centralized web portal designed to provide access to all your BI content securely and within a single platform. Both Design and Reading modes are available in BI Launch Pad, which lets you view, refresh, create, modify, save, share, and analyze valuable company data from a single location within browser.
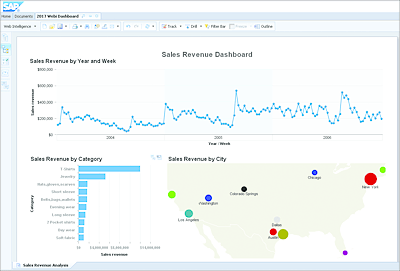
Figure 1.2 Example Web Intelligence Report in Reading Mode
Through security rights (see Appendix B), your administrator defines the actions you can access in Web Intelligence when you connect to the SAP BusinessObjects BI platform. This includes the Design or Reading mode, and also your access to the Web Intelligence clients, described in the following section.