Chapter 4

EC-GSM-IoT performance

Keywords

Bandwidth; Battery life; Capacity; Complexity; Coverage; Data rate; EC-GSM-IoT; Frequency reuse; Latency; Maximum coupling loss (MCL); Performance; Spectral efficiency; Throughput

4.1. Performance objectives

The design of the EC-GSM-IoT physical layer and the idle and connected mode procedures presented in Chapter 3 were shaped by the objectives agreed during the study on Cellular System Support for Ultra-low Complexity and Low Throughput Internet of Things [1], in this book referred to as the Cellular IoT study item, i.e.:
  1. • Maximum coupling loss (MCL) of 164   dB
  2. • Data rate of at least 160 bits per second
  3. • Service latency of 10   s
  4. • Device battery life of up to 10   years
  5. • System capacity of 60,000 devices/km2
  6. • Ultra-low device complexity
During the subsequent standardization of EC-GSM-IoT [2] it was, in addition, required to introduce necessary improvements to enable EC-GSM-IoT operation in a spectrum deployment as narrow as 600   kHz.
While presenting the EC-GSM-IoT performance for each of these objectives, this chapter introduces the methodologies used in the performance evaluations. Similar methodologies are used in the LTE-M and NB-IoT performance evaluations presented in Chapters 6 and 8, respectively.
The results and methodologies presented in this chapter are mainly collected from 3GPP TR 45.820 Cellular System Support for Ultra-low Complexity and Low Throughput Internet of Things [1] and TS 45.050 Background for Radio Frequency (RF ) requirements [3]. In some cases, the presented results are deviating from the performance agreed by 3GPP, for example, because of EC-GSM-IoT design changes implemented during the normative specification phase subsequent to the Cellular IoT study item and the publishing of 3GPP TR 45.820. These deviations are minor and the results presented in this chapter have to a large extent been discussed and agreed by the 3GPP community.

4.2. Coverage

One of the key reasons for starting the Cellular IoT study item was to improve the coverage beyond that supported by GPRS. The target was to exceed the GPRS MCL, defined in Section 2.2.5, by 20   dB to reach a MCL of 164   dB. Coverage is meaningful first when coupled with a quality of service target and in the Cellular IoT study items it was required that the MCL was fulfilled at a minimum guaranteed data rate of 160 bits per second.
To determine the EC-GSM-IoT MCL, the coverage performance of each of the EC-GSM-IoT logical channels is presented in this section. The section also discusses the criteria's used to define adequate performance for each of the channels at the MCL and the radio-related assumptions used in the evaluation of their performance. In the end of the section the achieved MCL and data rates are presented.

4.2.1. Evaluation assumptions

4.2.1.1. Requirements on logical channels

4.2.1.1.1. Synchronization channels
The EC-GSM-IoT synchronization channels, i.e., the Frequency Correction CHannel (FCCH) and Extended Coverage Synchronization CHannel (EC-SCH), performance is characterized by the time required by a device to synchronize to a cell. During the design of EC-GSM-IoT, no explicit synchronization requirement was defined, but a short synchronization time is important in most idle and connected mode procedures to provide good latency and power-efficient operation.
While the FCCH is defined by a sinusoidal waveform, the EC-SCH is a modulated signal that contains cell-specific broadcast information that needs to be acquired by a device before initiating a connection. Beyond the time to synchronize to a cell also the achieved Block Error Rate (BLER) is a good indicator of the EC-SCH performance. A 10% BLER is a relevant target for the EC-SCH to provide adequate system access performance in terms of latency and reliability.
4.2.1.1.2. Control and broadcast channels
The performances of the control and broadcast channels are typically characterized in terms of their BLER. A BLER level of 10% has traditionally been targeted in the design of GSM systems [4] and is well proven. At this BLER level, the Extended Coverage Packet Associated Control Channel (EC-PACCH), Extended Coverage Access Grant Channel (EC-AGCH), Extended Coverage Paging Channel (EC-PCH), and the Extended Coverage BroadCast CHannel (EC-BCCH) are considered to achieve sufficiently robust performance to support efficient network operation.
For the Extended Coverage Random Access CHannel (EC-RACH), a 20% BLER is a reasonable target. Aiming for a higher BLER level on the EC-RACH than for the downlink Extended Coverage Common Control CHannels (EC-CCCH/D), which delivers the associated assignment of resources, or pages a device, reflects that this is a best effort channel where it is not critical if a device needs to perform multiple attempts before successfully accessing the system. Furthermore, because the EC-RACH is a collision-based channel, using a slightly higher BLER level operating point will support an efficient use of the spectrum and will increase the utilization of the channel capacity.
4.2.1.1.3. Traffic channels
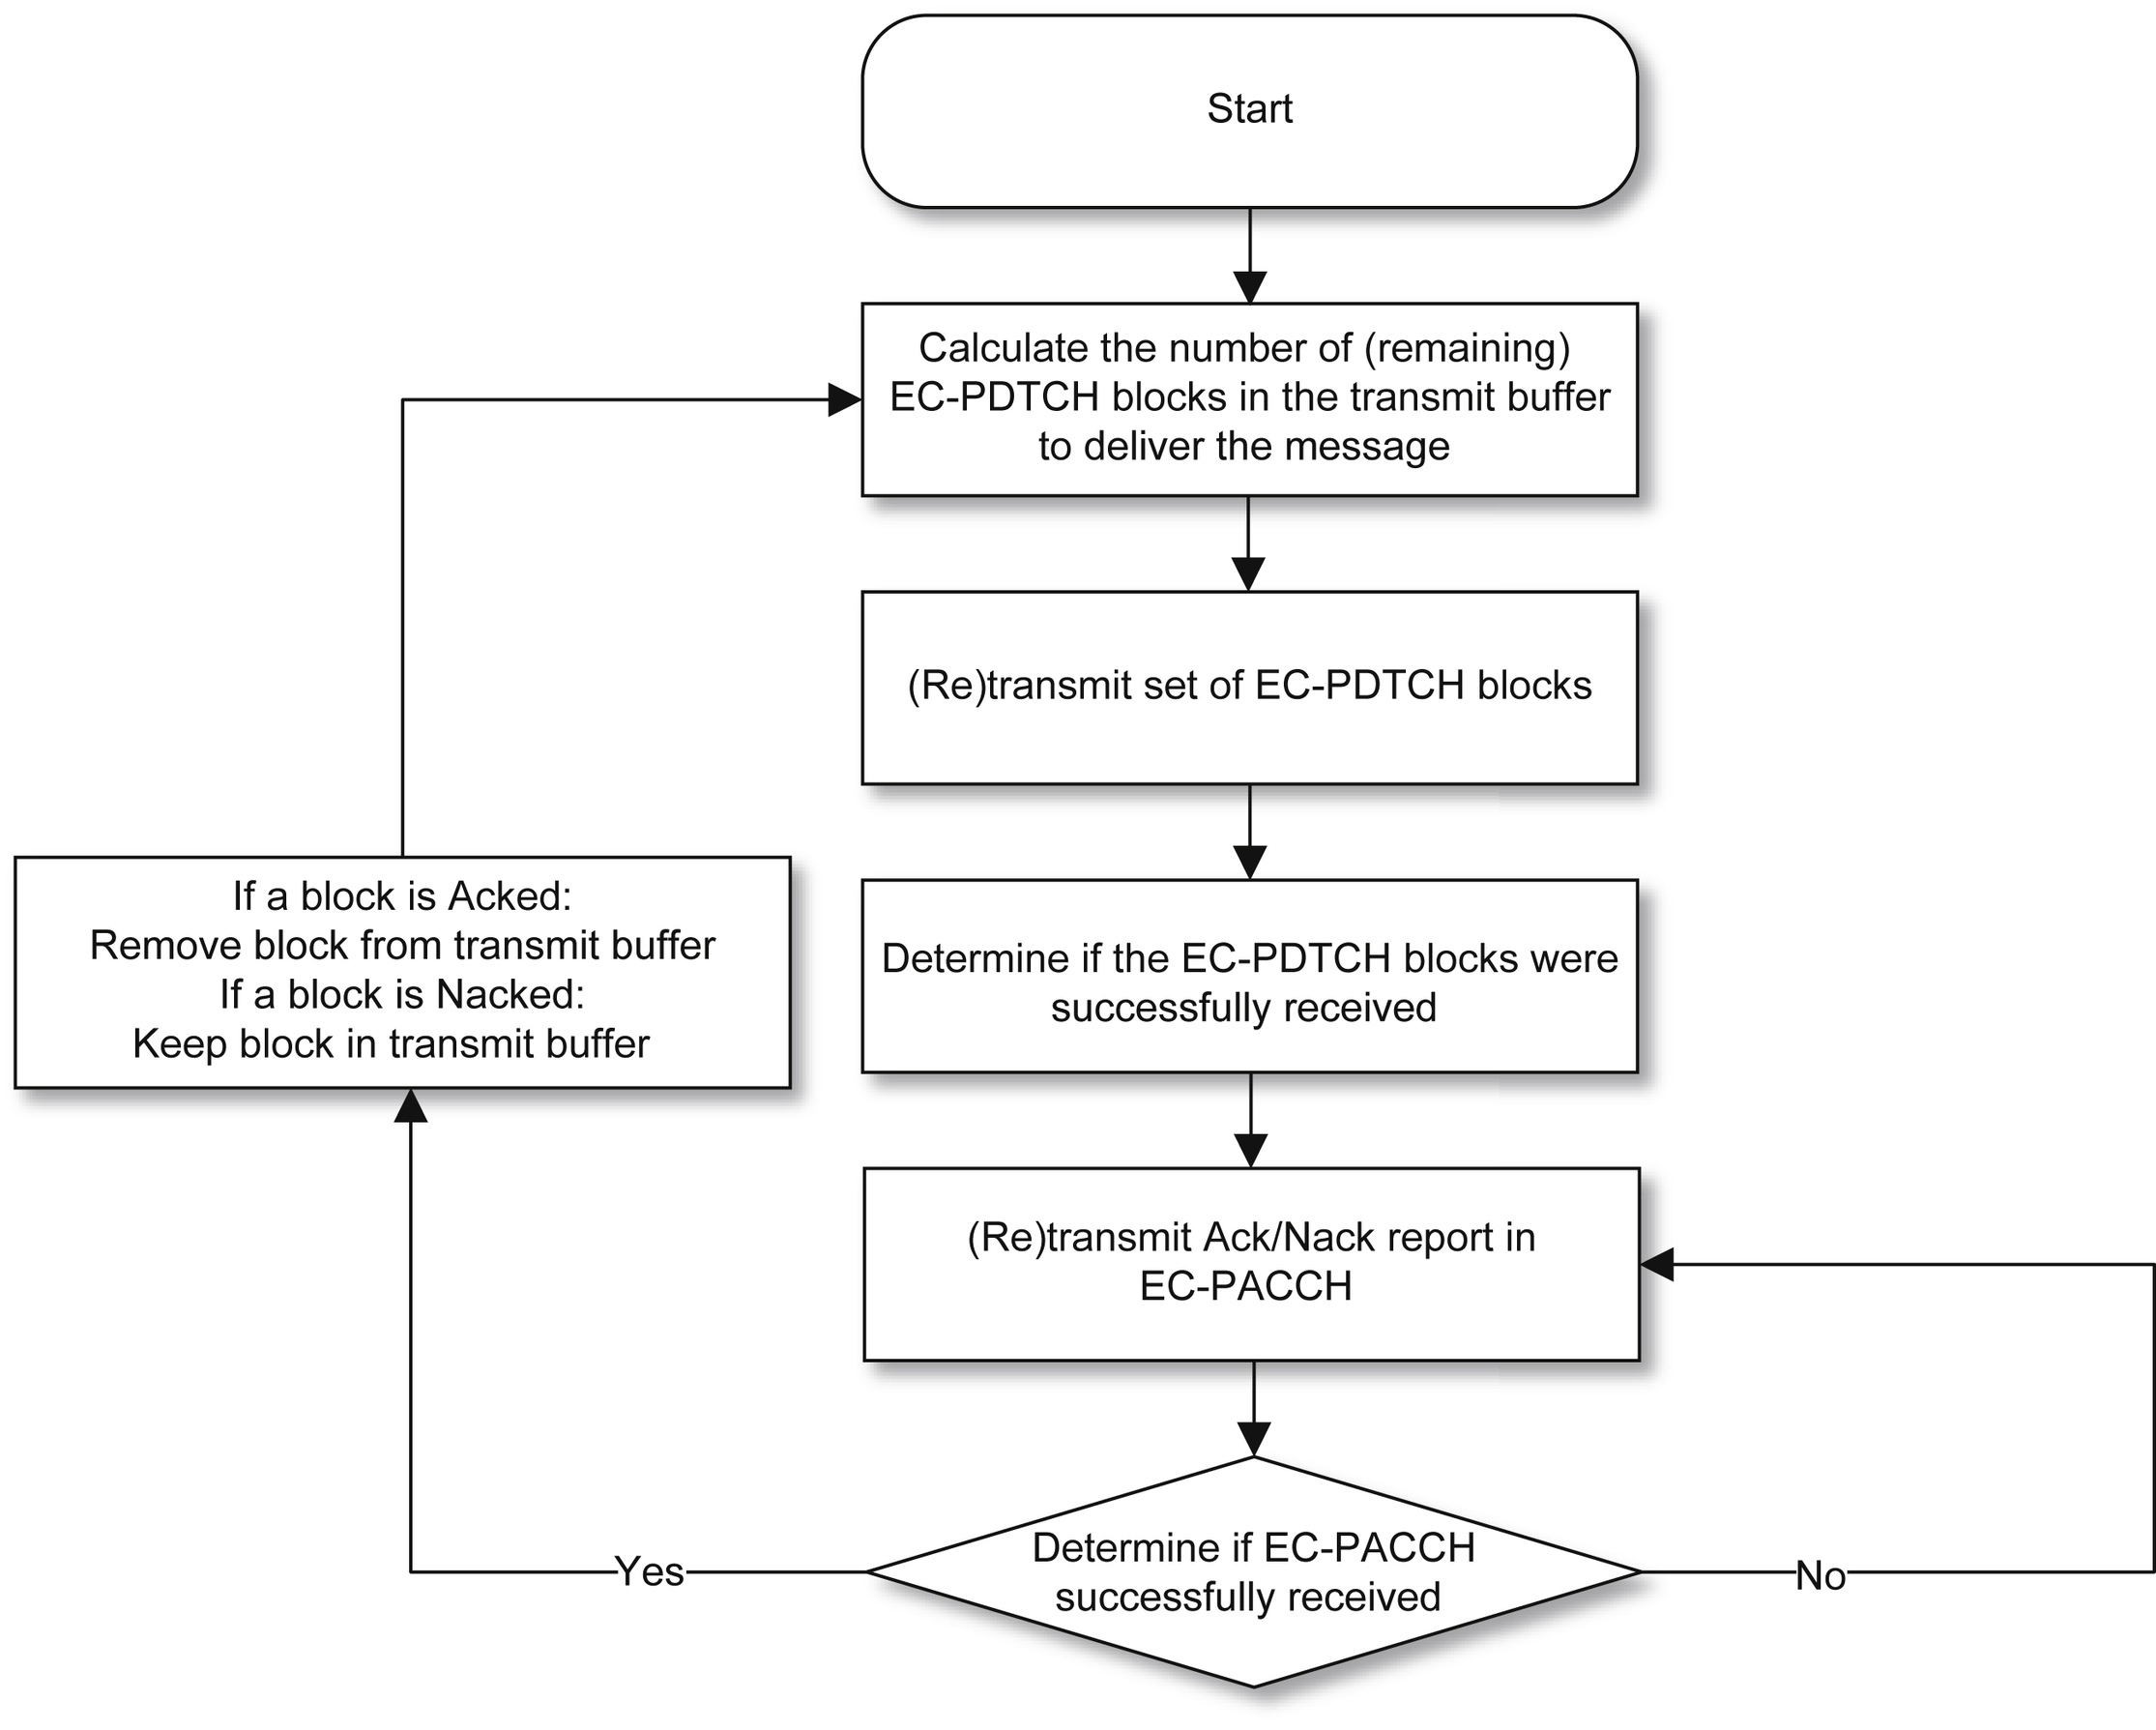
For the Extended Coverage Packet Data Traffic CHannel (EC-PDTCH) data rate is a suitable design criterion. EC-GSM-IoT uses, besides blind transmissions, hybrid automatic repeat request (HARQ) to achieve high coupling loss, as explained in Section 3.3.2.2. To use HARQ efficiently, an average EC-PDTCH BLER significantly higher than 10% is typically targeted. To derive the achievable EC-PDTCH coupling loss and data rate, the HARQ procedure needs to be evaluated. The high-level HARQ process flow, in terms of EC-PDTCH data packets transmitted in one direction and EC-PACCH HARQ feedback transmitted in the opposite direction, is depicted in Fig. 4.1.
As a response to each set of transmitted EC-PDTCH blocks, an EC-PACCH control block is transmitted to positively acknowledge (Ack) or negatively acknowledge (Nack) the reception of the EC-PDTCH block. Failed blocks are retransmitted. At each stage shown in Fig. 4.1, both total processing delays and transmission times are incremented to derive the total latency associated with the HARQ transmission of an uplink or downlink report. To generate reliable performance results, and to construct a cumulative distribution function (CDF) of the EC-PDTCH HARQ latency, a large number of instances of the HARQ packet flow was simulated. The latency achieved at the 90th percentile (i.e., the time below which 90% of the simulated reports are delivered) is used in the EC-PDTCH performance evaluations presented later in this chapter.

4.2.1.2. Radio-related parameters

To derive the noise level in the receiver, the ideal thermal noise density at 300   K, or 27   °C (174   dBm/Hz; see Section 3.2.8.1), in combination with a device noise figure (NF) of 5   dB and a base station NF of 3   dB are used. These NFs are assumed to correspond to realistic device and base station implementations although it needs to be stressed that the NFs between different implementations can vary substantially, even between units using the same platform design.
An initial frequency offset in the device of 20   ppm when synchronizing to the FCCH and EC-SCH is assumed. The source of this initial frequency error is described in Section 4.7.1. In addition to the initial frequency error, a continuous frequency drift of 22.5   Hz/s is assumed. This is intended to model the frequency drift expected in a temperature-controlled crystal oscillator-based frequency reference.
In terms of output power, it is assumed that the base station is configured with 43   dBm output power per 200   kHz channel. This corresponds to a typical GSM macro deployment scenario. For the device side a 33   dBm power class is assumed, which again corresponds to a common GSM implementation. Also, a new lower power class of 23   dBm is investigated. This power class is of particular interest because it is commonly understood to facilitate reduced device complexity, as elaborated on in Section 4.7.4.
For the evaluation of the EC-PDTCH coverage the MCS-1 (modulation and coding scheme 1) is used. MCS-1 uses Gaussian Minimum Shift Keying (GMSK) modulation and a code rate of roughly 0.5, which makes it the most robust EC-GSM-IoT MCS. Each MSC-1 block carries 22 bytes of payload.
An overview of the radio related simulations assumptions used in the EC-GSM-IoT performance evaluations is given in Table 4.1.

Table 4.1

Simulation assumptions for EC-GSM-IoT coverage performance.
Parameter Value
Frequency band 900   MHz
Propagation condition Typical Urban (TU)
Fading Rayleigh, 1   Hz
Device initial oscillator inaccuracy 20   ppm (applied in FCCH/EC-SCH evaluations)
Device frequency drift 22.5   Hz/second
Device NF 5   dB
Base station NF 3   dB
Device power class 33   dBm or 23   dBm
Base station power class 43   dBm
Modulation and coding scheme MCS-1

4.2.1.3. Coverage performance

Table 4.2 presents the downlink coverage performance for each of the logical channels according to the evaluation's assumptions introduced in Section 4.2.1. The coverage is defined in terms of the MCL as:
M C L = P T X ( S N R + 10 l o g 10 ( k · T · B W ) + N F )
image (4.1)
The power (P TX ), the operating SNR, the signal bandwidth (BW) and the receiver NF are all given in Table 4.2. T equals an assumed ambient temperature of 290   K, and k is Boltzmann's constant.
The FCCH and EC-SCH synchronization performance is presented in terms of the time required to synchronize to a cell at the MCL of 164   dB, taken at the 90th percentile of the synchronization acquisition delay CDF. The control and broadcast channels performances are presented as the MCL at which 10% BLER is achieved.
For the EC-PDTCH/D Table 4.2 presents a MAC-layer data rate of 0.5   kbps achieved at the 90th percentile of the throughput CDF generated from a simulation modeling the HARQ procedure depicted in Fig. 4.1. In this case a 33   dBm device is assumed to feedback the EC-PACCH/U control information. The EC-PDTCH/D performance is also presented at 154   dB's coupling loss under the assumption of a 23   dBm device sending the EC-PACCH/U Ack/Nack feedback. In this case a MAC-layer data rate of 2.3   kbps is achievable. The 10-dB reduction in coverage is motivated by the 10   dB lower output power of the 23   dBm device. The presented data rates correspond to MAC-layer throughput over the access stratum where no special consideration is given to the SNDCP, LLC, RLC, and MAC overheads accumulated across the higher layers. Simplicity motivates the use of this metric, which is also used in the LTE-M and NB-IoT performance evaluations in Chapters 6 and 8.
The uplink performance is summarized in Table 4.3. Two device power classes are evaluated, i.e., 33 and 23   dBm. At 33   dBm output power, 164   dB MCL is achievable while for 23   dBm, support for 154   dB coupling loss is accomplished. Although the 164   dB MCL target is not within reach for the 23   dBm case, it is still of interest as the lower power class reduces device complexity. A low output power is also beneficial because it lowers the requirement in terms of supported power amplifier drain current that needs to be provided by the battery feeding the device with power. The presented EC-PDTCH/U MAC-layer data rates were derived based on the HARQ model depicted in Fig. 4.1.

Table 4.2

EC-GSM-IoT downlink Maximum Coupling Loss performance [1,7].
Channel/Parameter FCCH/EC-SCH EC-SCH EC-BCCH EC-CCCH/D EC-PACCH/D EC-PDTCH/D
Bandwidth [kHz] 271 271 271 271 271 271 271
Power [dBm] 43 43 43 43 43 43 43
NF [dB] 5 5 5 5 5 5 5
Performance 1.15   s 10% BLER 10% BLER 10% BLER 10% BLER 0.5 kbps 1) 2.3 kbps 2)
SINR [dB] -6.3 -8.8 -6.5 -8.8 -6.4 -6.3 3.7
MCL [dB] 164 166.5 164.2 166.5 164.1 164 154

image

Table 4.3

EC-GSM-IoT uplink maximum coupling loss performance [1,7,8].
Channel/Parameter EC-RACH EC-PACCH/U EC-PDTCH/U
Bandwidth [kHz] 271 271 271 271 271 271
Power [dBm] 33 23 33 23 33 23
NF [dB] 3 3 3 3 3 3
Performance 20% BLER 20% BLER 10% BLER 10% BLER 0.5   kbps 0.6   kbps
SINR [dB] -15 -15 -14.3 -14.3 -14.3 -14.3
MCL [dB] 164.7 154.7 164.0 154.0 164.0 154.0

image

The results in Tables 4.2 and 4.3 show that EC-GSM-IoT meets the targeted MCL requirement of 164   dB for a MAC-layer data rate of 0.5   kbps.

4.3. Data rate

Section 4.2 presents EC-PDTCH MAC-layer data rates in the range of 0.5–0.6   kbps and 0.5–2.3   kbps in the uplink and downlink, respectively. These data rates are applicable under extreme coverage conditions. To ensure a spectrally efficient network operation and a high end-user throughput, it is equally relevant to consider the throughput achievable for radio conditions sufficiently good to guarantee no or a limited level of block errors. Under such conditions, the network can configure the use of the highest supported modulation and coding scheme on the maximum number of supported time slots. Up to eight time slots can be supported by EC-GSM-IoT according to the 3GPP specifications, although it is expected that support for four or five time slots in practice will be a popular design choice.
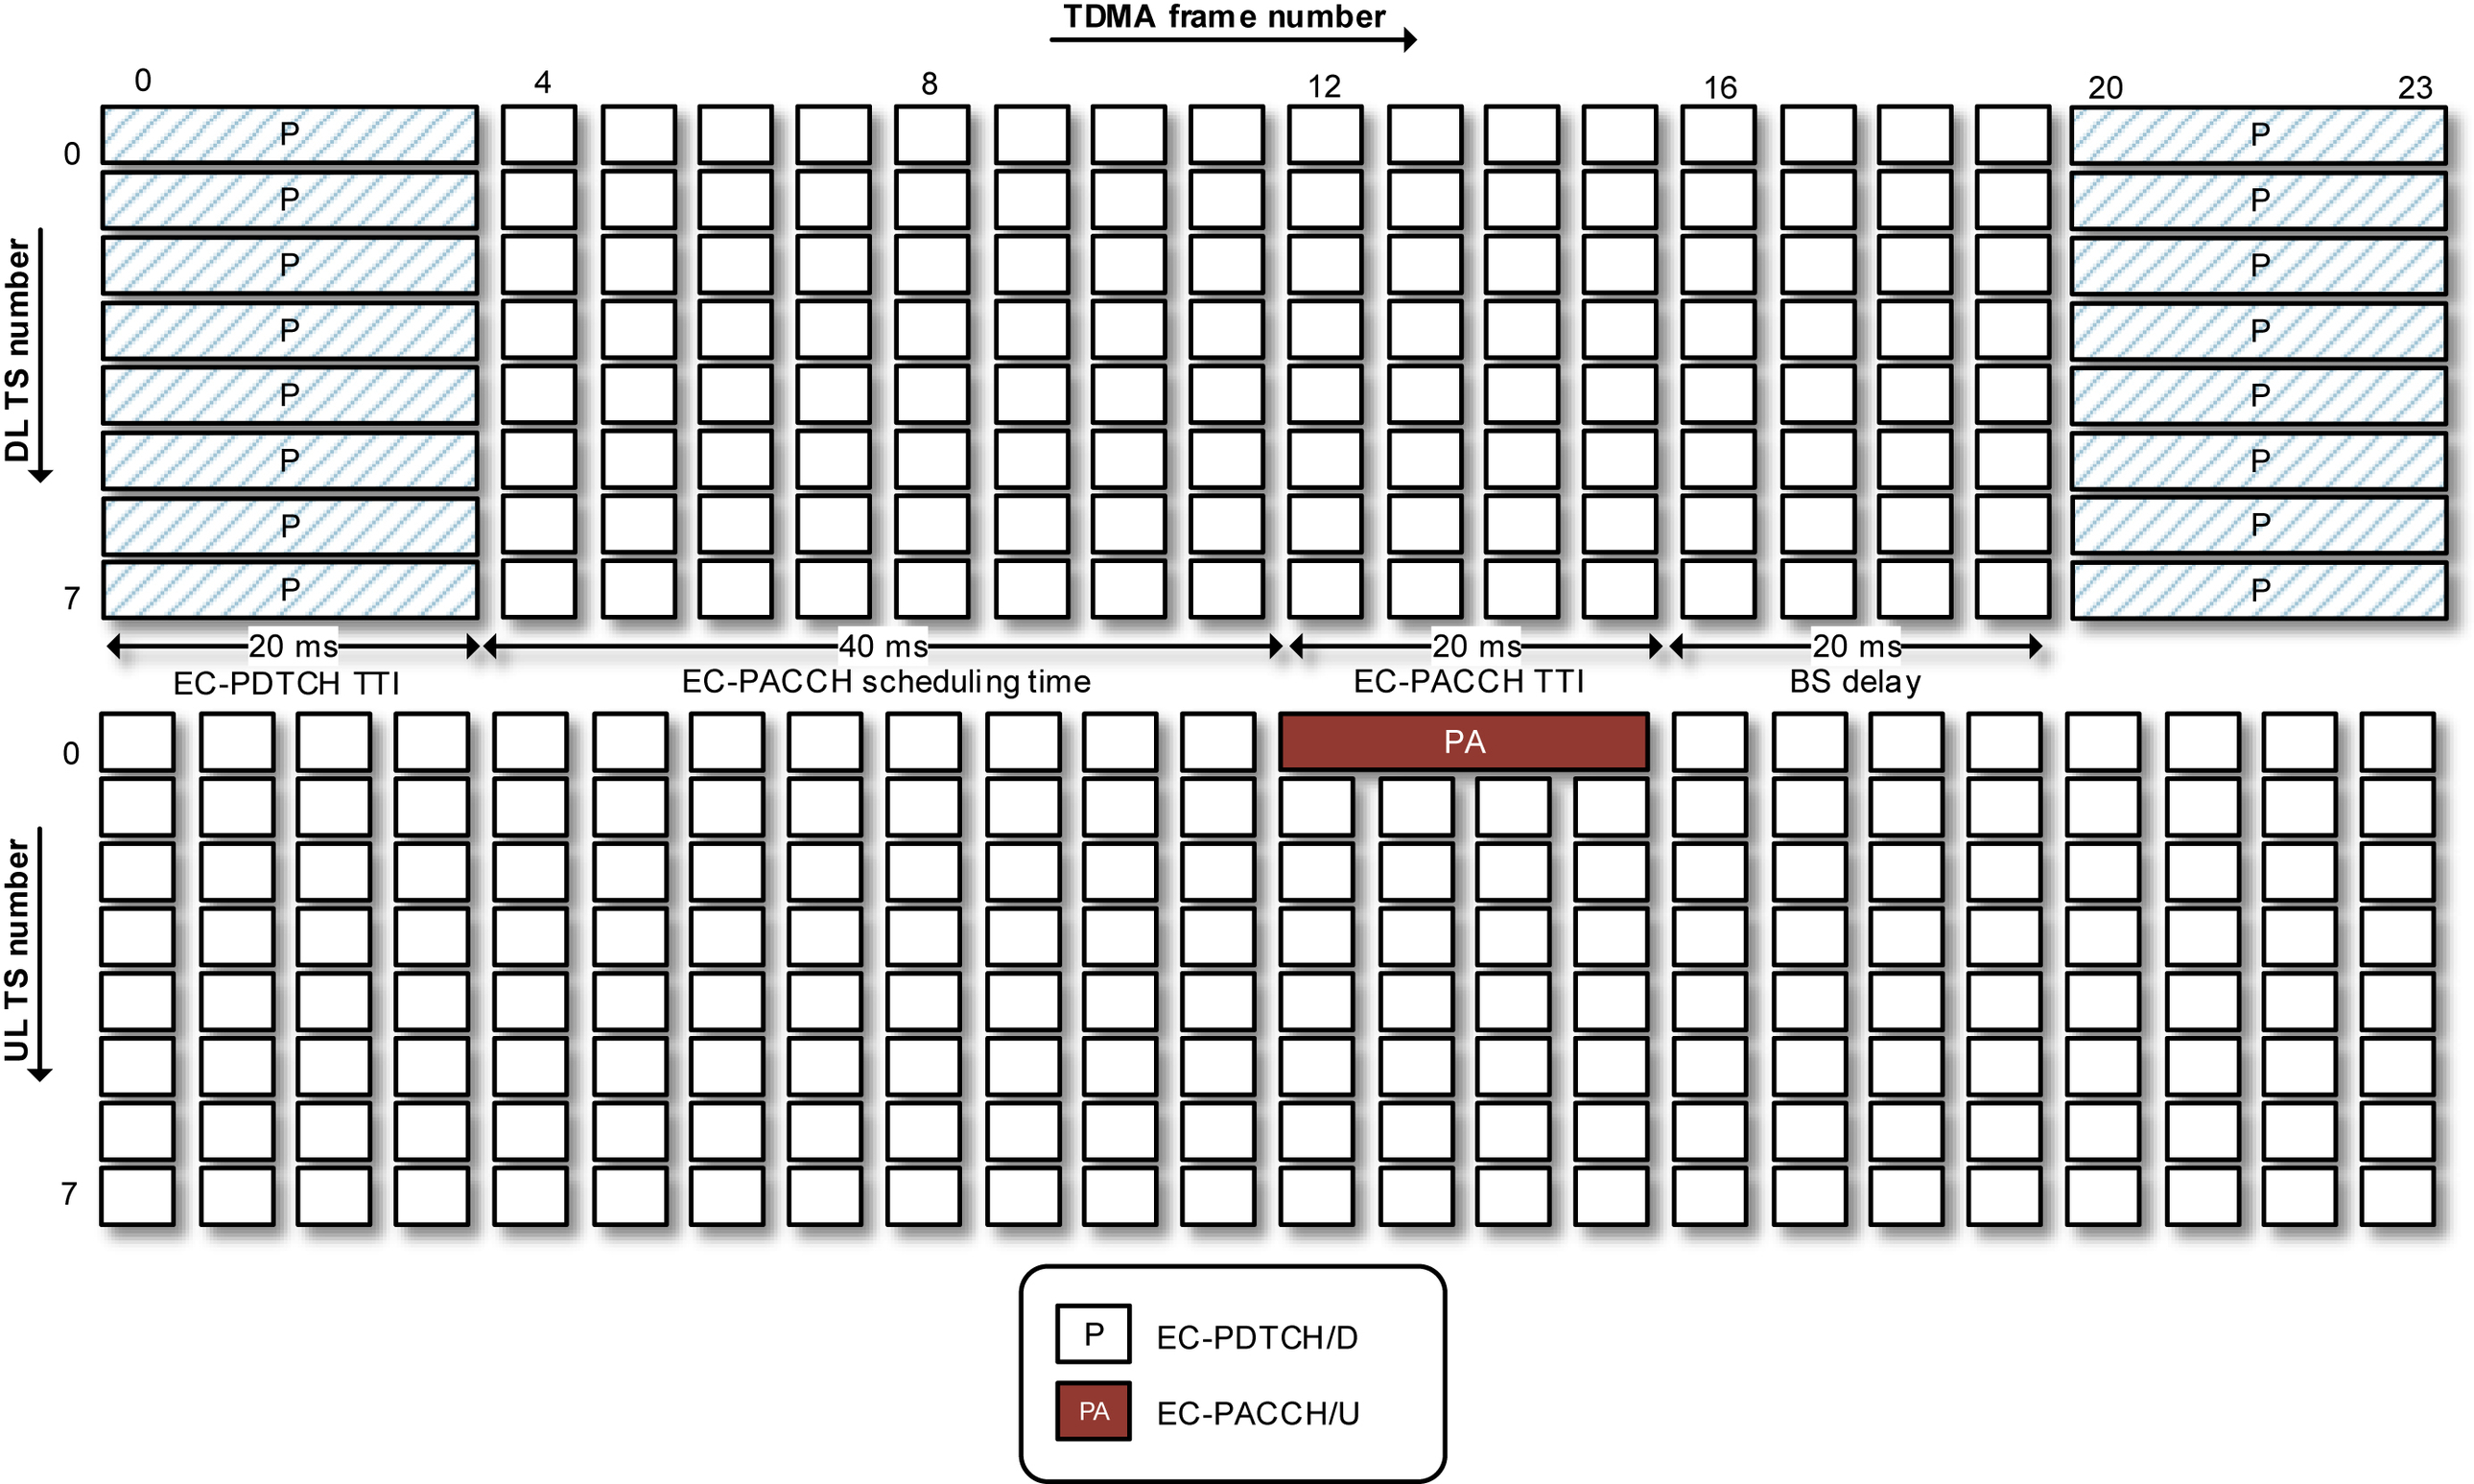
In the downlink, a device is dynamically scheduled on its assigned resources and a base station will in best case transmit eight MCS-9 blocks on the eight assigned time slots during four consecutive TDMA frames. Each MCS-9 block contains an RLC/MAC header of 5 bytes and two RLC blocks, each of 74 bytes. The maximum supported EC-GSM-IoT RLC window size of 16 limits the number of RLC blocks that at any given time can be outstanding with a pending acknowledgment status. The base station uses the RRBP field in the RLC header of the EC-PDTCH/D block to poll the device for a Packet Downlink Ack/Nack (PDAN) report. The device responds earliest 40   ms after the end of the EC-PDTCH/D transmission time interval (TTI) as illustrated in Fig. 4.2. Assuming that the base station needs 20   ms to process the PDAN report before resuming the EC-PDTCH/D transmission implies that eight MCS-9 blocks each of 153 bytes size can be transmitted every 100   ms. This limits the peak downlink MAC-layer data rate of EC-GSM-IoT to 97.9   kbps.
This data rate can be compared with the often referred to physical layer data rate of 489.6   kbps that can be reached across the EC-PDTCH/D 20   ms TTI. High data rates on link level can be translated into a high spectral efficiency, which is of importance for the system as a whole in terms of system capacity. For the individual device the support of a flexible range of data rates in combination with a proper link adaptation equates to improved latency and battery life when radio conditions improve.
In the uplink, EC-GSM-IoT uses the concept of Fixed Uplink Allocations (FUA) (see Section 3.3.2.1.2) to schedule traffic. For devices supporting 8PSK the best performance is achieved when eight MCS-9 blocks are scheduled on eight time slots. Again, the RLC window size of 16 sets a limitation on the number of scheduled blocks. After the EC-PACCH/D carrying the FUA information element has been transmitted, a minimum scheduling gap of 40   ms delays the EC-PDTCH/U transmission of the MCS-9 blocks as illustrated in Fig. 4.3. After the end of the EC-PDTCH/U transmission the timer T3326 [9] needs to expire before the network can send the next EC-PACCH/D containing an Ack/Nack report as well as a new FUA. Just as for the downlink, this implies that eight MCS-9 blocks can be transmitted every 100   ms. This limits the uplink peak MAC-layer data rate of EC-GSM-IoT to 97.9   kbps.
The EC-PDTCH/U peak physical layer data rate matches the EC-PDTCH/D 489.6   kbps across the 20   ms TTI. For devices only supporting GMSK modulation on the transmitter side, the highest modulation and coding scheme is MCS-4, which contains a RLC/MAC header of 4 octets and a single RLC block of 44 octets. In this case 16 MCS-4 RLC blocks can be scheduled during 40   ms every 120   ms leading to an uplink peak MAC-layer data rate of 51.2   kbps.
The EC-PDTCH/U peak physical layer data rate for a GMSK only device is limited to 153.6   kbps over the 20   ms TTI.
Tables 4.4 and 4.5 summarizes the findings of this and the previous section in terms of MAC-layer data rates supported at 164   dB MCL and the peak physical layer data rates experienced under error-free conditions. In addition, it presents the MAC-layer data rates simulated at coupling losses of 154 and 144   dB. For the 33   dBm device MCS-1 is providing the best performance at 164 and 154   dB coupling loss. At 144   dB coupling loss MCS-3 is the best choice in the uplink even when 8PSK is supported, while MCS-4 provides the highest data rate for the downlink. For the 23   dBm device MCS-1 is giving best performance at 144 and 154   dB. The evaluation assumptions used when deriving these performance figures are the same as presented in Section 4.2.1.

Table 4.4

EC-GSM-IoT data rates for 33   dBm device power class [5].
MAC-layer data rate
164   dB MCL
MAC-layer data rate
154   dB CL
MAC-layer data rate
144   dB CL
Peak MAC-layer data rate Peak physical layer data rate
Downlink 0.5   kbps 3.7   kbps 45.6   kbps 97.9   kbps 489.6   kbps
Uplink, 8PSK supported 0.5   kbps 2.7   kbps 39.8   kbps 97.9   kbps 489.6   kbps
Uplink, GMSK supported 0.5   kbps 2.7   kbps 39.8   kbps 51.2   kbps 153.6   kbps

image

Table 4.5

EC-GSM-IoT data rates for 23   dBm device power class [5].
MAC-layer data rate 164   dB MCL MAC-layer data rate 154   dB CL MAC-layer data rate 144   dB CL Peak MAC-layer data rate Peak physical layer data rate
Downlink 2.3   kbps 7.4   kbps 97.9   kbps 489.6   kbps
Uplink, 8PSK supported 0.6   kbps 2.7   kbps 97.9   kbps 489.6   kbps
Uplink, GMSK supported 0.6   kbps 2.7   kbps 51.2   kbps 153.6   kbps

image

4.4. Latency

For large data transmissions the data rate is decisive for the user experience. For short data transfers expected in IoT networks the latency, including the time to establish a connection and transmitting the data, is a more relevant metric for characterizing the experienced quality of service. Hence, to guarantee a minimum level of service quality also under the most extreme conditions, EC-GSM-IoT should be capable of delivering a so-called Exception report within 10   s after waking up from it most energy-efficient state.

4.4.1. Evaluation assumptions

Table 4.6 summarizes the packet size definitions assumed in the evaluation of the EC-GSM-IoT latency performance. It should be noted that the 40-byte IP overhead can optionally be reduced to 4 bytes if robust header compression is successfully applied in the CN. This would significantly reduce the message size and improve the latency performance.
Besides the time to transmit the 96-byte Exception report once a connection has been established, using the EC-PDTCH/U and EC-PACCH/D, the latency calculations include the time to synchronize to the network over the FCCH and EC-SCH and the time to perform the random access procedure using the EC-RACH and the EC-AGCH. In addition   to   the actual transmission times for the various channels, also processing delays in the device and base station as well as scheduling delays are here accounted for when evaluating the EC-GSM-IoT service latency.

Table 4.6

EC-GSM-IoT packet definitions including application, security, transport, IP and GPRS CN protocol overhead [1].
Type Exception report
Application data 20
COAP 4
DTLS 13
UDP 8
IP 40
SNDCP 4
LLC 7
Total 96
The acquisition of system information is not included in the latency calculations because its content can be assumed to be known by the device due to its semi-static characteristics. EC-GSM-IoT actually mandates reading of the system information not more often than once in every 24   h. It should also be remembered that the EC-SCH is demodulated as part of the synchronization procedure, and it contains the most crucial information concerning frame synchronization, access barring, and modification indication of the system information.
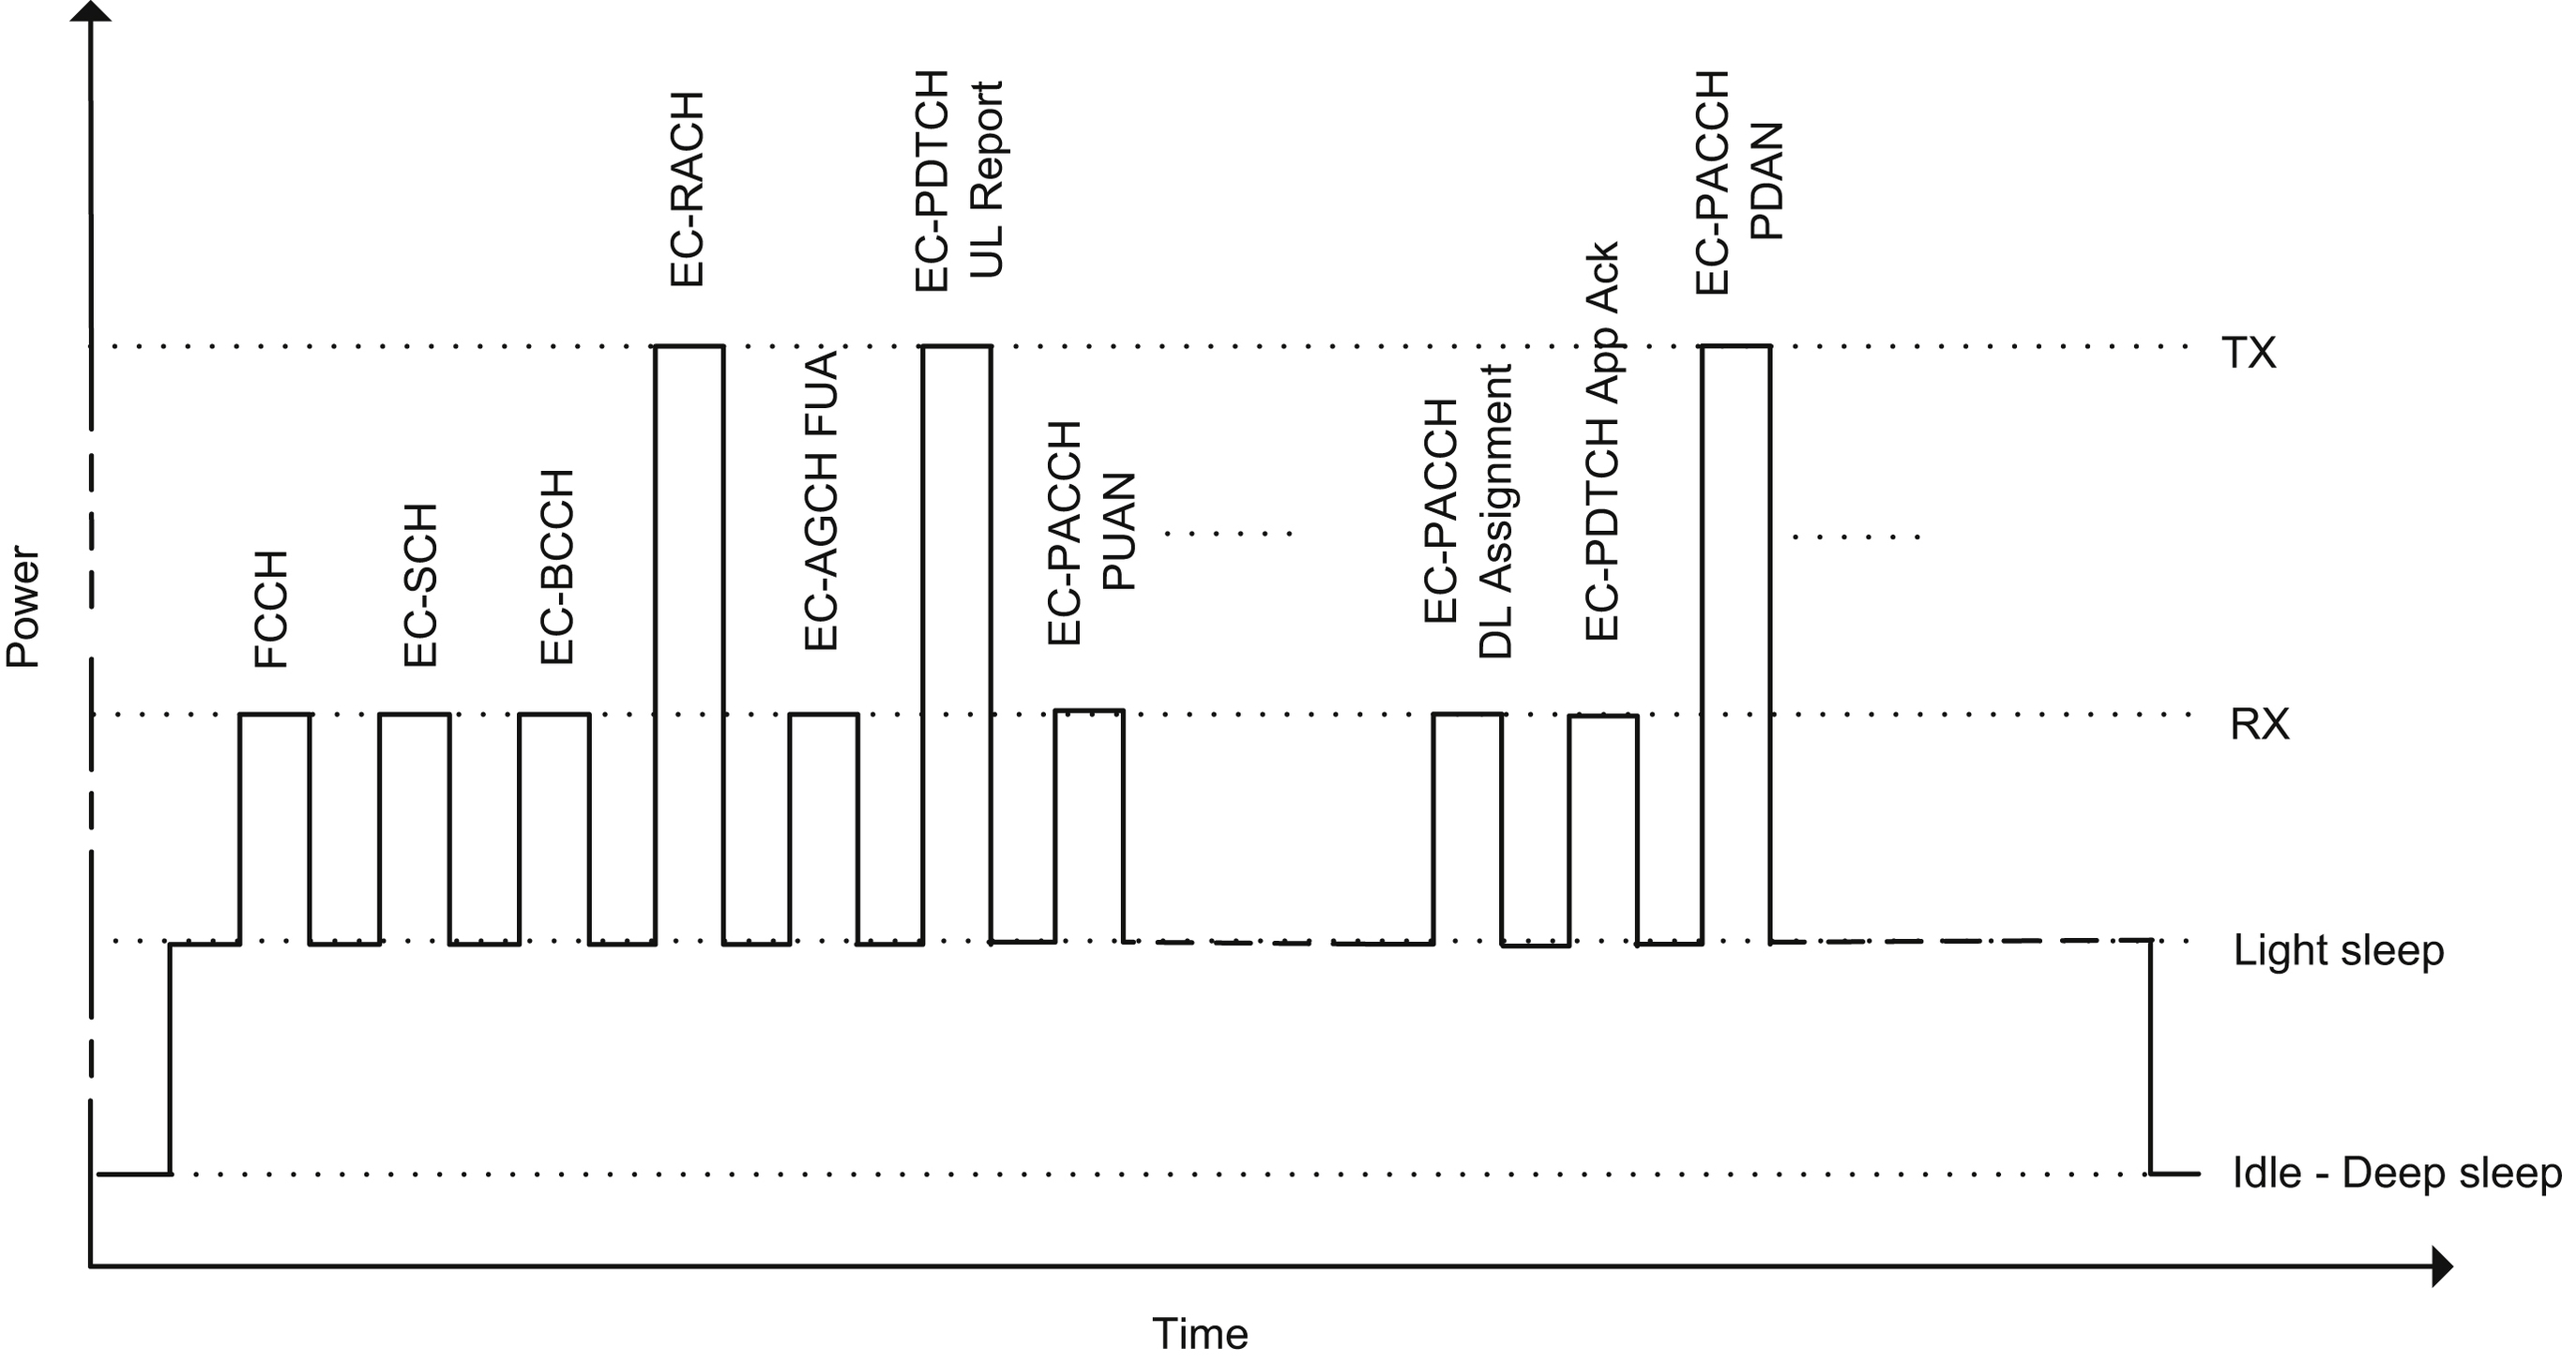
Fig. 4.4 illustrates the signaling and packet transfers considered in the latency evaluation [10]. Three specific parts are identified, namely the time to acquire synchronization TSYNC, the time to perform the Random Access procedure to access the system TRA, and the time to transmit the data TDATA. In the depicted example it is assumed that a first EC-PDTCH/U transmission is followed by three HARQ retransmissions.

4.4.2. Latency performance

Fig. 4.5 shows the time to detect a cell and perform time, frequency, and frame synchronization using the FCCH and EC-SCH under the assumption that a device wakes up from deep sleep with frequency error as large as 20   ppm corresponding to a frequency offset of 18   kHz in the 900   MHz band. This is a reasonable requirement on the frequency accuracy of the real time clock (RTC) responsible for keeping track of time and scheduled events during periods of deep sleep, as discussed in Section 4.7.1. The synchronization time TSYNC used in the latency calculations is derived from the 90th percentile in the synchronization time CDF depicted in Fig. 4.5.
TRA corresponding to the time needed to perform random access and receive the Fixed Uplink Allocation is dependent on the assumed coverage class, i.e., the number of blind transmissions, of the EC-RACH and EC-AGCH that guarantees 20% and 10% BLER respectively, for the applicable coupling loss of the studied scenario.
TDATA is based on the HARQ transmission of the six EC-MCS-1 blocks needed to deliver the 96-byte Exception report, following the procedure illustrated in Fig. 4.1. The packet transfer delay associated with the 90th percentile of the EC-PDTCH latency CDF described in Section 4.2.1.1.3 is used for determining TDATA.
Table 4.7 summarizes the total latency associated with Exception report transmission at coupling losses of 144, 154 and 164   dB.

4.5. Battery life

To support large-scale deployments of IoT systems with minimal maintenance requirements, it was required that an EC-GSM-IoT device for a traffic scenario characterized as small infrequent data transmission supports operation over at least 10 years on a pair of AA batteries providing 5   Wh.

4.5.1. Evaluation assumptions

Before the higher layers in a device triggers the transmission of a report, the device is assumed to be in idle mode in which it may enter Power Save Mode to suspend all its idle mode tasks and optimize energy consumption. Ideally it is only the real time clock (see Section 4.7.1) that is active in this deep sleep state. When receiving and transmitting, the device baseband and radio frequency (RF) front end increase the power consumption. The transmit operation dominates the overall power consumption due to the high output power and the moderate power amplifier (PA) efficiency. This is especially the case for the 33   dBm power class where the transmitter side is expected to consume roughly 40 times more power than the receiver side. The different modes of device operation and their associated power consumption levels assumed during the evaluations of EC-GSM-IoT battery life are summarized in Table 4.9.

Table 4.7

EC-GSM-IoT exception report latencies for devices using 23 or 33   dBm output power [5,10,11].
Coupling loss 23   dBm device 33   dBm device
144   dB 1.2   s 0.6   s
154   dB 3.5   s 1.8   s
164   dB 5.1   s

Table 4.8

EC-GSM-IoT packet sizes at the entry of the GPRS CN for evaluation of battery life [1].
Message type UL report DL application acknowledgment
Size 200   bytes 50   bytes 65   bytes
Triggering interval Once every 2   h or once every day

image

Table 4.9

EC-GSM-IoT power consumption [1].
TX, 33   dBm TX, 23   dBm RX Idle mode, light sleep
Idle mode,
Deep sleep
4.051   W 0.503   W 99   mW 3   mW 15 uW

image

Fig. 4.6 illustrates the uplink and downlink packet flows modeled in the battery life evaluation. Not illustrated is a 1   s period of light sleep between the end of the uplink report transmission and the start of the downlink application acknowledgment message. A period of light sleep after the end of the final EC-PACCH/U transmission is also modeled. This period is assumed to be configured by the Ready Timer to 20   s, during which the device uses a discontinous reception (DRX) cycle that allows for two paging opportunities to enable downlink reachability. An important difference compared with the latency evaluation described in Section 4.4 is that the number of EC-PDTCH blocks modeled in this evaluation corresponds to the average number of blocks needed to be sent, including retransmissions, to secure that the uplink report and downlink application acknowledgment are successfully received. For the synchronization time, the average FCCH and EC-SCH acquisition time was used and not the 90th percentile value used in the latency evaluations. This is a reasonable approach for the modeling of device power consumption for over more than 10   years of operation.

4.5.2. Battery life performance

The resulting battery life for the investigated scenarios are presented in Tables 4.10 and 4.11. It is seen that a 10-year battery life is feasible for the reporting interval of 24   hours. It is also clear that the 2   hours reporting interval is a too aggressive target when the devices are at the MCL of 164   dB. Under these assumptions a battery life of a couple of years is achievable for the assumed pair of AA batteries. For devices with requirements on longer battery life than presented in Table 4.10, this can obviously be achieved by adding battery capacity.

Table 4.10

EC-GSM-IoT, 33   dBm device, battery life time [11].
Reporting interval DL packet size UL packet size Battery life
144   dB CL 154   dB CL 164   dB CL
2   h 65 bytes 50   bytes 22.6 13.7 2.8
200   bytes 18.4 8.5 1.2
24   h 50   bytes 36.0 33.2 18.8
200   bytes 35.0 29.5 11.0

image

Table 4.11

EC-GSM-IoT, 23   dBm device, battery life time [11].
Reporting interval DL packet size UL packet size Battery life
144   dB CL 154   dB CL
2   h 65 bytes 50   bytes 26.1 12.5
200   bytes 22.7 7.4
24   h 50   bytes 36.6 32.5
200   bytes 36.0 28.3

image

In these evaluations, an ideal battery power source was assumed. It delivers 5   Wh without any losses or imperfections that typically can be associated with most battery types. EC-GSM-IoT requires a drain current in the order of 1   A, which may require extra consideration when selecting the battery technology to support an EC-GSM-IoT device. A highly optimized RF front end is also assumed in these investigations with a PA efficiency of 50%. A lower efficiency will deteriorate the reported battery life.

4.6. Capacity

As a carrier of IoT services, it is required of EC-GSM-IoT to support a large volume of devices. More specifically, a supported system capacity of at least 60,680 devices per square kilometer (km2) is expected to be supported by EC-GSM-IoT [1]. This objective is based on an assumed deployment in downtown London with a household density of 1517 homes/km2 and 40 devices active per household. For a hexagonal cell deployment with an inter-site distance of 1732   m, this results in 52,547 devices per cell. This is clearly an aggressive assumption that includes the underlying assumption that EC-GSM-IoT will serve all IoT devices in every household, while in real life we use a multitude of different solutions to connect our devices. Table 4.12 summarizes the assumptions behind the targeted system capacity.

4.6.1. Evaluation assumptions

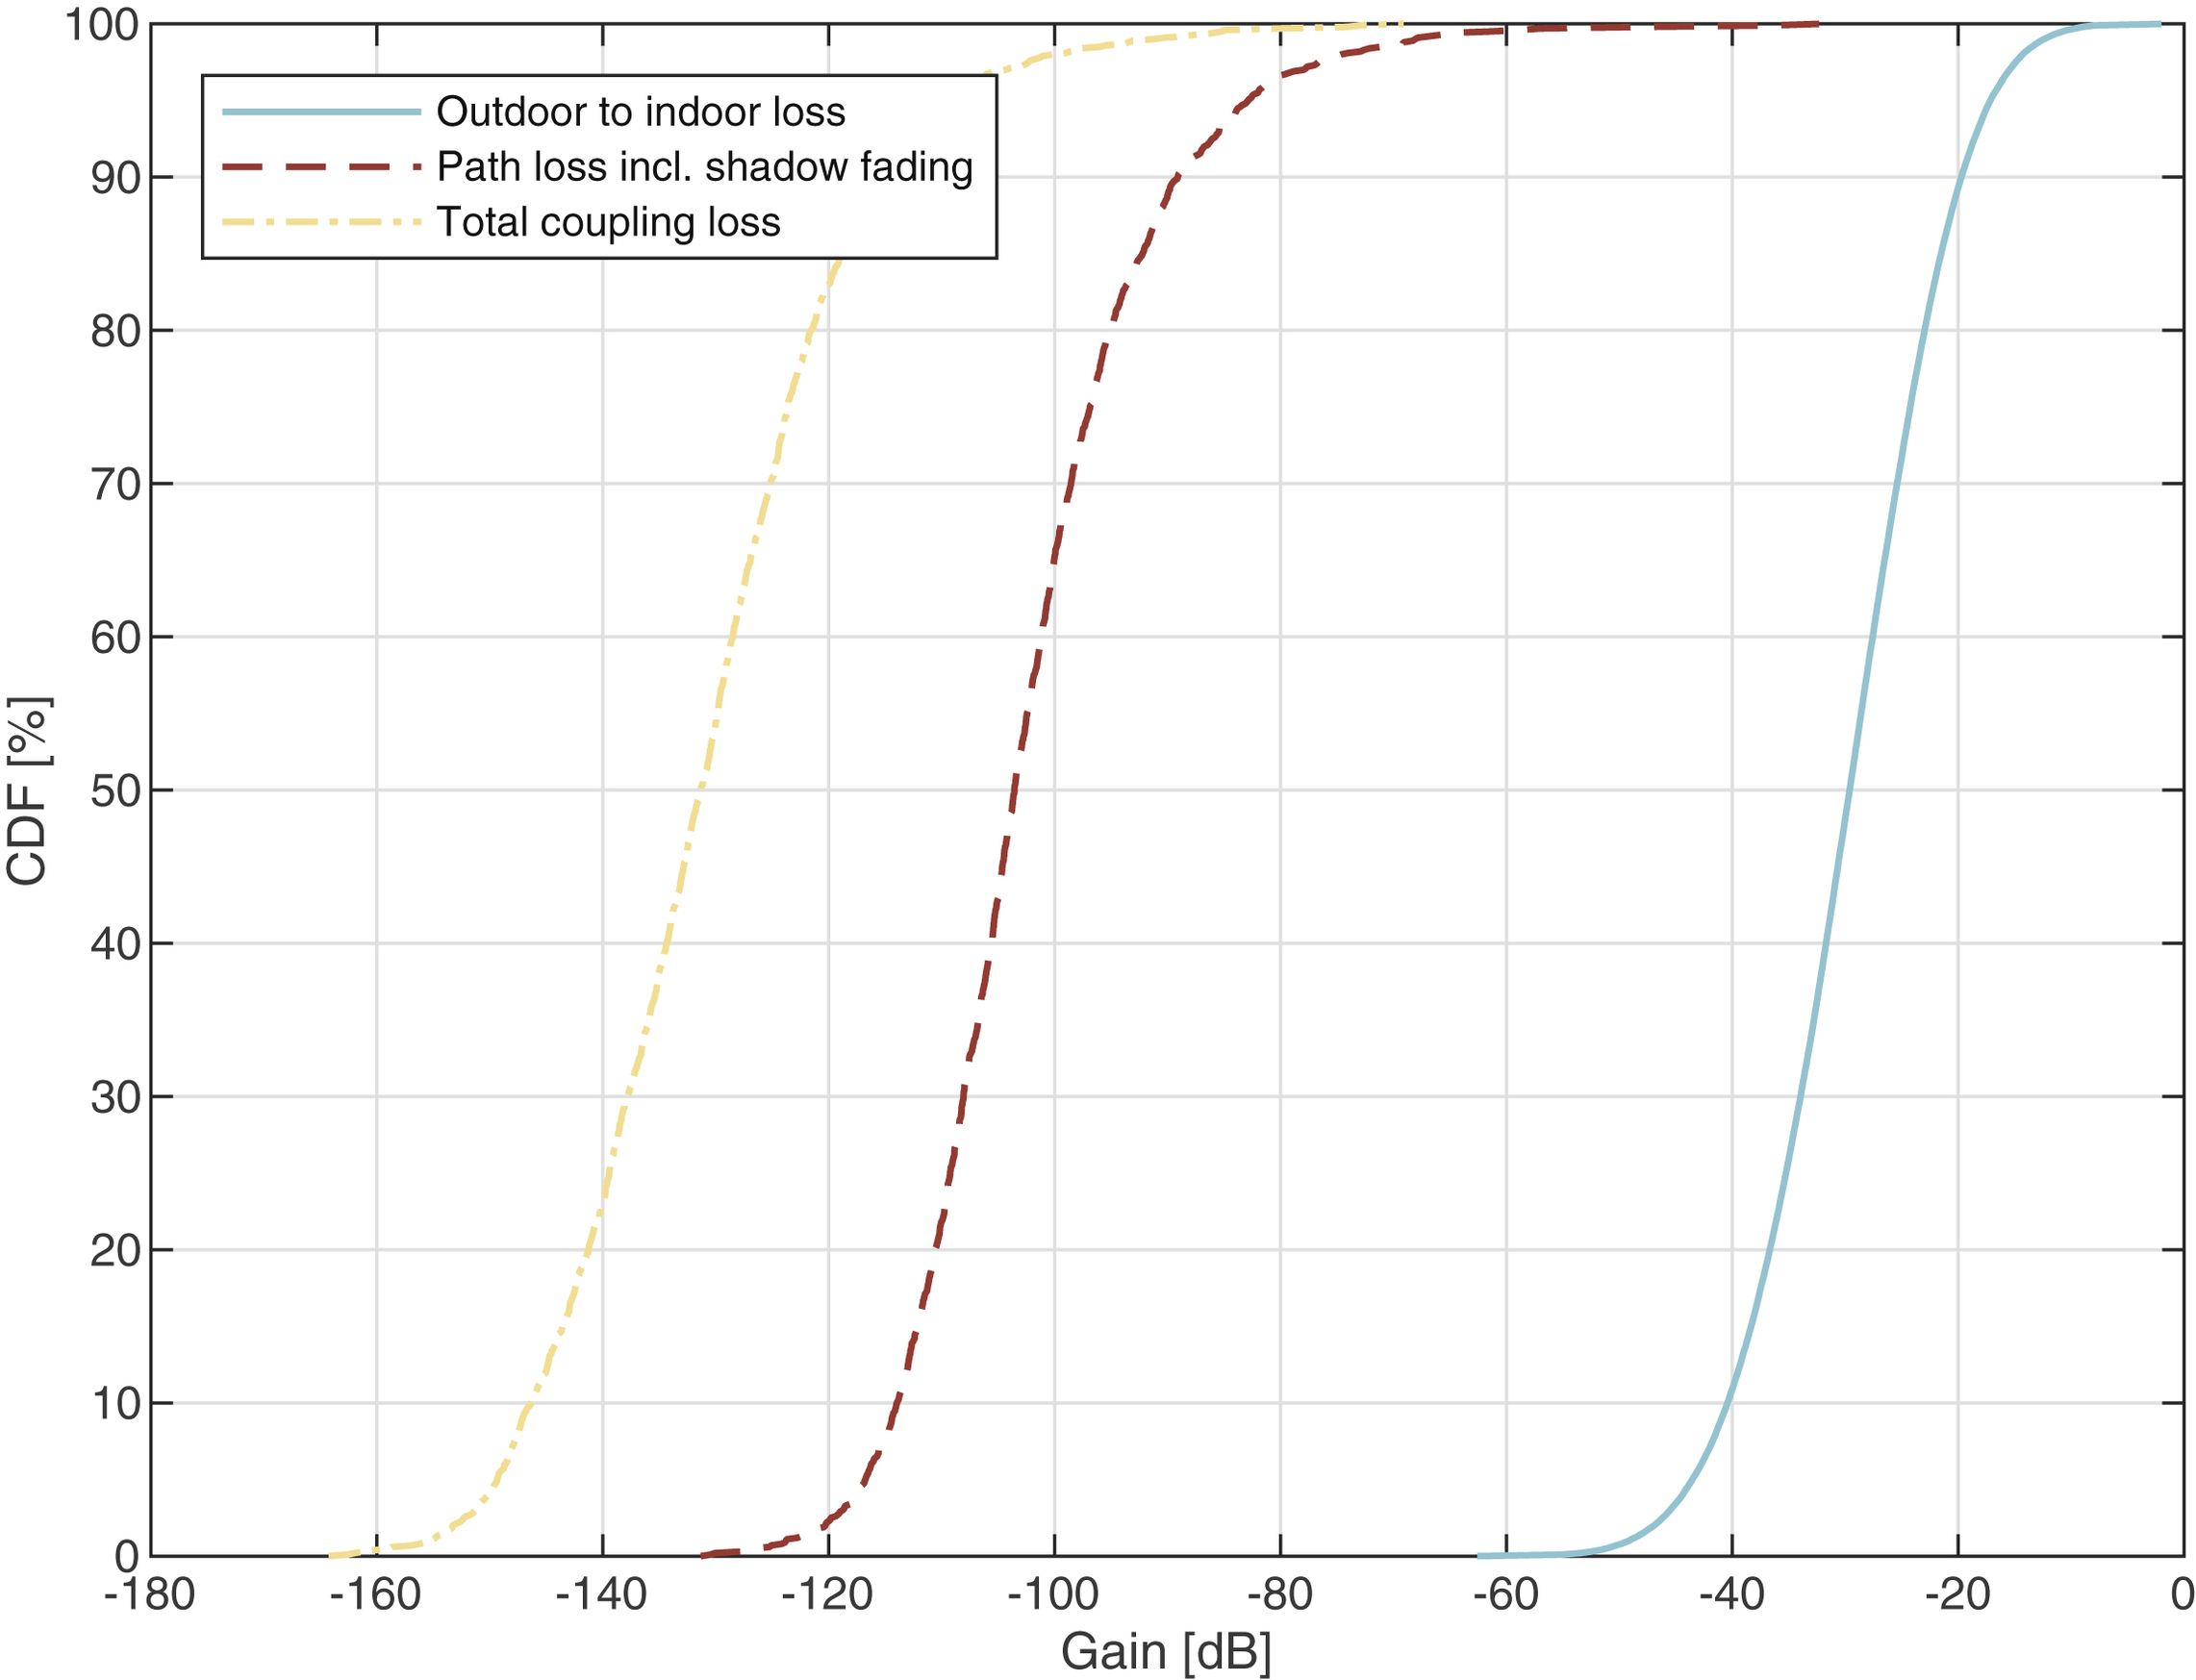
For the cellular IoT solutions, coverage is a key criterion, which makes the use of the sub-GHz frequency bands very attractive. Therefore, in the evaluation of EC-GSM-IoT capacity it is assumed that the studied system is deployed in the 900   MHz frequency band, which since long is supported by GSM. To model coverage, a distance-dependent path loss model is assumed in combination with a large-scale shadow fading with a standard deviation of 8   dB and correlation distance of 110   meters. This is intended to model an urban environment where buildings and infrastructure influence the received signal characteristics. All devices modeled in the network are assumed to be stationary and indoor. In addition to the distance-dependent path loss, a very aggressive outdoor to indoor penetration loss model with losses ranging up to 60   dB is assumed to achieve an overall MCL of 164   dB in the studied system.

Table 4.12

Assumption on required system capacity [1].
Household density [homes/km2] Devices per home Devices per km2 Inter-site distance [m] Devices per hexagonal cell
1517 40 60,680 1732 52,547

image

The overall coupling loss distribution is presented in Fig. 4.7 together with its path loss and outdoor to indoor loss components. The coupling loss is defined as the loss in signal power calculated as the difference in power measured at the transmitting and receiving nodes antenna ports. Besides the path loss, outdoor to indoor loss, and shadow fading the coupling loss captures base station and device antenna gains. For the base station, a single transmit and two receive antennas with 18 dBi directional gain is assumed. This corresponds to a macro deployment with over-the-rooftop antennas. For the device side a 4 dBi antenna gain is assumed. This antenna loss is supposed to model an antenna integrated in a device where form factor is prioritized over antenna efficiency.
The simulated system assumes that a single 200   kHz channel is configured per cell. The first time slot in every TDMA frame is configured with GSM synchronization, broadcast, and control channels, while the second time slot is used for the EC-GSM-IoT version of the same logical channels. The remaining six time slots are reserved for the EC-PDTCH and EC-PACCH transmissions. The EC-GSM-IoT channel mapping is in detailed covered in Section 3.2.5.
Table 4.13 captures a set of the most relevant EC-GSM-IoT system simulation parameter settings.
The system capacity is determined for two types of traffic scenarios as described in the next two sections.

Table 4.13

System level simulation assumptions [1].
Parameter Model
Cell structure Hexagonal grid with 3 sectors per size
Cell inter site distance 1732   m
Frequency band 900   MHz
System bandwidth 2.4   MHz
Frequency reuse 12
Frequency channels per cell 1
Base station transmit power 43   dBm
Base station antenna gain 18 dBi
Channel mapping
TS0: FCCH, SCH, BCCH, CCCH
TS1: EC-SCH, EC-BCCH, EC-CCCH
TS2-7: EC-PACCH, EC-PDTCH
Device transmit power 33   dBm or 23   dBm
Device antenna gain -4 dBi
Device mobility 0   km/h
Path loss model 120.9   +   37.6∙LOG10(d), with d being the base station to device distance in km
Shadow fading standard deviation 8   dB
Shadow fading correlation distance 110   m

4.6.1.1. Autonomous reporting and network command

For the part of the meters sending the autonomous report, a set of different triggering intervals ranging from twice per hour to once per day, as captured in Table 4.14, is investigated. In 50% of the cases the device report is assumed to trigger an application-level acknowledgment resulting in a downlink transmission following the uplink report. The payload of the application level acknowledgment is for simplicity assumed to be zero bytes which means that the content of the downlink transmission is defined by the 76 bytes protocol overhead defined in Table 4.6.
The network is assumed to send a 20-byte downlink command to the 20% of the devices not transmitting an autonomous uplink report. The network command follows the distribution and periodicity captured in Table 4.14. Every second device is expected to respond to the network command with an uplink report. The packet size of this report follows the Pareto distribution depicted in Fig. 4.8 with a range between 20 and 200 bytes. Given the assumptions presented in Table 4.14, it can be concluded that a device on average makes the transition from idle to connected mode once in every 128.5   min.
Fig. 4.9 summarizes the overall uplink and downlink message sizes and periodicities taking the details of the device autonomous reporting and network command assumptions into account. The presented packet sizes do not account for the protocol overheads of Table 4.6, which should be added to get a complete picture of the data volumes transferred over the access stratum.
Fig. 4.9 indicates that the traffic model is uplink heavy, which is a typical aspect of IoT traffic scenarios. At the same time, it can be seen that downlink traffic constitutes a substantial amount of the overall traffic generated.

Table 4.14

Device autonomous reporting and network command periodicity and distribution [1].
Device report and network command periodicity [hours] Device distribution [%]
24 40
2 40
1 15
0.5 5

Table 4.15

Software download periodicity and distribution [1].
Periodicity [days] Device distribution [%]
180 100

4.6.1.2. Software download

4.6.2. Capacity performance

In the first scenario, the periodicity of the device autonomous reports and network commands in combination with the targeted load of 52,547 users per cell results in an overall 6.8 users per second and cell making the transition from idle to connected mode to access the system.
It should be noted that no paging load is considered on the EC-CCCH/D. In reality the load on the paging channel will be dependent not only on the number of devices that the network needs to page, but also on the paging strategy taken by the network. That is, when the network tries to reach a device, it will not exactly know where the device is located and needs to send the paging message to multiple cells to increase the chance of getting a response. With a device that has negotiated a long eDRX cycle, it can take a very long time to reach the device. Hence, there is a clear trade-off between paging load and paging strategy that will have an impact on the overall mobile-terminated reachability performance. Any load caused by paging should be added to the resource usage presented in Fig. 4.10, specifically to the EC-CCCH/D load. In case of a too significant paging load increase, the network can allocate up to four time slots, i.e., TS 1, 3, 5, and 7, for EC-CCCH/D, and by that increase the EC-CCCH capacity by well over 400%.

4.7. Device complexity

To be competitive in the IoT market place, it is of high importance to offer a competitive device module price. GSM/EDGE, which is the still in 2018 the most popular cellular technology for machine-type communication, offers, for example, a module price in the area of USD 5 (see Section 3.1.2.4). However, for some IoT applications, this price-point is still too high to enable large-scale, cost-efficient implementations. For EC-GSM-IoT it is therefore a target to offer a significantly reduced complexity compared to GSM/EDGE.
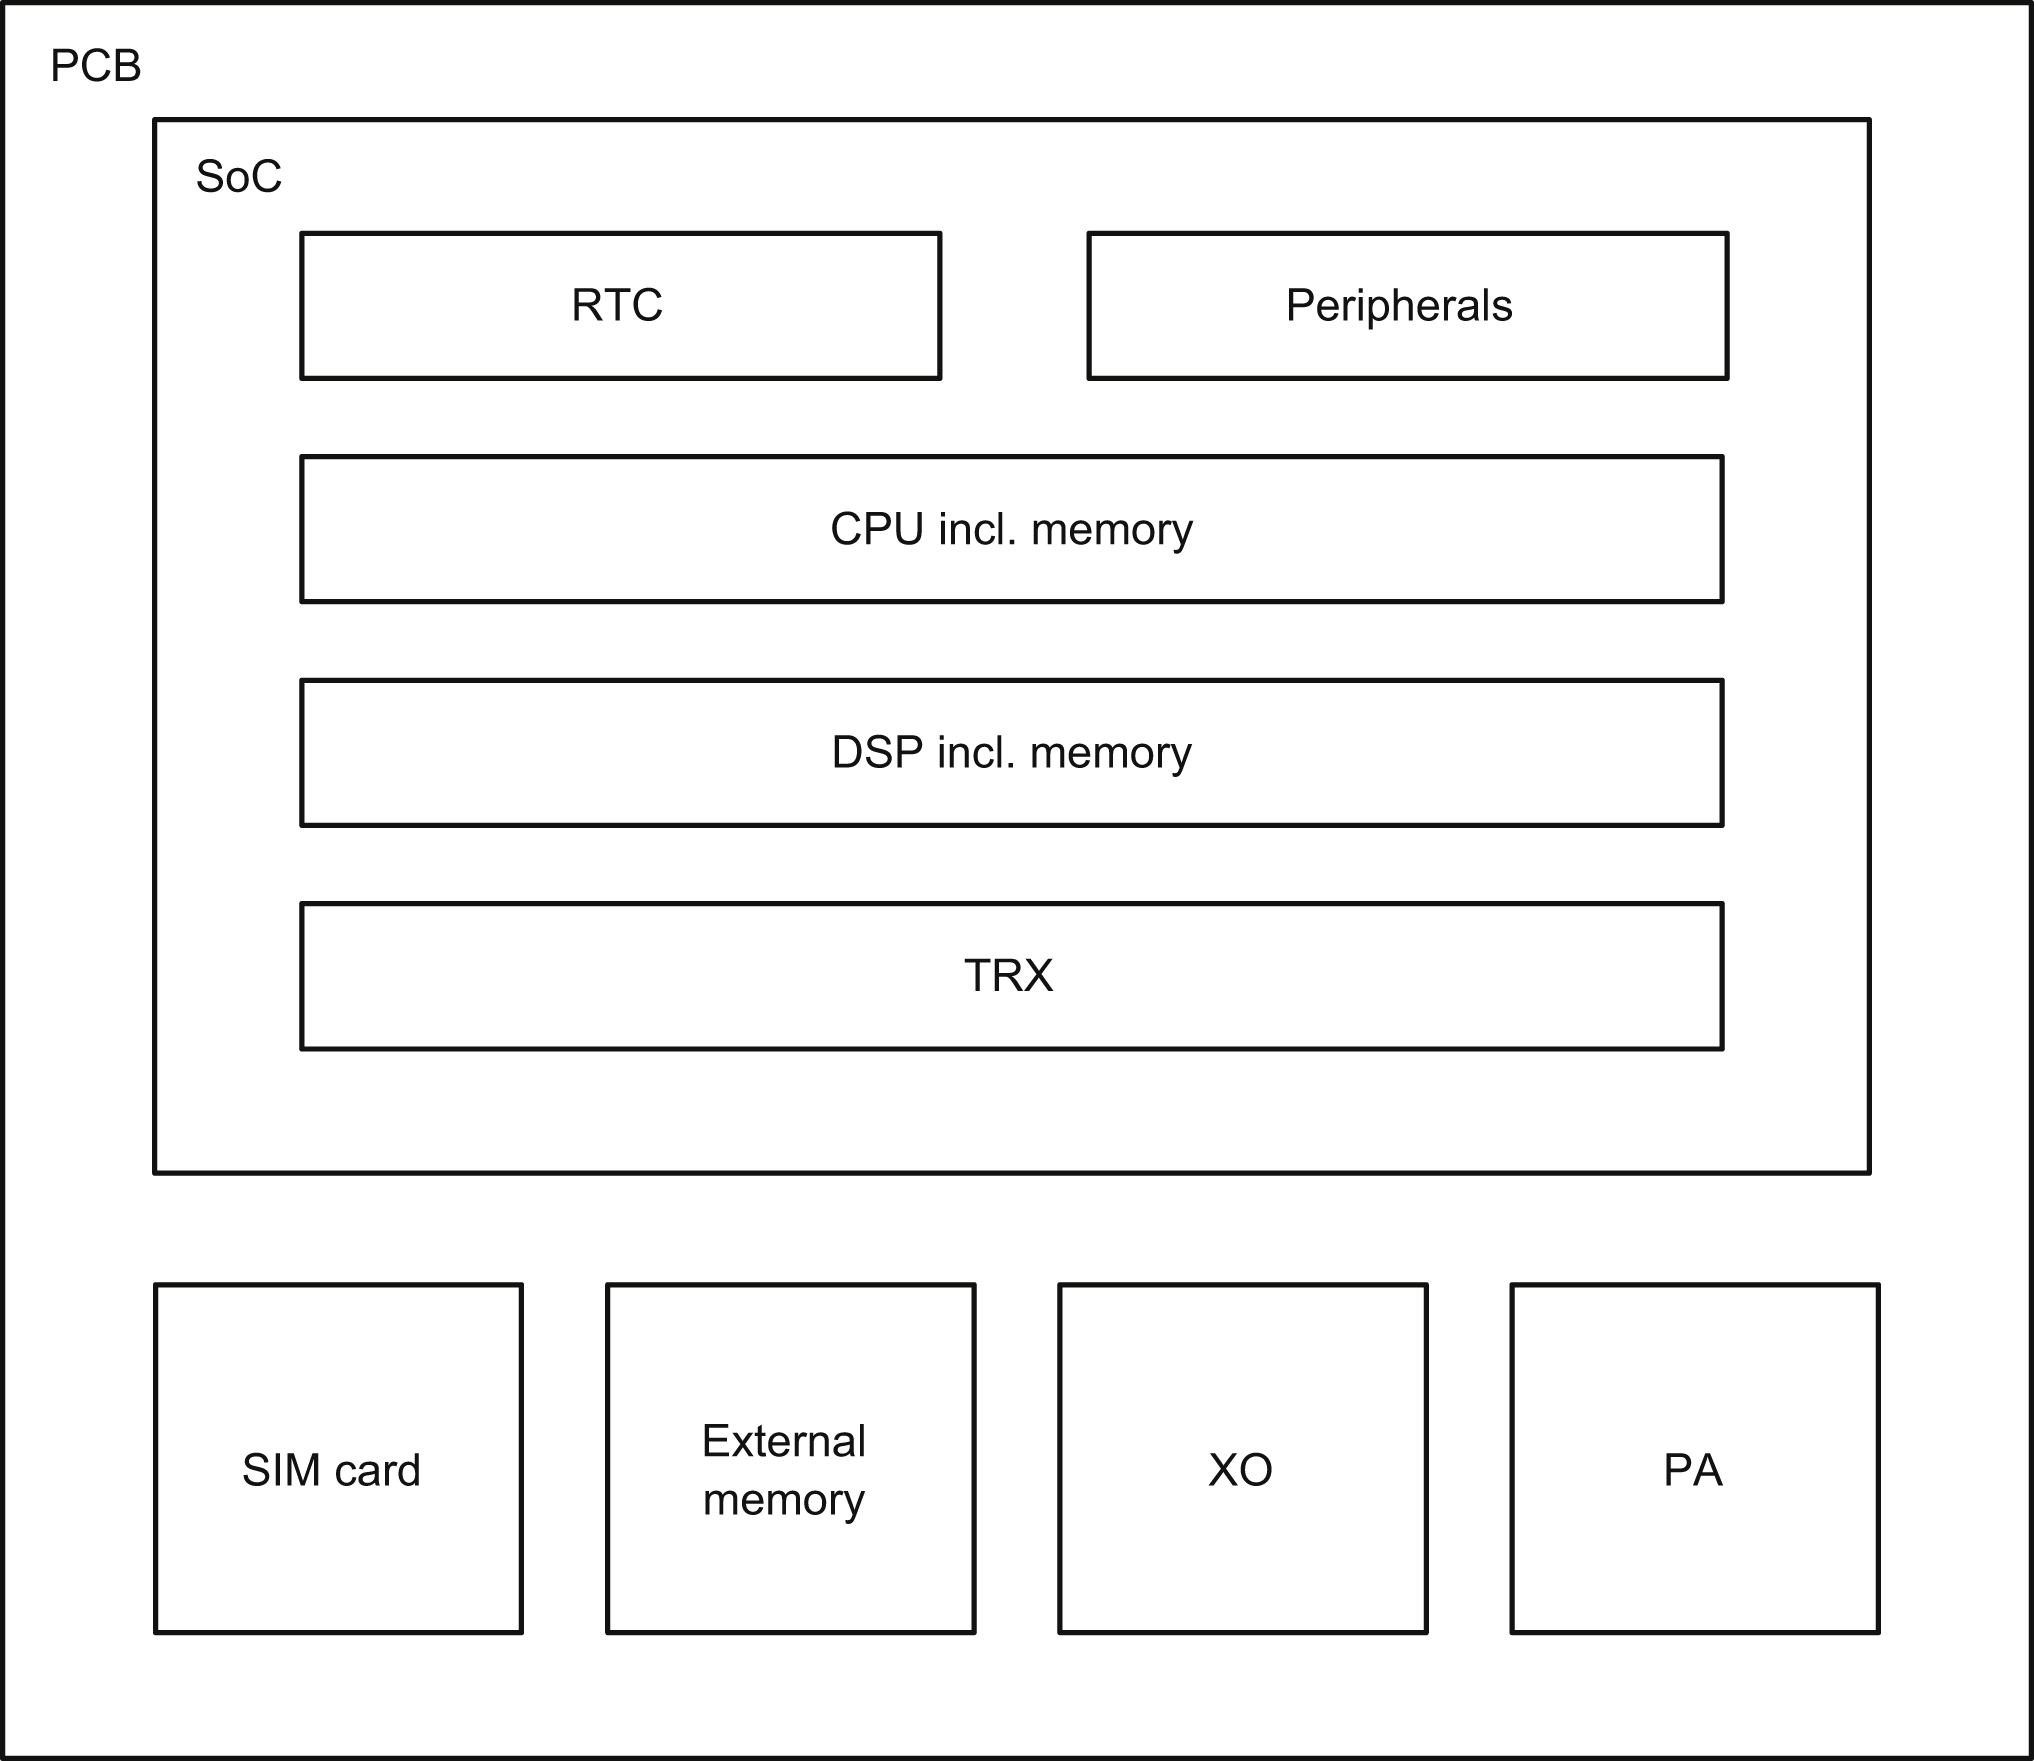
An EC-GSM-IoT module can, to a large extent, be implemented as a system on chip (SoC). The functionality on the SoC can be divided into the following five major components:
  1. • Peripherals
  2. • RTC
  3. • Central processing unit (CPU)
  4. • Digital signal processor (DSP) and hardware accelerators
  5. • Radio transceiver (TRX)
In addition to these blocks, a number of parts may be located outside the SoC, as discrete components on a printed circuit board. The power amplifier (PA) defining the device power class and crystal oscillators (XO) providing the module frequency references are such components.

4.7.1. Peripherals and real time clock

The peripherals block provides the module with external interfaces to, e.g., support a SIM, serial communication, graphics, and general-purpose input and output. This is a generic block that can be found in most communication modules. The range of supported interfaces is more related to the envisioned usage of the device than to the radio access technology providing its connectivity.
Both the Peripherals block and the RTC are generic components that can be expected to be found in all cellular devices regardless of the supported access technology. It is important to understand that the cost associated with functionality related to the radio access technology is only a part of the total price on a communications module.

4.7.2. CPU

The CPU is responsible for generic functions such as booting, running drivers, and applications. It also contains the supported protocol stacks including the GSM protocol stack, i.e., SNDCP, LLC, RLC, and MAC. It contains a controller as well as a memory. A reduction in the protocol stack reduces the CPU memory requirements. But a reduction in and simplifications of the applications supported by the module will also allow reduced computational load and memory requirements to facilitate a less advanced implementation.
The protocol stack in an EC-GSM-IoT device is favorably impacted by the following facts:
  1. • Circuit switched voice is not supported.
  2. • The only mandated modulation and coding schemes are MCS-1 to MCS-4.
  3. • The RLC window size is only 16 (compared to 64 for GPRS or 1024 for EGPRS).
  4. • There is a significant reduction in the number of supported RLC/MAC messages and procedures compared with GPRS.
  5. • Concurrent uplink and downlink data transfers are not supported.

4.7.3. DSP and transceiver

The DSP feeds, and is fed by, the CPU with RLC/MAC headers, data, and control blocks. It handles the modem baseband parts and performs tasks such as symbol mapping, encoding, decoding, and equalization. The DSP may be complemented by hardware accelerators to optimize special purpose tasks such as FIR filtering. It passes the bit stream to the TRX that performs tasks such as GMSK modulation, analog to digital conversion, filtering, and mixing the signal to radio frequency.
For the DSP baseband tasks, the reception of the EC-PDTCH is the most computational demanding task consuming an estimated 88 × 103 DSP cycles per TDMA frame, i.e., per 4.6   ms. For coverage class 2, 3, and 4, four repeated bursts are mapped on consecutive time slots. Assuming that the four bursts can be combined on IQ-level (see Section 3.2.8.2) allows the device to equalize a single burst and not four as in the case of GPRS. Therefore, although EC-PDTCH reception is the most demanding operation, it is significantly less demanding than GSM/EDGE PDTCH reception. Compared with a GPRS reference supporting four receive time slots the 88   ×   103 DSP cycles per TDMA frame correspond to a 66% reduction in computational complexity [1].
The IQ-combination poses new requirements on the DSP memory. Four bursts, each of 160 samples, stored using 2   ×   16 bit IQ representation will, e.g., consume 4   ×   160   ×   2   ×   16   =   2.56   kB. This is, however, more than compensated for by the reduced requirements on soft buffer size stemming from the reduced RLC window and a reduced number of redundancy versions supported for EC-GSM-IoT, as explained in Section 3.3.2.2.
Based on the these observations, the overall reduction in the DSP memory size compared to an EGPRS reference results in an estimated saving in ROM and RAM memory of 160   kB. This corresponds to a ROM memory savings of 48% and RAM memory savings in the range of 19%–33% [1].
For the TRX RF components, it is positive that EC-GSM-IoT supports only four global frequency bands. This minimizes the need to support frequency-specific variants of the RF circuitry. Also, the fact the EC-GSM-IoT operates in half duplex has a positive impact on the RF front end as it facilitates the use a RX-TX antenna switch instead of a duplexer.

4.7.4. Overall impact on device complexity

Based on the findings presented in sections 4.7.14.7.3, in terms of reduction in higher and lower layers' memory requirements, procedures, and computational complexity, it has been concluded that a 20% reduction in the EC-GSM-IoT SoC size compared to GPRS is within reach [1].
In addition to the components on the chip, it is mainly the PA that is of interest to consider for further complexity reduction. For EC-GSM-IoT, the in GSM commonly used 33   dBm power class is supported by the specification. However, because of its high power and drain current, it needs to be located outside of the chip. At 50% PA efficiency the PA would, e.g., generate 4   W power, of which 2   W will be dissipated as heat. The 23   dBm power class was therefore specified to allow the PA to be integrated on the chip. At 3.3   V supply voltage and an on-chip PA efficiency of 45%, the heat dissipation is reduced to 250   mW and the drain current is down at 135   mA, which is believed to facilitate a SoC including the PA. This will further reduce the overall module size and complexity. The potential cost/complexity benefit from integrating the PA onto the chip has not been quantified for EC-GSM-IoT but is more in detailed investigated for LTE-M (see Chapter 6), which can at least give an indication of the potential complexity reduction also for other technologies.

4.8. Operation in a narrow frequency deployment

GSM is traditionally operating the BCCH frequency layer over at least 2.4   MHz by using a 12-frequency reuse. This is also the assumption used when evaluating EC-GSM-IoT capacity in Section 4.6. For a LPWAN network it is clearly an advantage to support operation in a smaller frequency allocation. For EC-GSM-IoT operation over 9 or 3 frequencies, i.e., using 1.8   MHz or 600   kHz, is investigated in this section. More specifically, the operation is evaluated in the areas of idle mode procedures, common control channels, and data traffic and dedicated control channel performance.
The results presented in Sections 4.8.1 and 4.8.2 clearly show that EC-GSM-IoT can be deployed in a frequency allocation as tight as 600   kHz, with limited impact on system performance.

4.8.1. Idle mode procedures

Reducing the frequency reuse in the BCCH layer may impact tasks such as synchronization to, identification of, and signal measurements on a cell via the FCCH and EC-SCH. Especially, the FCCH detection is vulnerable because the FCCH signal definition (see Section 3.2.6.1) is the same in all cells. A suboptimal acquisition of the FCCH may negatively influence tasks such as Public Land Mobile Network (PLMN) selection, cell selection, and cell reselection.

4.8.1.1. PLMN and cell selection

For initial PLMN or cell selection, a device may need to scan the full range of supported bands and absolute radio frequency channel numbers (ARFCNs) in the search for an EC-GSM-IoT deployment. A quad band device supporting GSM 850, 900, 1850, and 1900 frequency bands needs to search in total 971 ARFCNs. In worst case, a device requires 2   seconds to identify an EC-GSM-IoT cell when at 164   dB MCL, as depicted in Fig. 4.5. This was proven to be the case regardless of the frequency reuse, since thermal noise dominates over external interference in deep coverage locations even in a tight frequency deployment. In a scenario where only a single base station is within coverage, and where this base station is configured using the last frequency being searched for by a device, a sequential scan over the 971 ARFCNs would demand 971   ×   2   s   =   32   min of active RF reception and baseband processing. By means of an interleaved search method the search time can be reduced to 10   min as presented in Table 4.16 [3]. In practice it is also expected that it is sufficient for an EC-GSM-IoT device to support the two sub-GHz bands for global coverage, which has the potential to further reduce the worst-case full band search time.

Table 4.16

Worst-case of full band search time for a quad band device at 164   dB coupling loss from the serving cell [3].
System bandwidth 600   kHz 1.8   MHz 2.4   MHz
Time of PLMN selection 10   min

image

Table 4.17

The probability for a EC-GSM-IoT device to select the optimal serving cell [3].
System bandwidth 600   kHz 1.8   MHz 2.4   MHz
Probability of selecting strongest cell as serving cell 89.3 % 89.7 % 90.1 %

image

Table 4.18

The probability and time required for an EC-GSM-IoT device to successfully reconfirm the serving cell after a period of deep sleep [3].
System bandwidth 600   kHz 1.8   MHz 2.4   MHz
Probability of reconfirming serving cell 98.7 % 99.9 % 99.9 %
Synchronization time, 99th percentile 0.32   s 0.12   s 0.09   s

image

After the initial full band scan, a serving cell needs to be selected. To improve performance in an interference limited network the signal strengths of a set of highly ranked cells are measured over the FCCH and EC-SCH (see Section 3.3.1.1) with the measurements ideally excluding contributions from interference and noise. With this new approach of measuring for cell selection, the likelihood of selecting the strongest cell as serving cell is, as summarized in Table 4.17, close to being independent of the frequency reuse.

4.8.1.2. Cell reselection

After the initial cell selection, EC-GSM-IoT mobility relies on the idle mode cell reselection procedure where significant importance is put on accurate evaluation of the quality of the serving cell (see Section 3.3.1.2). One important scenario for EC-GSM-IoT is that a device waking up after a long period of deep sleep can successfully synchronize to and reconfirm the identity of the serving cell. The reconfirmation of the serving cell is, as seen in Table 4.18, only slightly impacted by the tighter frequency reuse.

4.8.2. Data and control channel performance

The data and control channel capacity are evaluated under the same assumptions as elaborated on in Section 4.6.1. In addition to the 12-frequency reuse, consuming 2.4   MHz system bandwidth, also 9- and 3-frequency reuse patterns are investigated. The relative radio resource consumption is summarized in Fig. 4.12 in terms of average fraction of the available radio resources consumed. In all three deployment scenarios the percentage of failed connection attempts are kept below 0.1% at the investigated system load.
The impact on resource utilization is seen as negligible when going from 2.4 to 1.8   MHz, while it becomes noticeable when going down to a 600   kHz deployment. This is especially noticeable for the downlink traffic channels that are more severely hit by the increased interference levels stemming from the tightened frequency reuse.
The targeted load of 52,547 devices is comfortably met under all scenarios. In relation to the available radio resources on the BCCH carrier, the presented figures are relatively modest indicating that a load well beyond 52,547 users per cell may be supported even when only using a 600   kHz frequency deployment.
Besides the increased resource consumption presented in Fig. 4.12, the reduced frequency reuse also results in increased service delays mainly because of more retransmissions caused by increased interference levels, and users selecting higher coverage classes. Fig. 4.13 and 4.14 illustrate the impact on the time to successfully transmit a device autonomous report and on the time to transmit a downlink application acknowledgment once a connection has been established, including EC-PACCH and EC-PDTCH transmission times and thereto associated delays. Here a 33   dBm device is studied. The uplink and downlink packet sizes follows the characteristics specified in Section 4.6.1. The impact when going from 2.4 to 1.8   MHz is negligible for both cases. When taking a further step to 600   kHz the impact becomes more accentuated but is still acceptable for the type of services EC-GSM-IoT targets.

4.9. Positioning

The positioning accuracy has been evaluated [12] by system simulations, modeling, for example, the SINR dependent synchronization accuracy. The results are presented in Fig. 4.15. For the multilateration case, three base stations are used in the positioning attempt. It can be noted that the more base stations that are used, the better the accuracy, but also the more energy will be consumed by the device. From the figure it is seen that the most suitable method is where the device selects the base stations (based on descending SINR), excluding cells that are co-sited (legend: “NW guided sel.”). It should be noted that another method could be the optimal one for another number of base stations used in the positioning attempt [12].