7.3 Troubleshooting
In SAP PO, there are different ways of troubleshooting and debugging runtime exceptions and other types of erroneous events. In this section, we’ll explain how you should manage troubleshooting situations in SAP PO.
Imagine it’s Friday afternoon—almost the end of a busy week—and you receive an alert message with high priority from a production system, indicating that there’s an issue with an interface. When that happens, you know that your organization relies on your knowledge and ability to analyze the source of the error and ultimately remedy the incident.
An integration platform such as AEX plays a critical role in any enterprise at both the technical and business levels. That criticality arises as a result of supporting a diversity of information flows of different kinds (e.g., system to system and human to system). It also automatically means that the pressure and responsibility of guaranteeing the availability and performance of that system also increases. It’s extremely important for you as the integration specialist to find your way through SAP PO’s constellation of available tools, transactions, views, and URLs. SAP PO provides several types of monitoring that can be accessed using different methods. Which method is appropriate for you depends on the specific issue you need to troubleshoot and the shape and architecture of your integration landscape.
In addition to having access to the right tools and knowledge to troubleshoot any integration incident that might happen inside the AEX, you also need to have an effective strategy that you can apply when you need to solve an issue. The following list provides an overview of the types of information you should have, know, ask for, or collect in advance before trying to fix a bug or support production incidents inside the AEX:
- The name and repository namespace of the interface causing trouble. This sounds quite trivial, but sometimes this simple check can save you effort.
- Type of the interface (e.g., ABAP proxy, Java proxy, Remote Function Call/Business Application Programming Interface [RFC/BAPI], IDoc, web service, file, etc.) to help you create a helicopter view of the situation and get more input to feed your problem analysis.
- Type of communication (i.e., synchronous or asynchronous). The runtime behavior and Quality of Service (QoS) of synchronous and asynchronous interfaces is totally different and thus critical for your initial analysis.
- Sender and receiver(s) of the interface (i.e., who is sending what to whom).
- Whether all RFC destinations (ABAP stack, SAP backend) and service groups (Java stack, SAP PO) are well configured and up and running, to determine whether the issue is caused by a missing communication link with one of the involved systems.
- Whether the messages originated in an SAP backend system.
- Whether the messages were sent without errors from the ABAP stack. You can check this using Transaction SXMB_MONI (Monitor Local PI Engine on ABAP stack), Transaction WE05 (Monitor IDoc Traffic), and Transaction SM58 (Monitor Transactional RFC).
- Original message payload or message GUID of missing message (if applicable). You can use the payload to analyze the contents of the message, test the mapping, or try to resend it again in the case of synchronous communication.
- Date and time when the issue with the interface was detected. This information will help you narrow down the messages causing the problem and probably also the source of the issue.
- Who or what is the trigger of the outbound/inbound interface to understand the business process behind the interface.
- Average size of the messages, so you can assess whether the problem is caused by too large of a message entering or leaving the AEX.
- Average volumes to give you an idea of the number of messages normally processed on a daily basis.
- Whether the issue is reproducible on other AEX environments (e.g., development, test, etc.). That way, you can isolate the problem to a certain environment or system parameter.
- Whether you’ve recently successfully refreshed the SAP PO caches (both data and runtime). It’s known that SAP PO caches data at different levels, mainly for performance reasons, but this approach is sometimes also responsible for unreproducible issues.
- Whether the interfaces were built originally for SAP PO or migrated from SAP PI (dual-stack) to SAP PO, to avoid any chance of possible incompatibilities between system versions.
This list can serve as the starting point for what can be promoted as the standard procedure to tackle integration incidents happening around the AEX. Let’s now take a look inside the tools that will help you troubleshoot your SAP PO interfaces in an effective way.
As mentioned in Section 7.1, the SAP NetWeaver Administrator is a web-based tool that serves as a common entry point for performing different administrative and monitoring activities. One of those activities is analyzing the contents of log entries generated as a result of erroneous or unexpected situations during runtime, which we’ll now show you how to do in the AEX.
7.3.1 Configuring Log and Traces
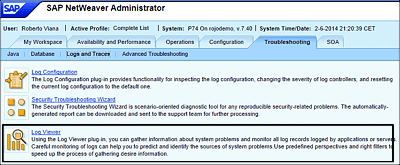
Navigate to the SAP NetWeaver Administrator, and select the Troubleshooting tab. Assuming you have the proper administrative rights in the SAP PO environment, you should now see a screen like the one shown in Figure 7.18.
Figure 7.18 Troubleshooting: Log Configuration
From the Troubleshooting tab, click on the Logs and Traces link. From there you have the following options:
-
Log Configuration
Configure or edit the severity of logs and traces via the Log Configuration screen at the component level. -
Security Troubleshooting Wizard
Troubleshoot security-related issues with a wizard-based diagnostic tool. -
Log Viewer
Query logs and gather background information about interface- and system-related exceptions at different log levels created by components running under the AEX (Figure 7.19).
Figure 7.19 Troubleshooting: Log Viewer
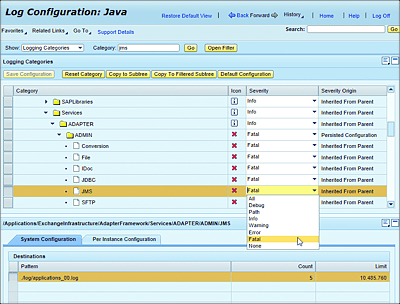
Via Log Configuration, you can set or edit the desired debug and trace levels for a particular component, such as adapters, adapter modules, standard AEX components, and so on. In Figure 7.18, the log level of different adapters was configured to log events (exceptions) that fall under the Fatal category.
You can find the standard SAP PI adapters in the following tree structure ROOT CATEGORY/Applications/ExchangeInfrastructure/AdapterFramework/Services/ADAPTER/ADMIN/.
Tip
In the Category field, type the name of the adapter (e.g., “jms”, “file”, etc.) for which you want to set or edit the log or trace level, and click Go when you’re finished.
7.3.2 Using the Log Viewer
The error information displayed in the AEX message monitoring after an interface exception has occurred won’t always be sufficient to help you get a clear understanding of the exact source of the problem. To collect additional information about the exception, you’ll have to dig deeper into the error logs and find out what else has been logged for the same error.
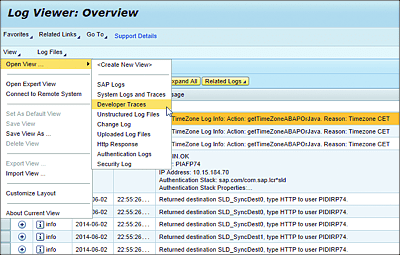
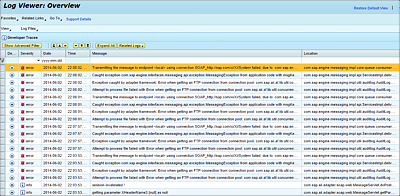
Within SAP NetWeaver Administrator, there is a tool that facilitates exactly that job. Via the Log Viewer, an administrator can select and open different overviews that show distinct log categories. Depending on the nature of the error, you can select the relevant log category. Developer traces is the type of log you’ll be using in most occasions. In that particular overview, you’ll find additional details about interface and system-wide exceptions.
Figure 7.20 shows how you can select the correct view from a dropdown menu. After the correct selection has been made, the overview (see Figure 7.21) is displayed on the screen. From that same screen, you can also narrow your log search by applying specific filters (click on the Show Advanced Filter button). You can, for instance, filter based on message ID, exception contents, error severity, application, date and time, and so on. You can also apply similar filters by entering a keyword at the top of the tabular view.
Figure 7.20 Troubleshooting: Log Viewer, Open View
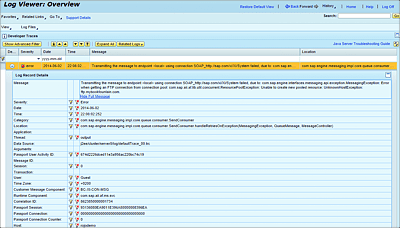
When you’ve found a suspicious entry in the overview, you can select it from the list and click on the Plus icon to expand and read its contents (see Figure 7.22).
Figure 7.21 Troubleshooting: Log Viewer, Developer Traces
Figure 7.22 Troubleshooting: Log Viewer, Error Details Expanded
