0.0
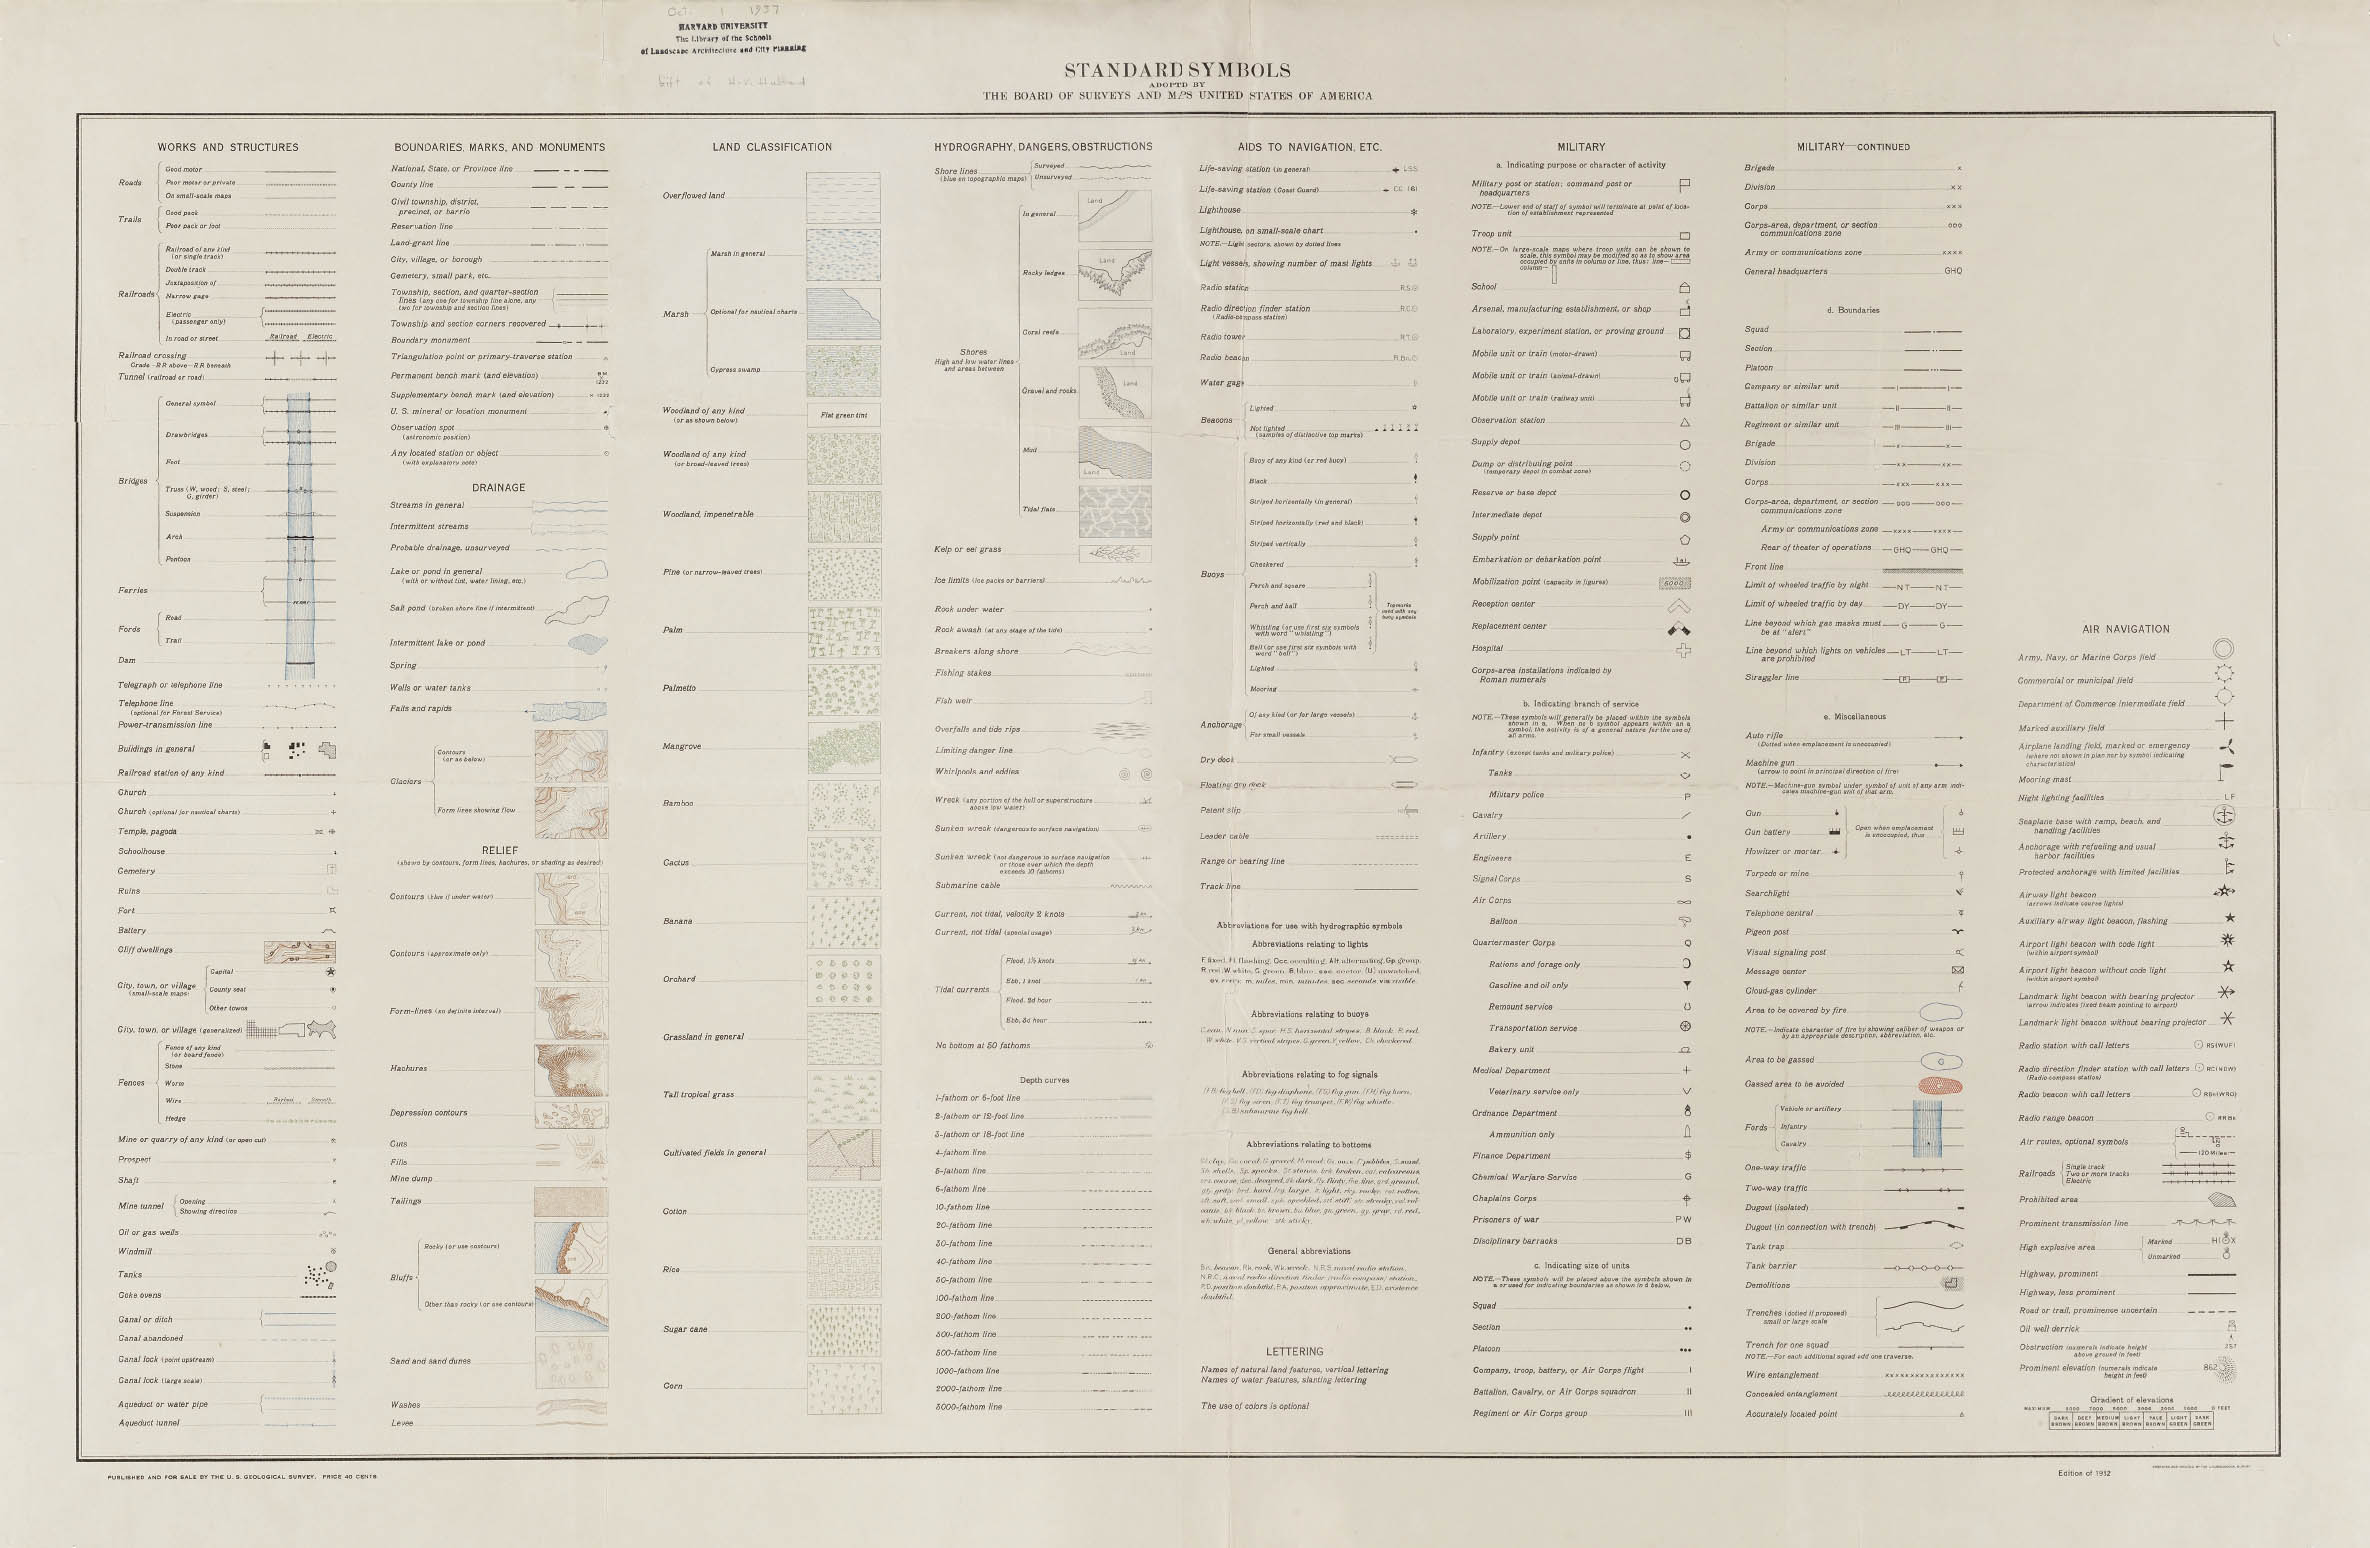
United States Geological Survey, Standard Symbols: Adopted by the Board of Surveys and Maps United States of America, 1932.
0.0
United States Geological Survey, Standard Symbols: Adopted by the Board of Surveys and Maps United States of America, 1932.
You only understand information relative to what you already understand. You only understand the size of a building if there is a car or a person in front of it. You only understand facts and figures when they can be related to tangible, comprehensible elements.
—Richard Saul Wurman, Information Anxiety, 1989
Cartographic Grounds invites close inspection of drawings, maps, and plans. Many of the drawings included here are remarkable for their engrossing tactility and engaging detail. The maps and plans are fragmentary and episodic, seeking the situated particular over the general. There are no drawings of the globe or even a continent in this volume. In many of these examples, it is possible to land at the airport or to arrive by boat, car, or on foot, and, even if it requires squinting, to find the nearest landmark. The scale of many equate to the scale of human occupation. It should be acknowledged that this level of detail is a privilege. Accurate surveying and high-resolution data are expensive. For example, the 1:25,000 topographical map (and its imperial sibling, the 1:24,000), are products of wealthy nations, either mapping their own territories or those of colonial interest. There is, and always has been, a correlation between power and the availability of geospatial data.
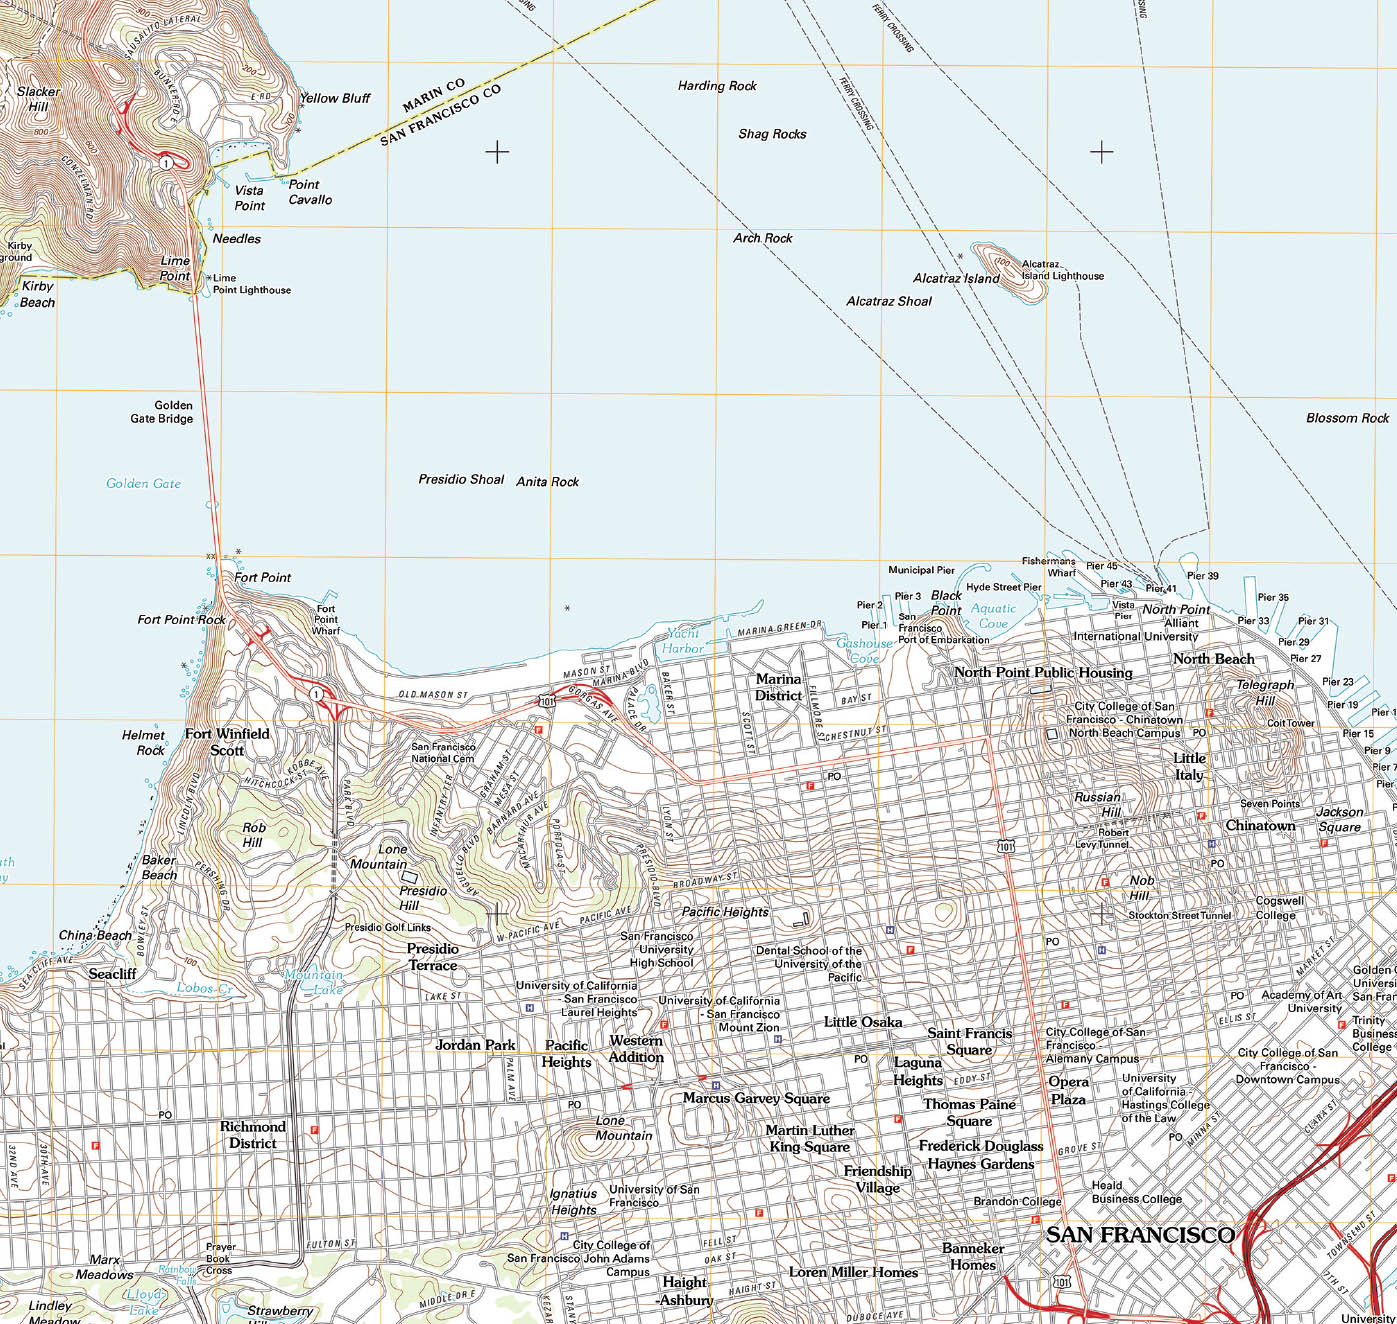
In the United States, the 7.5-minute, 1:24,000 scale quadrangle1 is taken for granted. In fact, it is the most commonly recognized US geological-map scale. The five-color convention—black for culture, brown for contours, blue for water bodies, red for highways and urbanized areas, green for woodland and parks—is ingrained. There are fifty-seven thousand United Stated Geological Service 7.5-minute quadrangle maps covering the coterminous United States, Hawaii, and the US territories. (Alaska is not fully mapped, but maps are available for Anchorage, Fairbanks, and Prudhoe Bay.) One example, the San Francisco North quadrangle, is shown in comparison with five other 1:25,000 maps from across the world. Similarities arise, as brown contours, blue water, and green vegetation dominate, but there are also clear differences with the data, precision, and sociopolitical context of the maps.
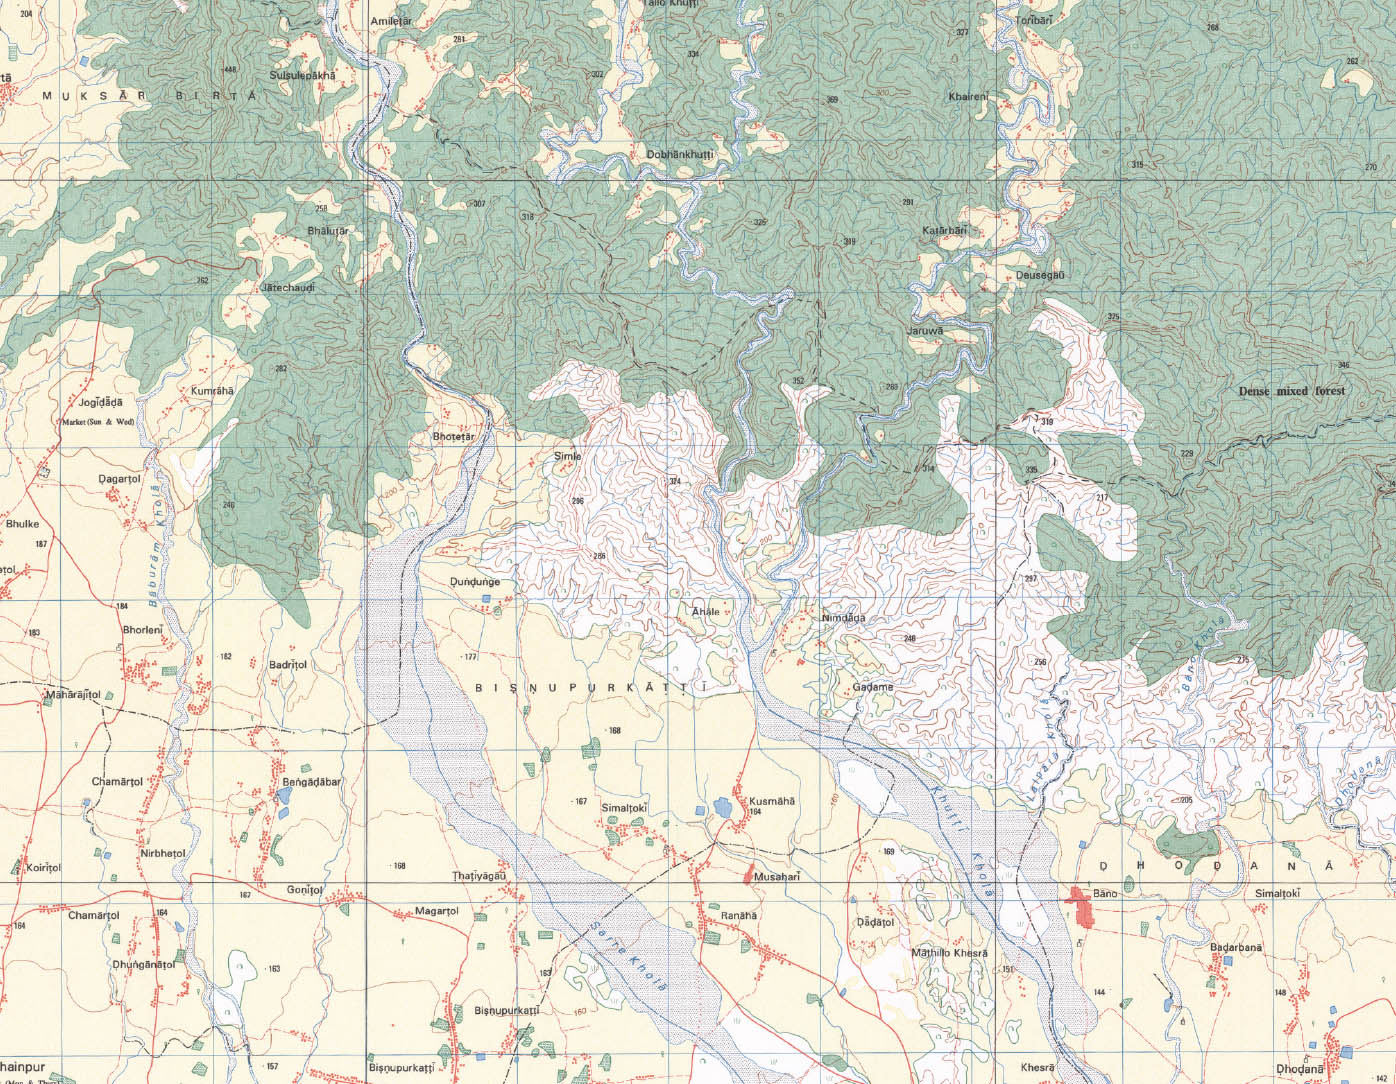
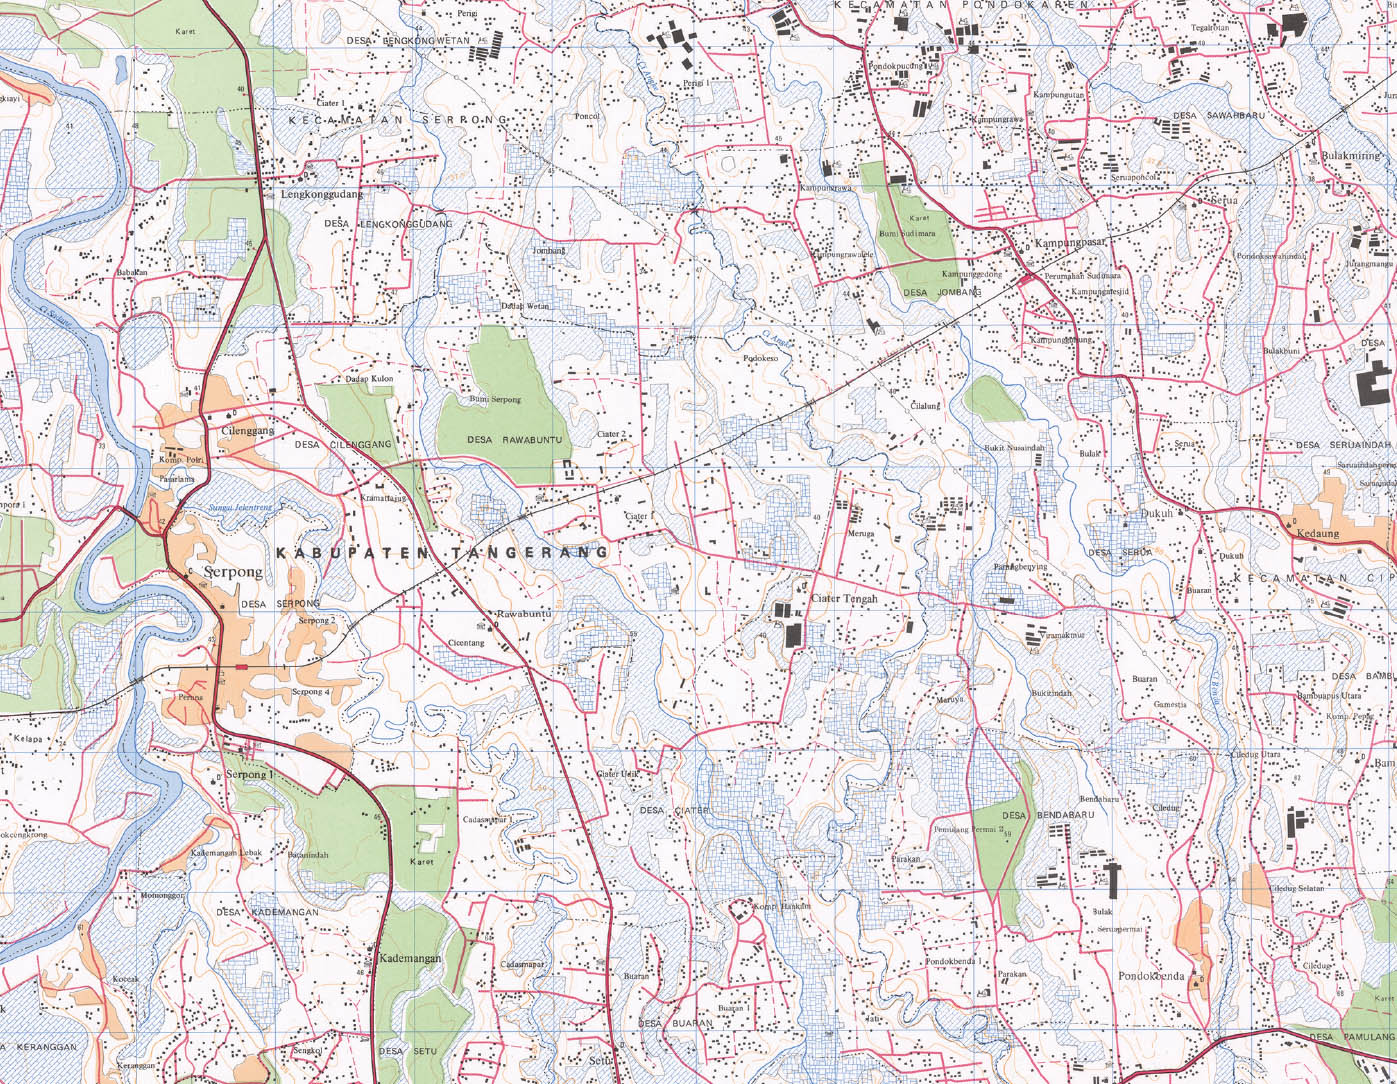
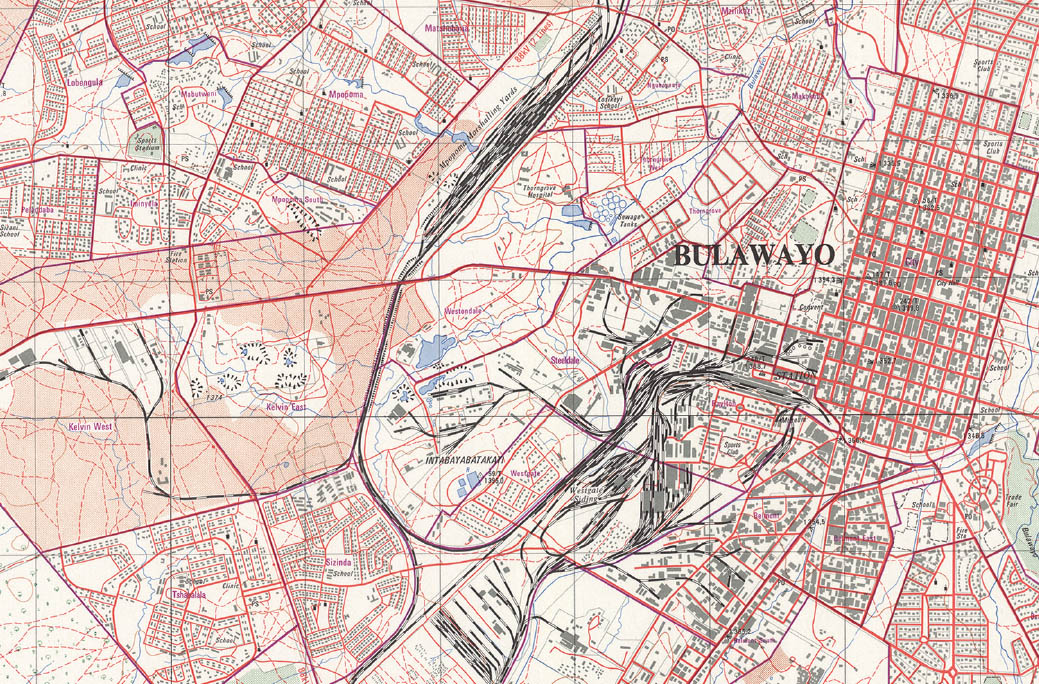
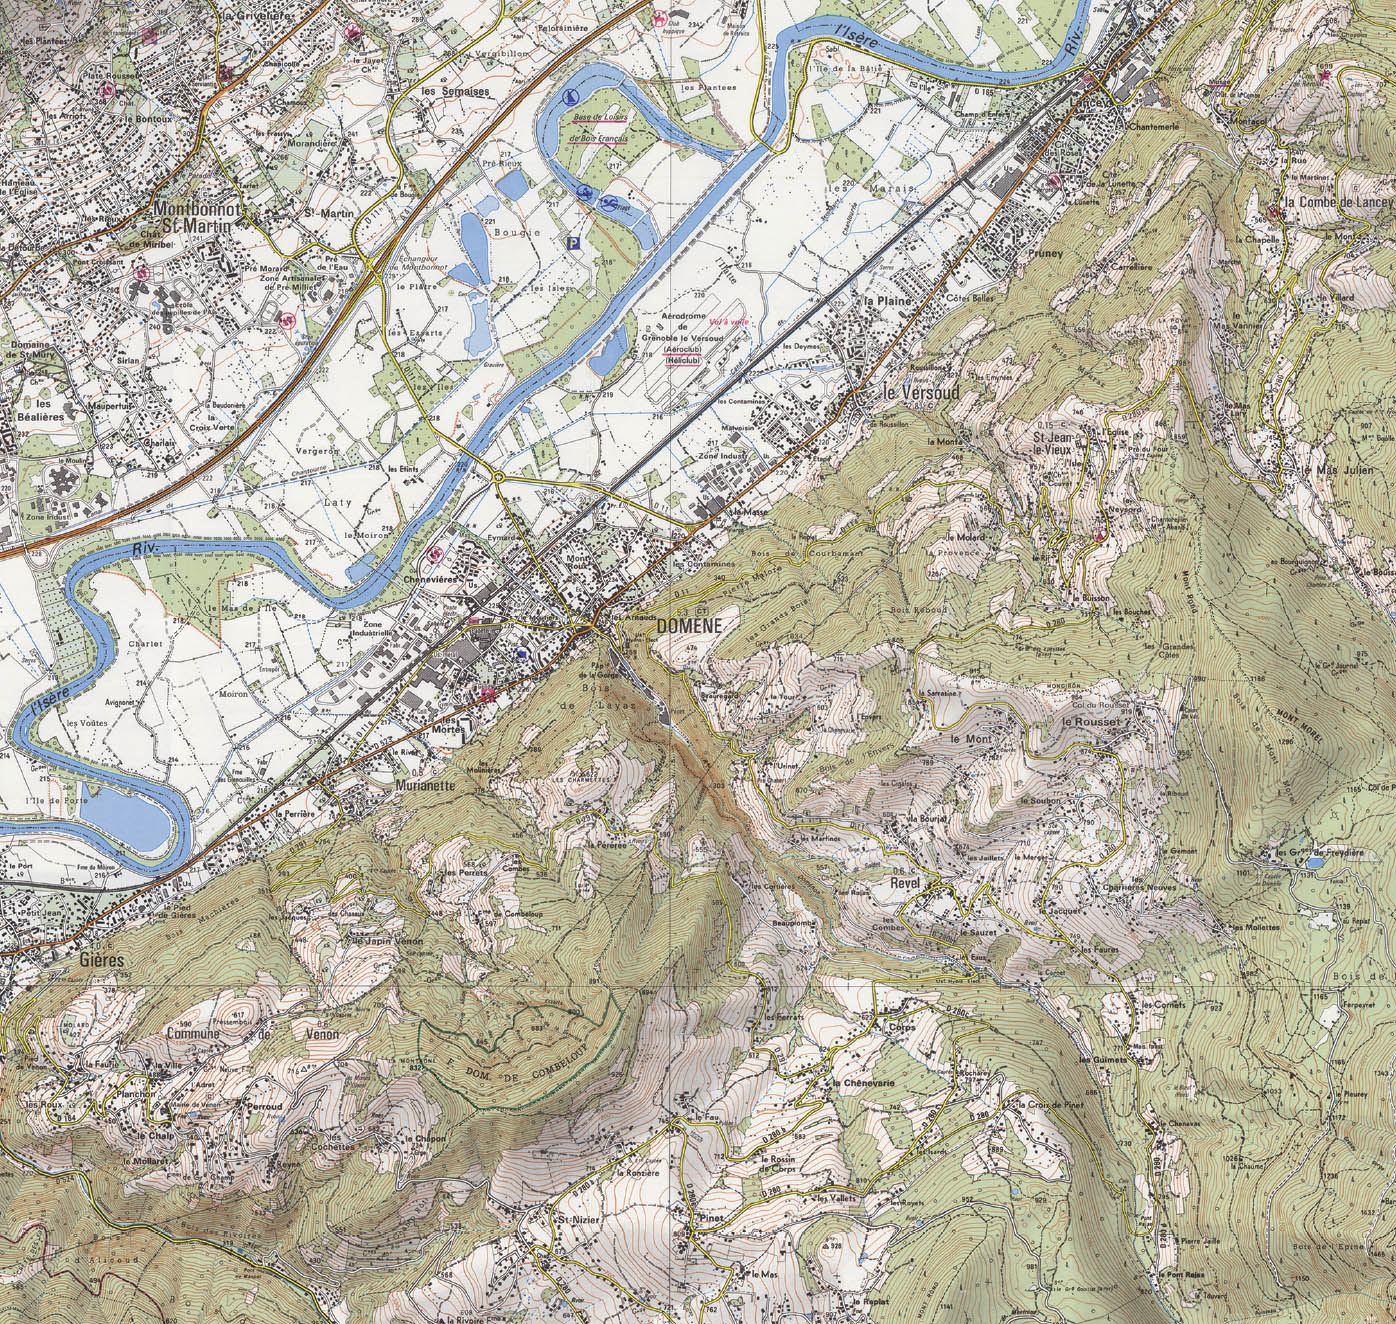
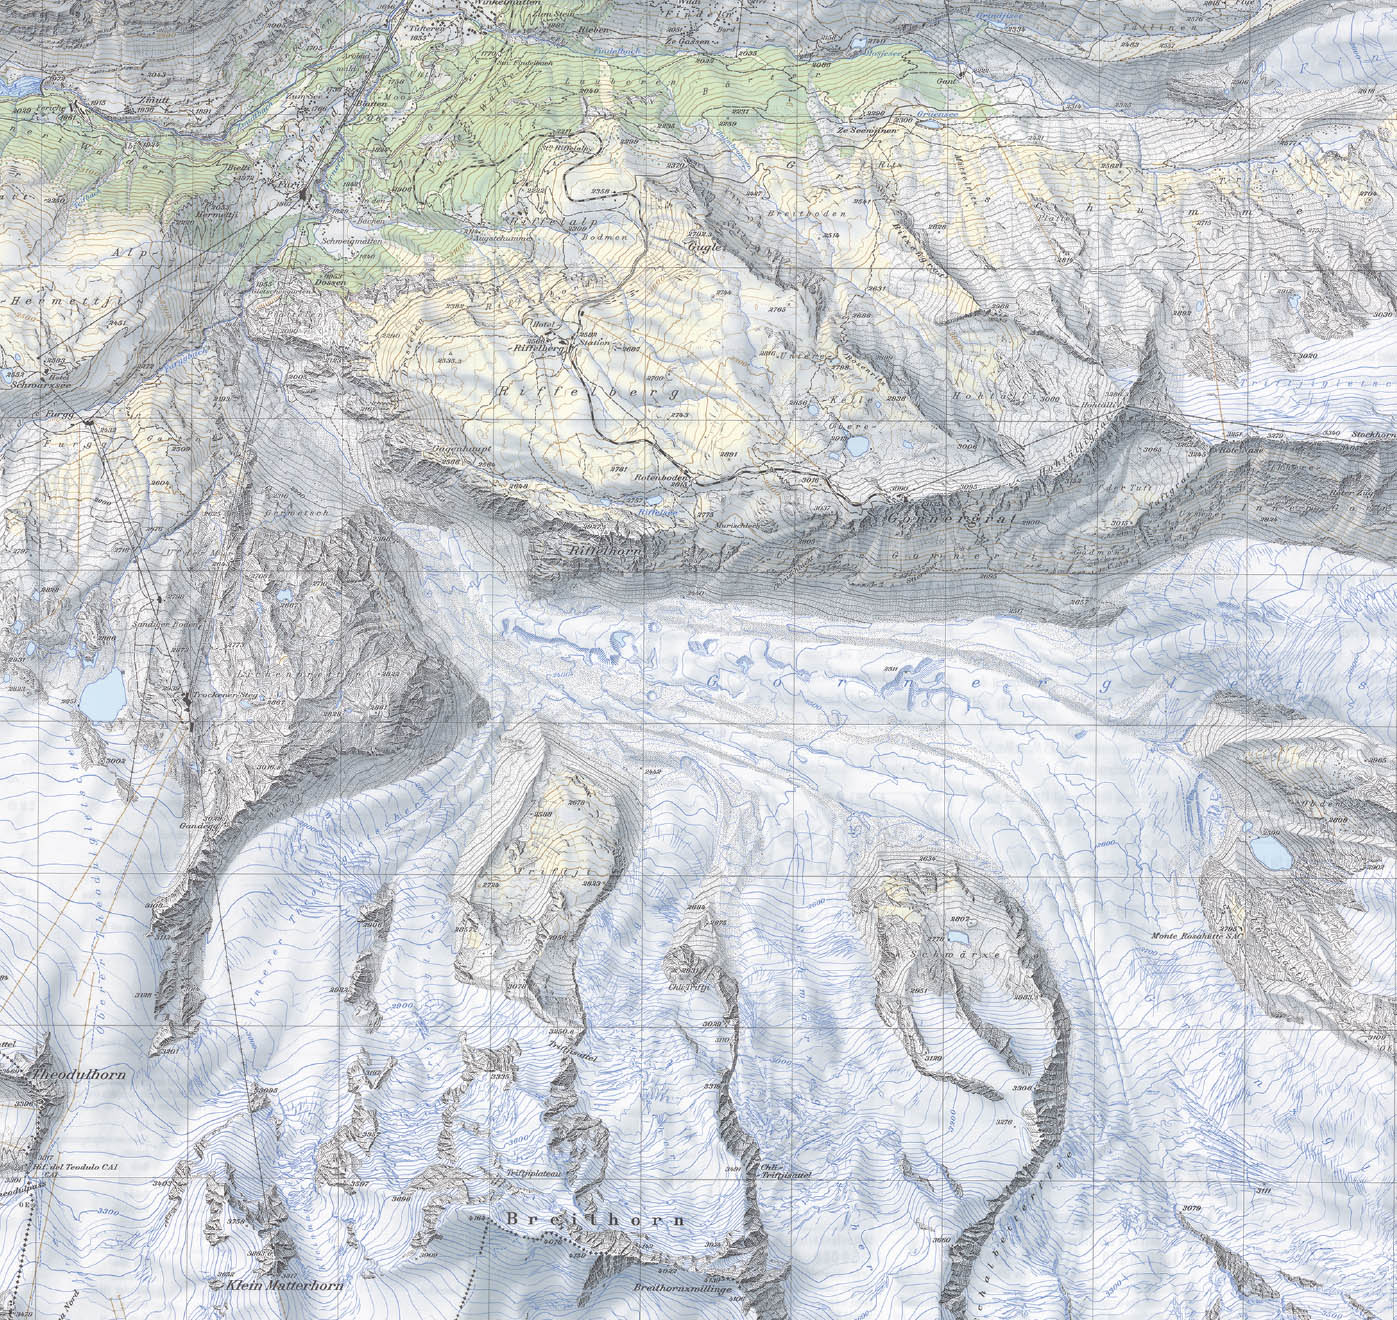
The currency of some maps rises above others, likely reflective of available resources. The maps of Nepal and Rhodesia are drawn at 1:25,000 but from coarser 1:50,000 surveys, including contours at twenty-meter intervals (SEE CHAPTER 02) and emphasizing boundaries and roads over terrain information. The Indonesian map is drawn from 1:50,000 aerial photographs, with a contour interval of 12.5 meters to describe the relatively flat terrain. The taxonomy of land uses is coarse with an emphasis on infrastructure and exploitable natural resources. By contrast, the French focus on topography, with tighter ten-meter contours. The Swiss topographic maps have twenty-meter contours for legibility of the extreme topography on the paper 1:25,000 maps but offer frequently updated data digitally accurate to 1.5 meters for the entire country and to 0.5 meters in areas of open terrain. The maps are not only sophisticated in their rendering, combining shaded relief with vector line work, but are unparalleled in their precise quantification and qualification of the landscape.
Scale is a powerful tool, one that relates subject and representation, governs content selection and detail, and indicates levels of measurement, knowledge, and access. The following six maps demonstrate the representational similarities and differences across a sample of large-scale topographic maps, revealing both conventional techniques and sociopolitical and economic divergences. They set the tone for the scale of maps and plans that follow, where the intimate prevails over the global, the tactile over the intangible, the precise over the general.
1The “1:24,000” denotes the scale of the map, and “7.5 minutes” describes the area of the map as covering approximately 7.5 minutes of latitude and longitude. The total area covered on each sheet varies by geographical position, ranging from sixty-four square miles at latitude 30 degrees north to forty-nine square miles at latitude 49 degrees north.
0.1
37.7750° N, 122.4183° W,
United States Geological Survey, San Francisco North, 1993. Scale: 1:24,000 (shown at half size).
0.2
26.4833° N, 87.2833° E,
Survey Department, His Majesty’s Government of Nepal (with the Government of Finland), Dhangadhi, 1997. Scale: 1:25,000 (shown at half size).
0.3
6.3201° S, 106.6656° E,
Badan Koordinasi Survei dan Pemetaan Nasional (Bakosurtanal), Serpong, 1990. Scale: 1:25,000 (shown at half size).
0.5
45.1900° N, 5.7200° E,
Institut National de l’Information Géographique et Forestière, Grenoble, 1992. Scale: 1:25,000 (shown at half size).