CHAPTER 08
CROSS SECTION
A drawing cut along a predetermined line perpendicular to the plan view to reveal elevation, depth, and structural and material composition. An orthographic view of an object taken from the position of a cutting plane to describe internal organization.
The cross section is both a signature feature of the geological map and a fundamental type of orthographic drawing in architecture and its cognate disciplines. The sectional view complements the plan while affording an understanding of material and structural relationships. In one view, sections trace a given line through a landscape, articulating the rise and fall of the topography through the known and unknown qualities of the material above and below.
In geological cartography, the cross section and map are two representations of the same spatial condition: the distribution of rock layers. The section affords a more striking depiction of the rock-bed geometry, including dip, thickness, and depth, while the map describes the broader organization. Sections are used both as tools of discovery, to find relationships, and as tools of measurement, to determine accurate dimensions. While the section is usually derived from the planar map, in some instances the planar view is extrapolated from surveyed sections. Taken together, the section and the plan, both two-dimensional projections, describe the three-dimensional subsurface condition. The stratigraphic column (SEE CHAPTER 07) provides the key and color scheme for both. The direction of the section-cut line is important and is best taken perpendicular to the rock strike or other depicted element to reveal structural and material characteristics while minimizing distortion. The sections often focus solely on geologic properties, describing what occurs below the surface without the buildings and landscapes that sit atop geologic dips and folds. However, when taken through urban conditions, the high elevations—the hilly landmarks—are unmistakable. [FIG. 8.3]
Sections in the design disciplines share remarkable similarities with their geologic counterparts. Both serve the dual purpose of reconnaissance and measure. These reveal thickness and structure and more often result from rather than generate the plan. The section describes tectonics and adjacencies, explaining the internal structure and the longitudinal variation of a landscape. The relationship between surface and subsurface, explored in plan in the previous chapter, reads more directly in section. At the detail level, the section can describe the different under- and aboveground material properties. The two conditions can be starkly distinguished by emphasizing the differences between layers or blended together to read as one thickened ground. Elevation information is included to reference the physical conditions beyond the section cut, to give the slice a compressed thickness and better situate it within the landscape. In geology, the block diagram, an axonometric fragment of terrain, functions to give the section depth. Design employs parallel projection and series to describe a locality and articulate movement across a landscape.
The transect also functions to describe a trajectory across a terrain. Two figures, Prussian geographer Alexander von Humboldt and Scottish urbanist Patrick Geddes, argued for the broader use of the section to describe regions, as a vector from mountain to sea. This conceptual line holds relevance for geobotany, planning, and design alike. A tool of the geographer, who used the linear traverse as a means to understand new territory, as both a line struck across a map and a physical terrain, the transect represents both elevational difference and horizontal extent.
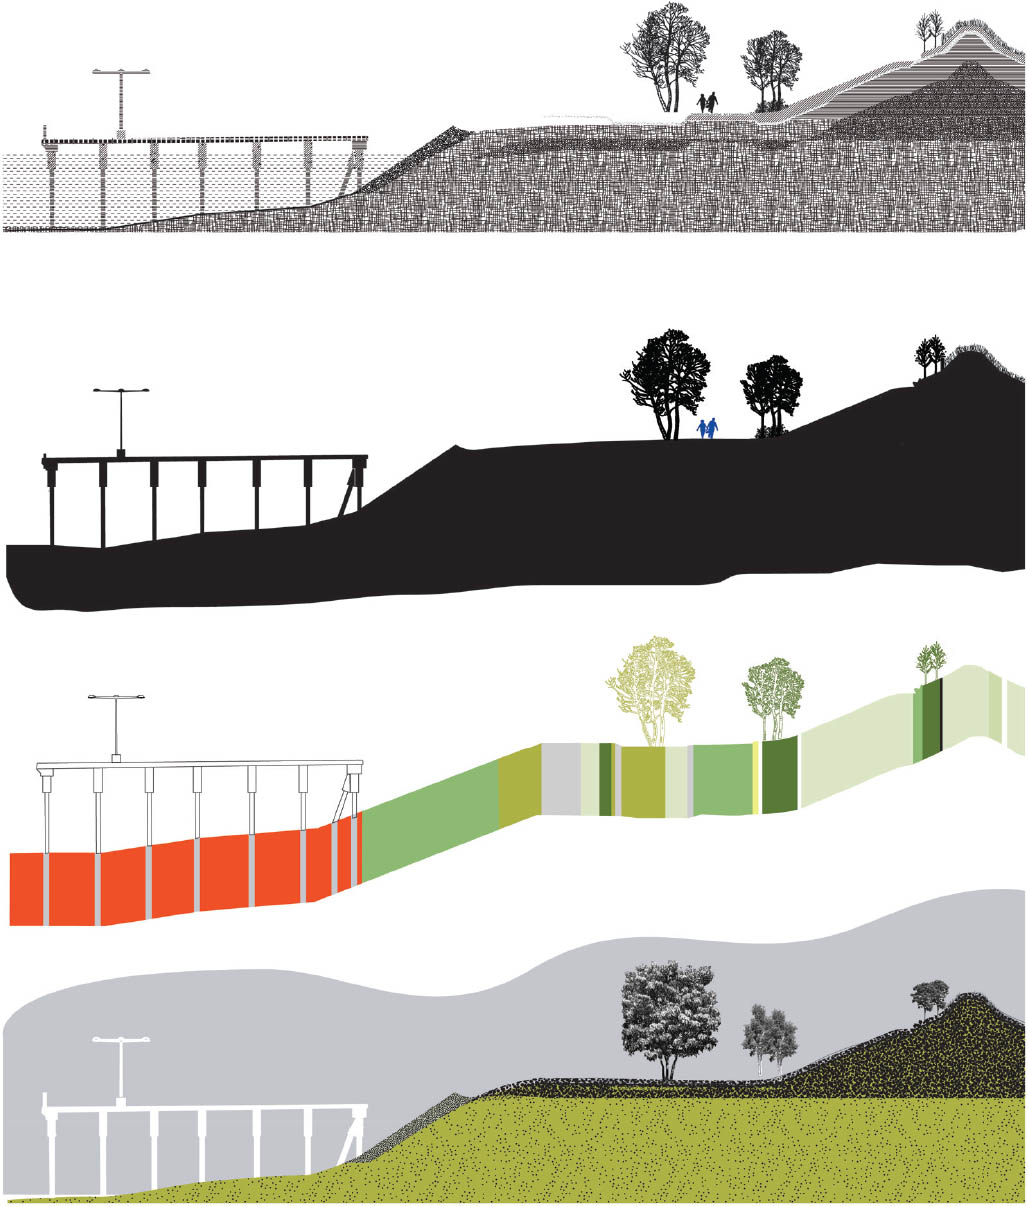
Sections can be drawn through expressive line work alone or augmented with black fills, coded colors, textures, hatches, and raster imagery. [FIG. 8.1] In order to provide more expansive readings of terrain or linkages across a landscape, both design and the geological sciences employ the serial section. In these instances, plans and sections are collapsed, especially when the sections are placed in situ, combining the two orthographic views into a single image.
This chapter explores the provocative linkages between design and cartography through sectional pairings, cutting through the gamut of representational tools and typologies in order to merge structural, temporal, and material qualities below and aboveground.
8.1
40.6975° N, 73.9992° W, Jill Desimini, Cross-Section Techniques: Brooklyn Bridge Park, 2014. After Michael van Valkenburgh Associates [FIG. 8.9], John Claudius Loudon [FIG. 8.8], Vogt Landscape Architects [FIG. 8.13], Bernardo Secchi and Paola Viganò [FIG. 8.12], and Mosbach Paysagistes [FIG. 8.7].
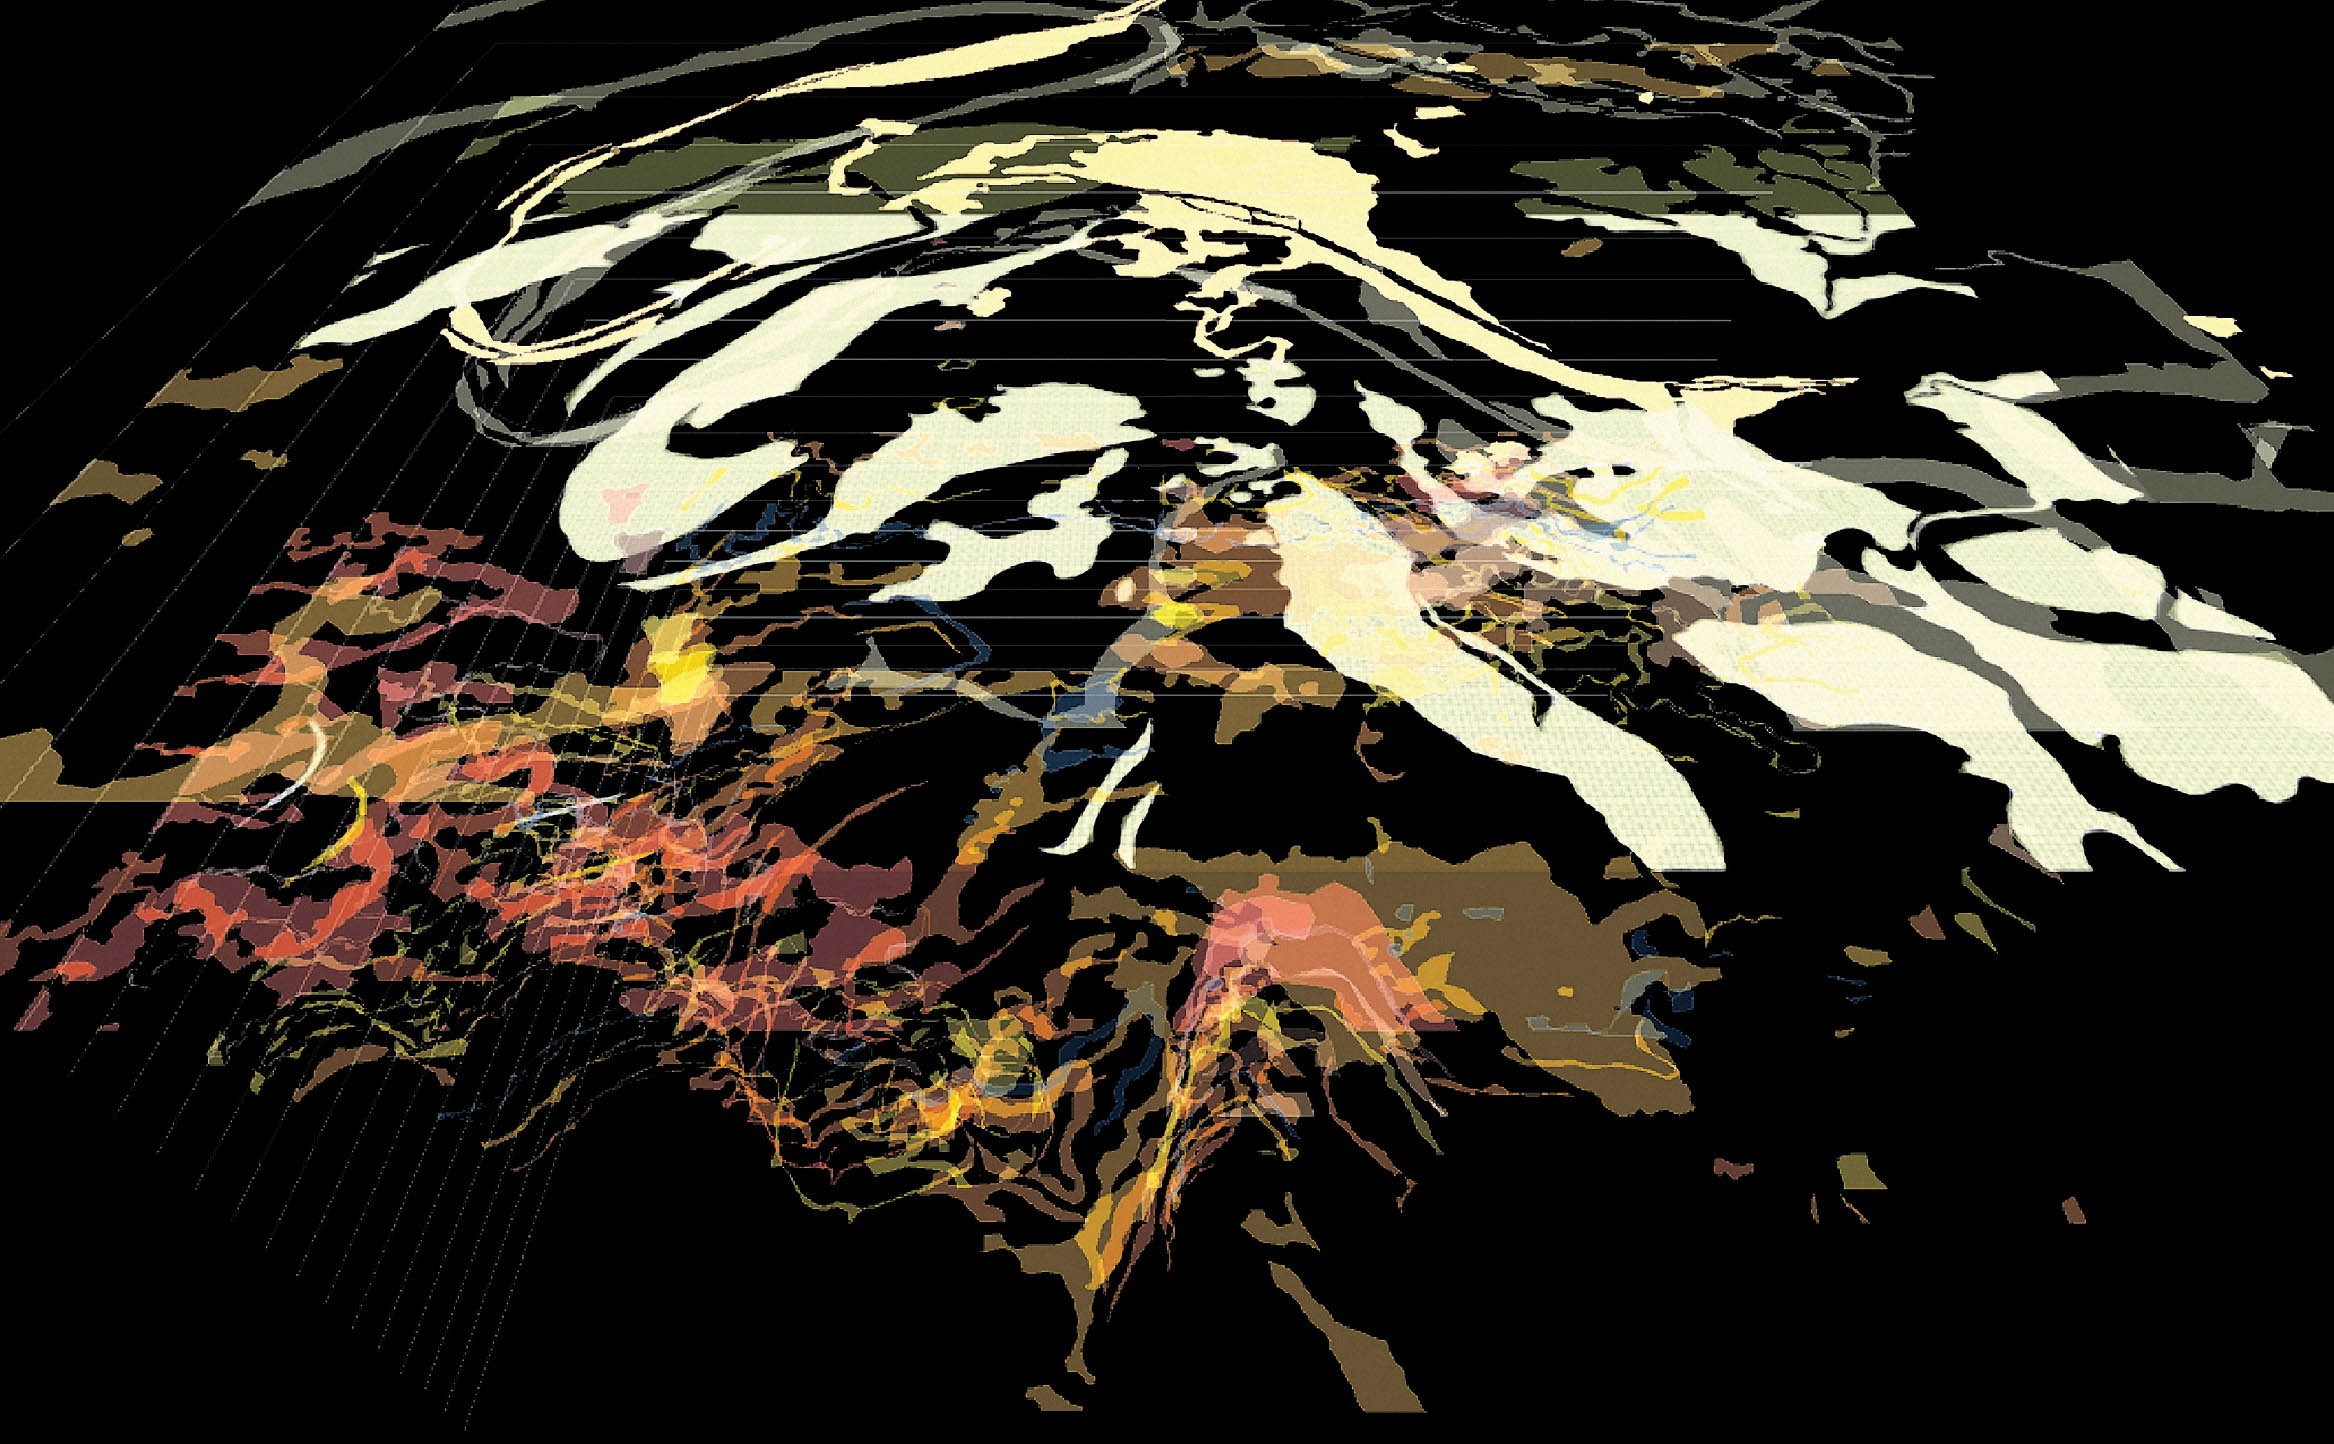
8.2
48.8742° N, 2.3470° E, Robert Gerard Pietrusko, Animation Still, 2012.
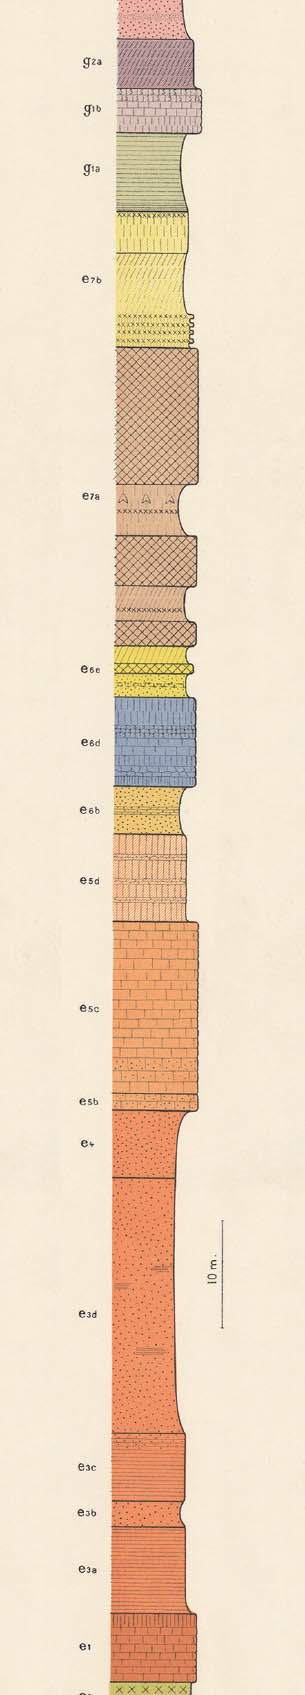
8.3
48.8742° N, 2.3470° E, Service de la Carte Géologique de la France, Paris, 1953. Horizontal scale: 1:50,000, vertical scale: 1:2,500 (geologic section shown at quarter size).
The geologic cross section on this 1953 map of Paris merges cultural and geological references, reading like a city skyline composed of rock strata. The peak of Montmartre stands prominently between the Boulevard Rochechouart and Porte de Clignancourt. The actual height is modest at 130 meters, but the significant vertical exaggeration allows for the understanding of the vertical variation in the strata and the cultural implications of the geological layers.
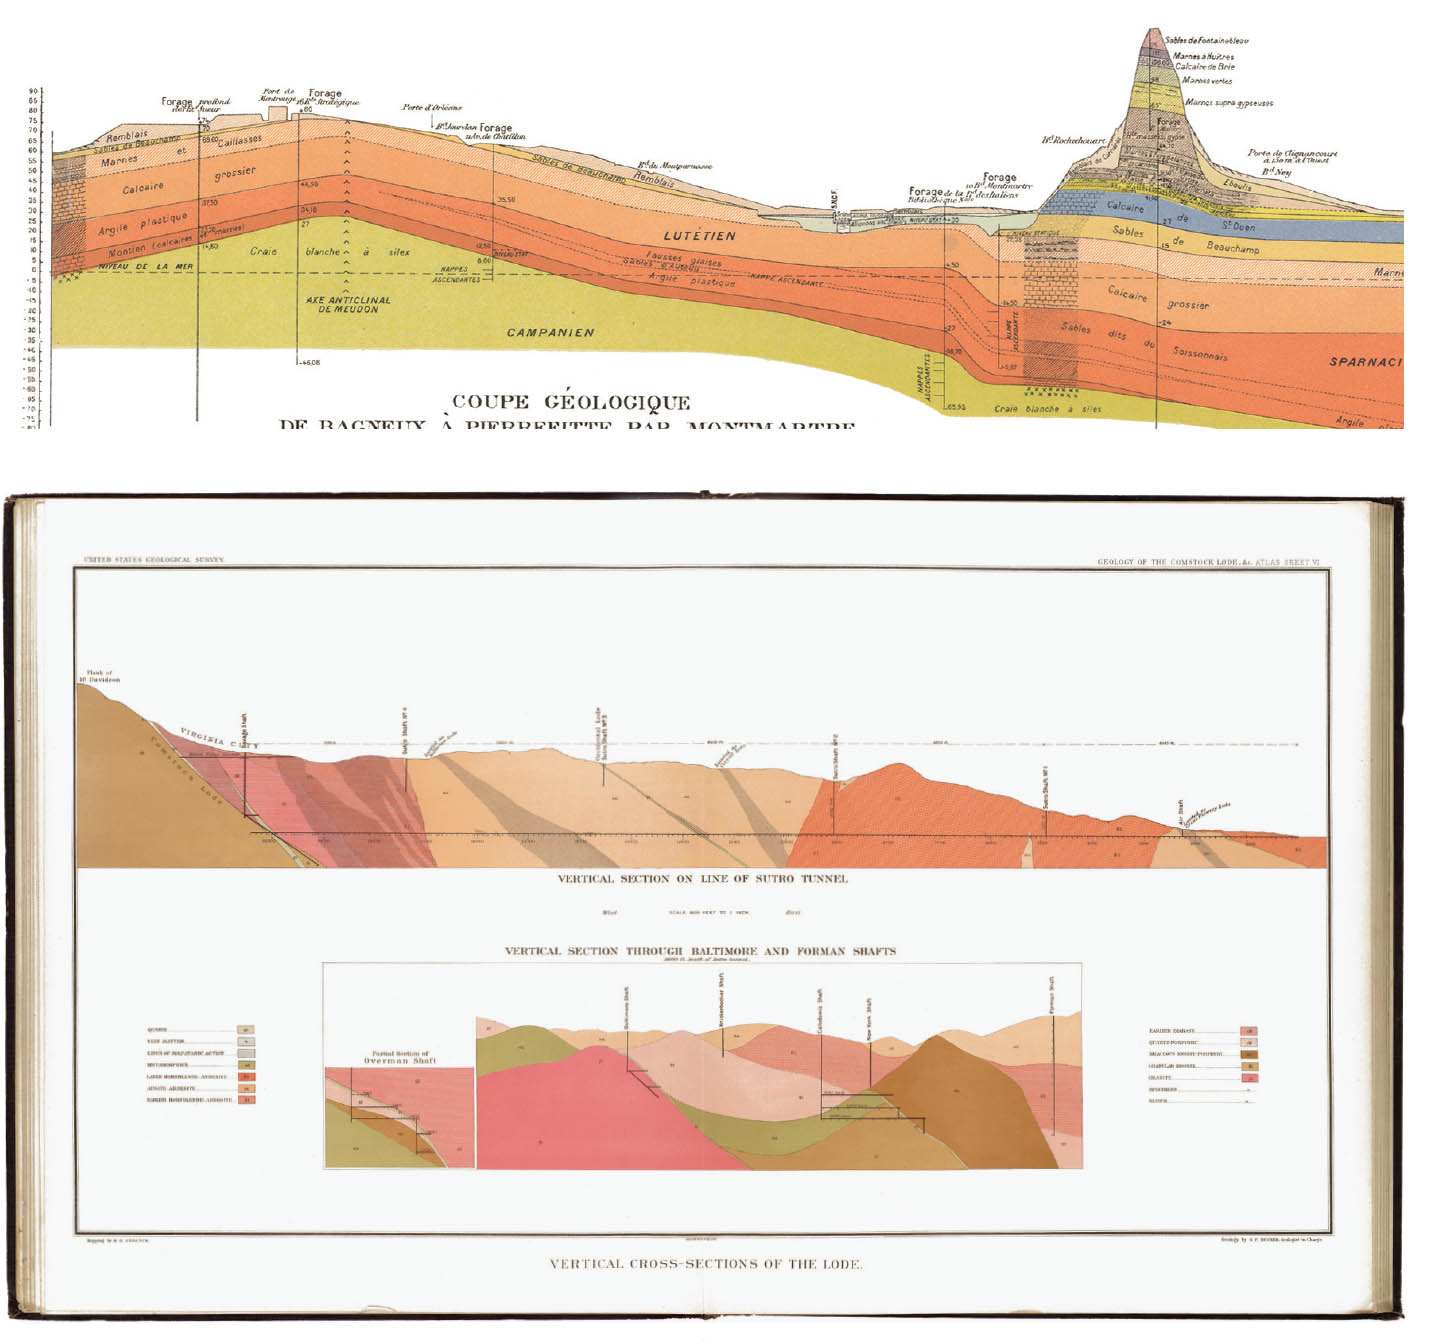
8.4
25.0333° N, 121.5333° E, George F. Becker, Vertical Cross-Sections of the Lode, 1882.
The vertical sections of the Comstock Lode, a deposit of silver ore, were prepared by George F. Becker for United Stated Geological Survey (USGS) director Clarence King. The 1880–81 survey of the lode expanded upon previous studies and revealed the true scale of the famous silver-ore deposit. The drawings created under Becker’s supervision aimed for reproduction “with absolute fidelity” and included the emerging constructed tunnels and shafts within the mine network. [FIG. 7.8]
8.5
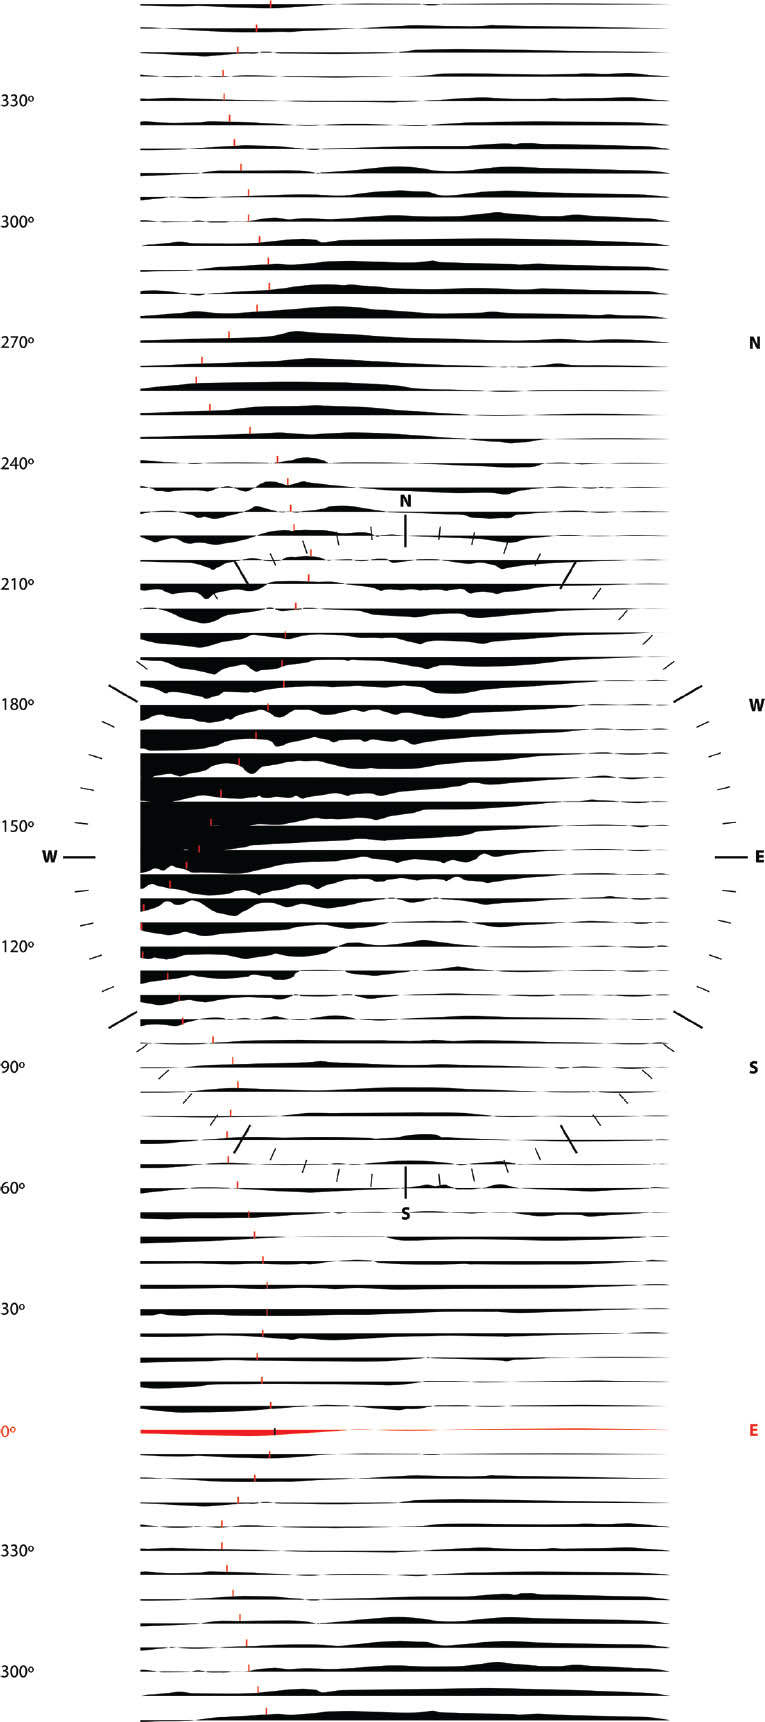
12.9667° N, 77.5667° E, Anuradha Mathur and Dilip da Cunha, Pettah 2 Plot, 2006.
The serial and planimetric sections of the Pettah site in Bangalore, India (a fortified town outside the historic fort), respond to previous site surveys, drawing heavily on measurements taken by the British army, led by General Lord Cornwallis, conducted during the British seizure of the site. The drawing marks the center of the Pettah with a compass overlaid atop the sections and references key access points depicted in the Cornwallis survey. The planimetric quality of the serial sections allows the horizontal and vertical dimensions of the landscape to be read simultaneously. The traverse, marked on the left side of the image, implies a progression across the city, reinforcing the idea of the series as a physical promenade (SEE CHAPTER 09). [FIG. 8.14]
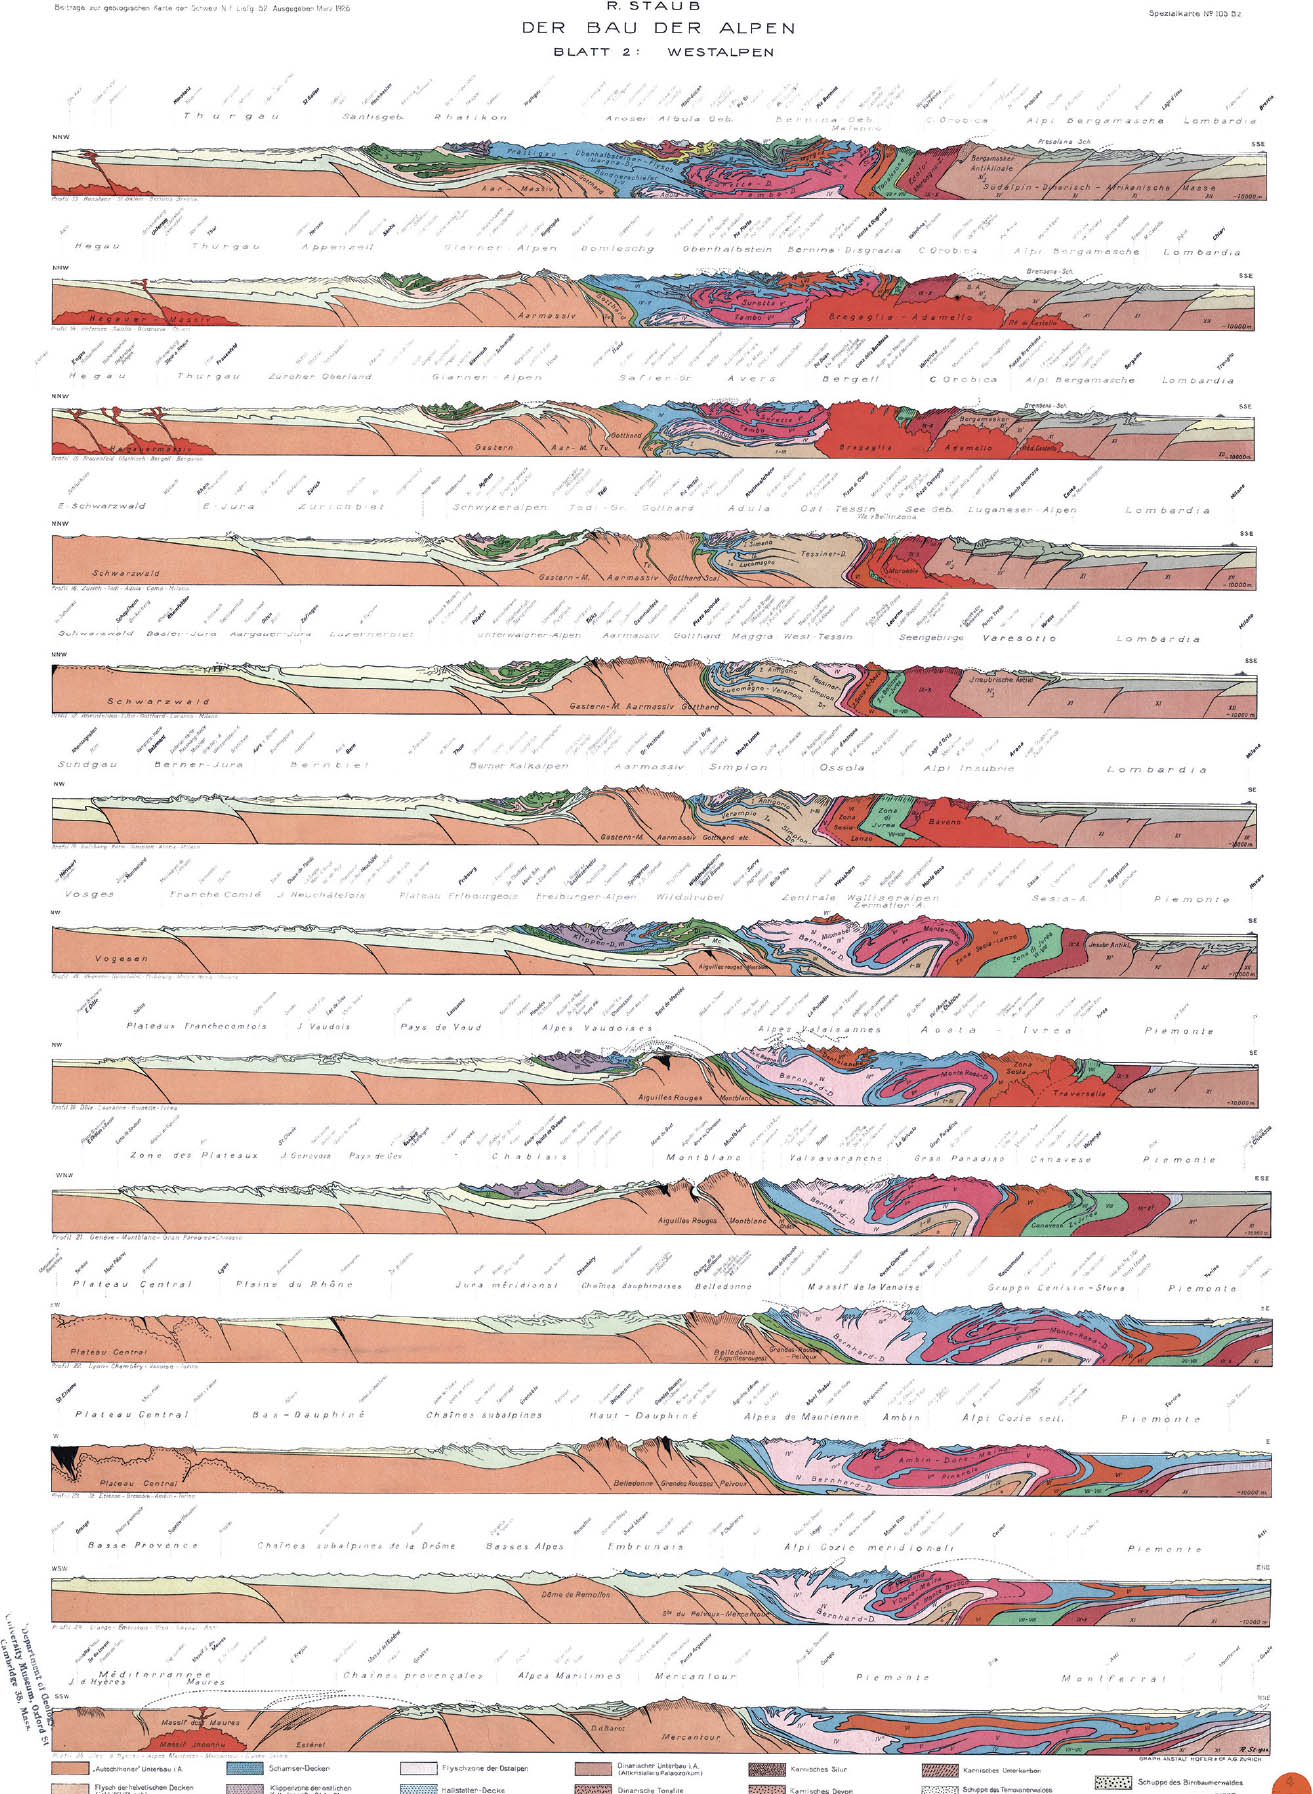
8.6
45.8336° N, 6.8650° E, Rudolf Staub, Der Bau der Alpen: Blatt 2: Westalpen, 1926.
Rudolf Staub, a Swiss petrographer and mountain climber, produced a series of twenty-five cross sections—arranged on two sheets—of the complex nappes (large bodies, or sheets, of rock that have been moved a distance of two kilometers or more from their original position by faulting or folding) in the Alps region. The sections reveal the structural formation of the range, describing the geological convergences that shape it. The interplay of tectonic layers is invisible on the surface but can be rendered through the sequence of sectional slices. Arranging the sections across the entire sheet allows the plan and the three-dimensional nature of the entire range to read through the series.
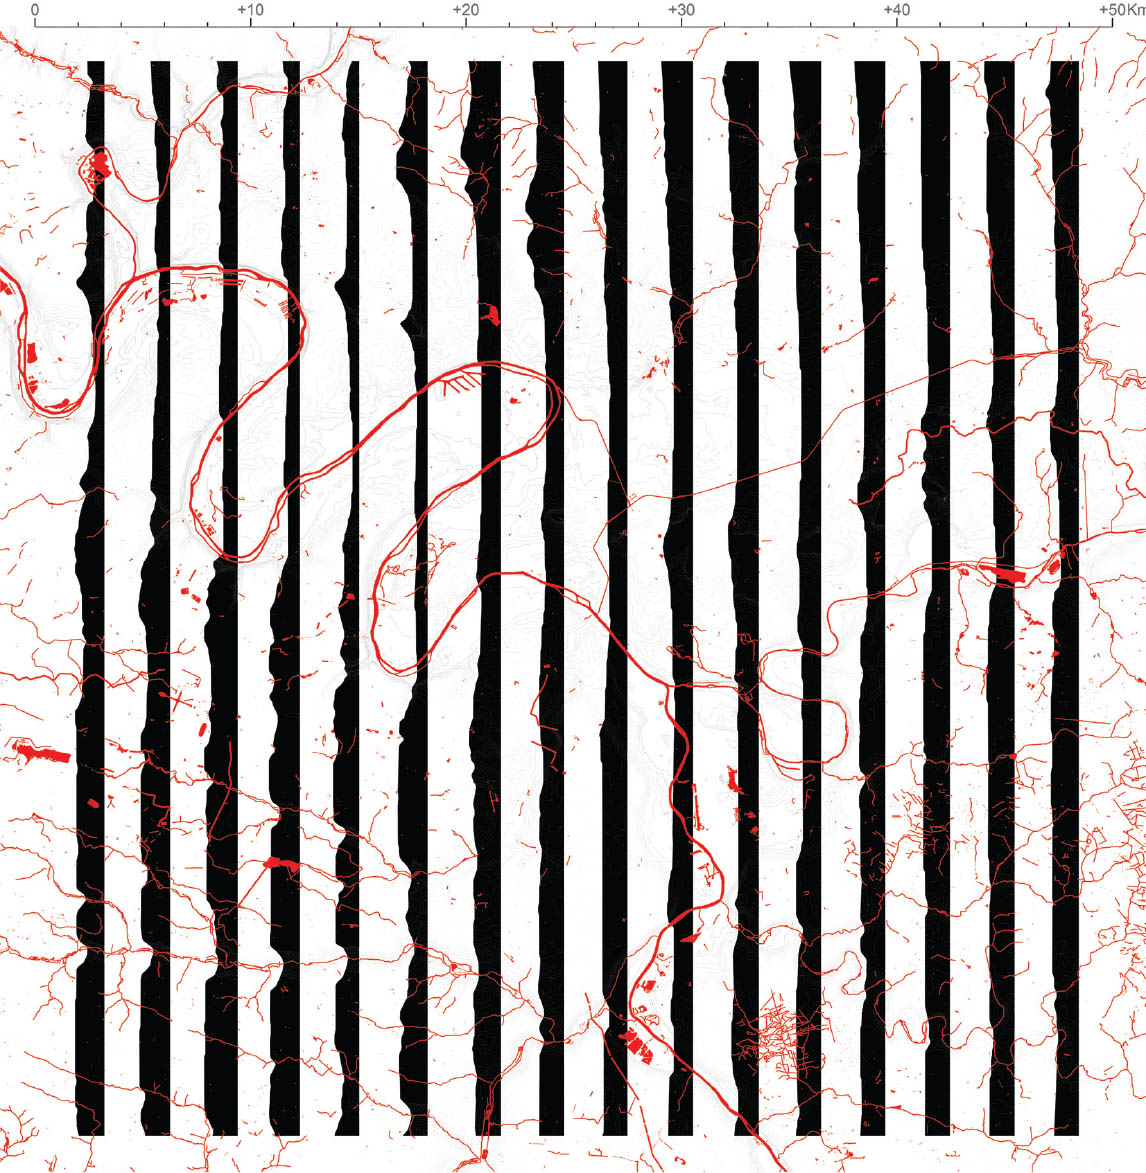
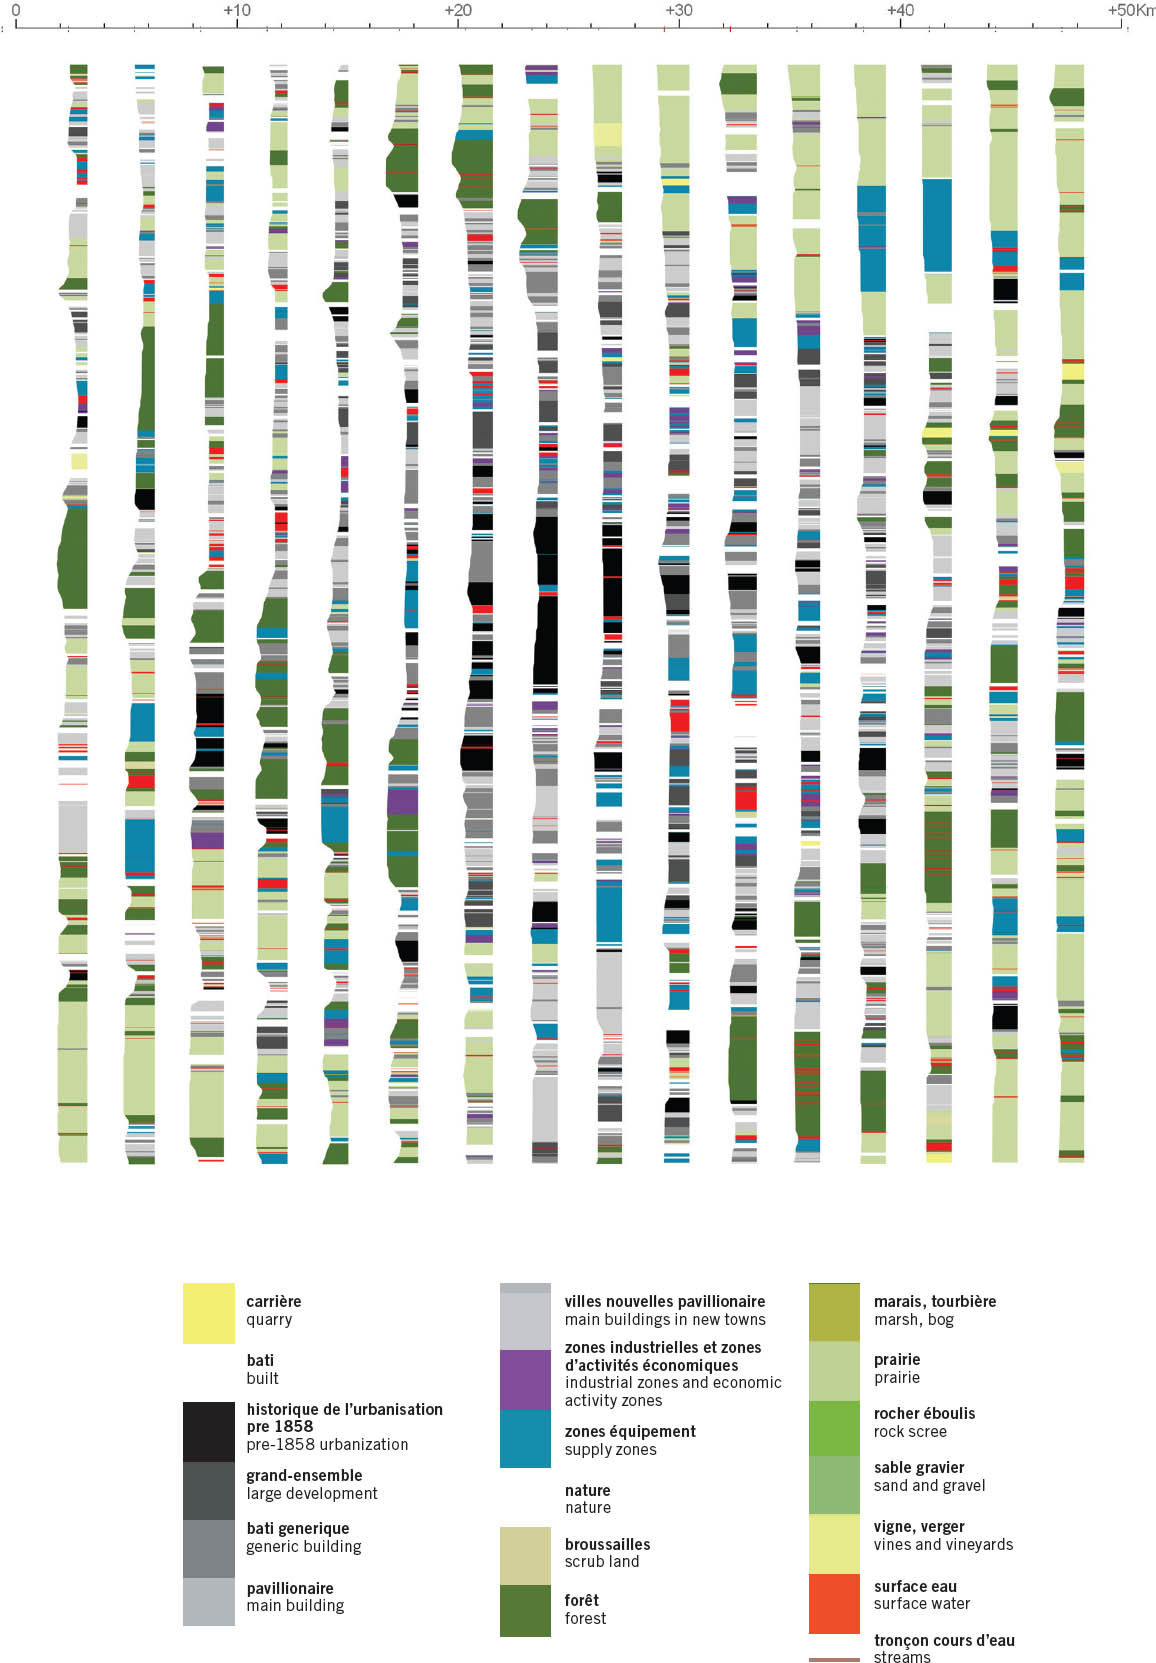
8.7
48.8742° N, 2.3470° E, Bernardo Secchi Paola Viganò, The Porous City, 2009.
The paired sectional drawings of the Italian urbanists Bernardo Secchi and Paola Viganò’s proposal for the Le Grand Paris project reveal the hydrological and land-use parameters driving the design. The black and red series describes the relationship between the extensive regional river system, highlighted in red, and the topographical relief. The planning concept works to reveal the presence of the water cycle in the city and improve the quality and retention of water in the post-Kyoto metropolis. The color-coded, stratigraphic column–like sections describe the changing land use across the greater conurbation. Both sections reinforce the notion of the Paris of the future as a “porous city” capable of effectively absorbing water, nutrients, and people and of promoting sustained health for the region.
8.8
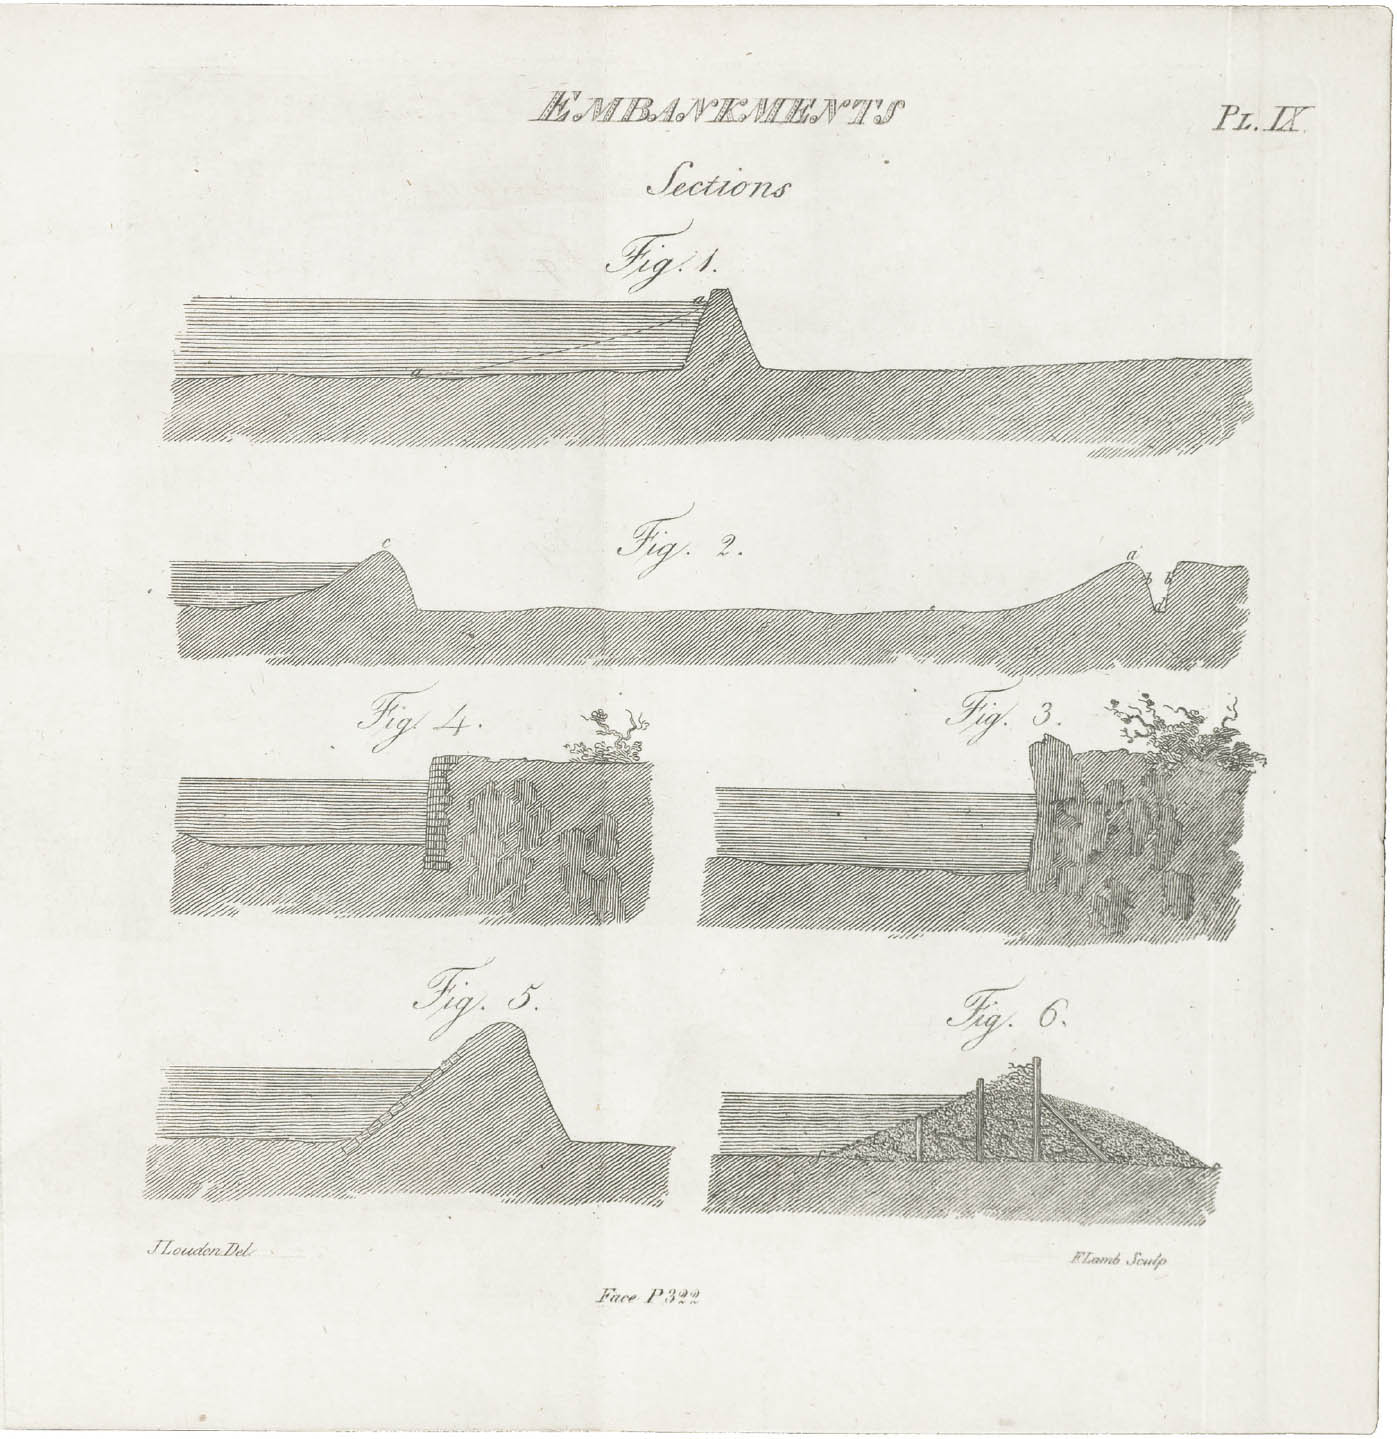
John Claudius Loudon, Observations on the Formation and Management of Useful and Ornamental Plantations: On the Theory and Practice of Landscape Gardening; and on Gaining and Embanking Land from Rivers or the Sea (Edinburgh: Constable, 1804), plate IX.
John Claudius Loudon, a self-described landscape planner, produced a number of popular texts on the art of landscape design. His texts were illustrated, depicting exemplary landscape construction. Plate IX depicts various figures of sea walls and embankments shown in section. The hatches and annotations describe the distinctions between man-made and natural materials, the compaction levels, and the crucial design components. The palette is limited but efficient and effective. The side-by-side comparison of various construction types allows the differences to read much like contemporary sheets of construction drawings, where similar elements are detailed together and referenced to plans and sections to show location. [FIG. 8.9]
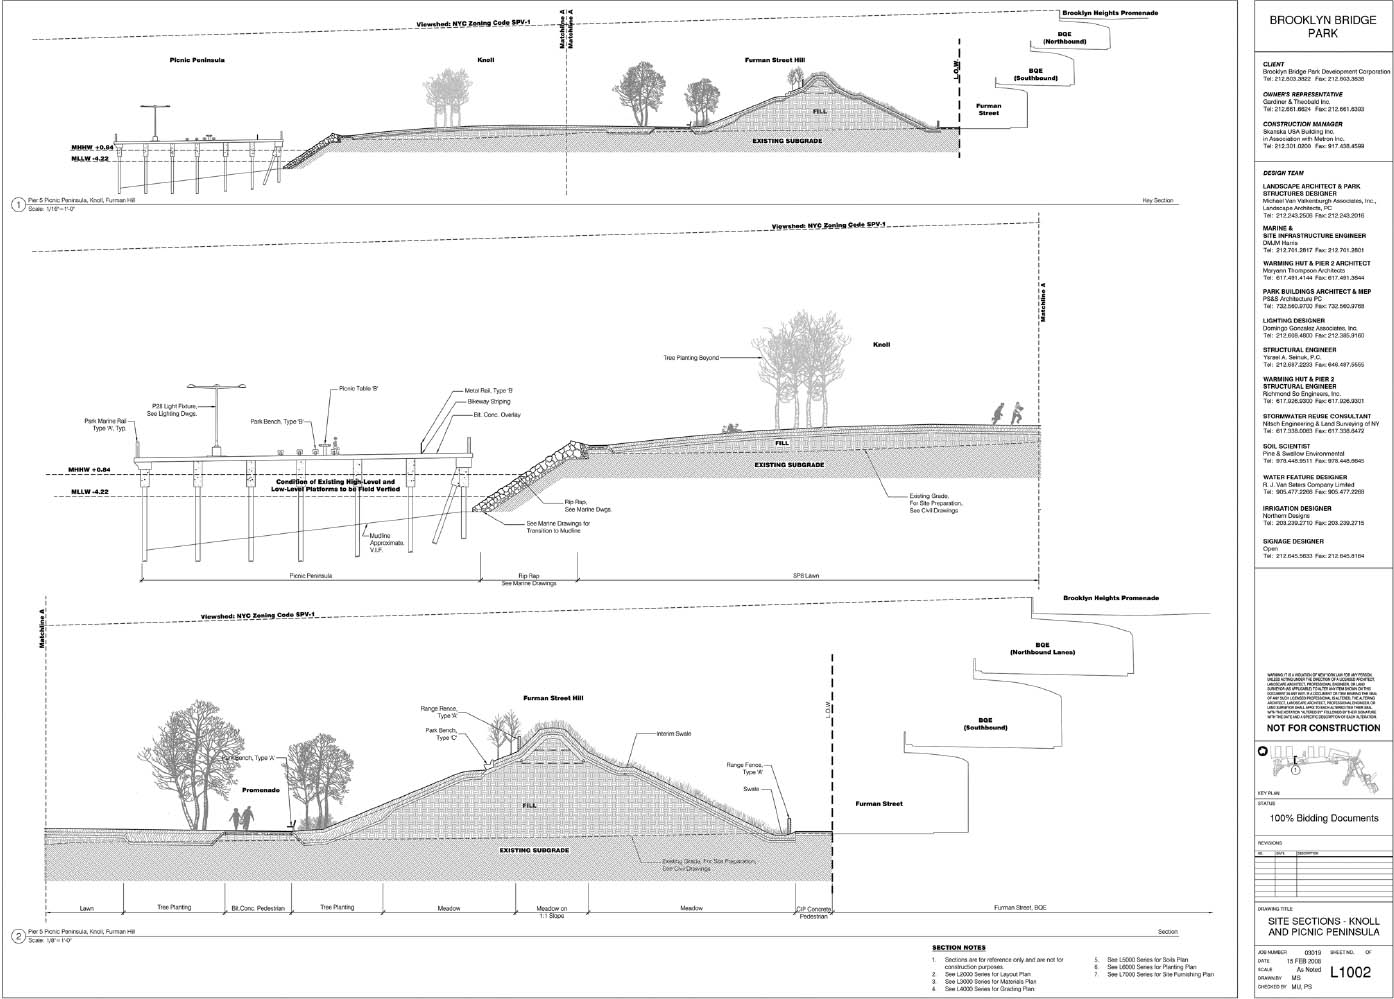
8.9
40.6975° N, 73.9992° W, Michael van Valkenburgh Associates, Brooklyn Bridge Park, 2008.
The construction sections of Pier 5 in Brooklyn Bridge Park express the topographic sequence from the East River to the Brooklyn-Queens Expressway. It shows the relationship of elements (the picnic peninsula extending into the river and giant sound-attenuating Furman Hill next to the busy highway) and the material composition of the constructed ground (concrete decking on piers, fill on existing subgrade, bituminous concrete on aggregate, and planting medium on subgrade). The sectional view provides a multilayered understanding of both existing (highways) and new (piers and promenades) infrastructure while marking the changing environments below these elevated elements: the tidal flux levels and the circulation.
8.10
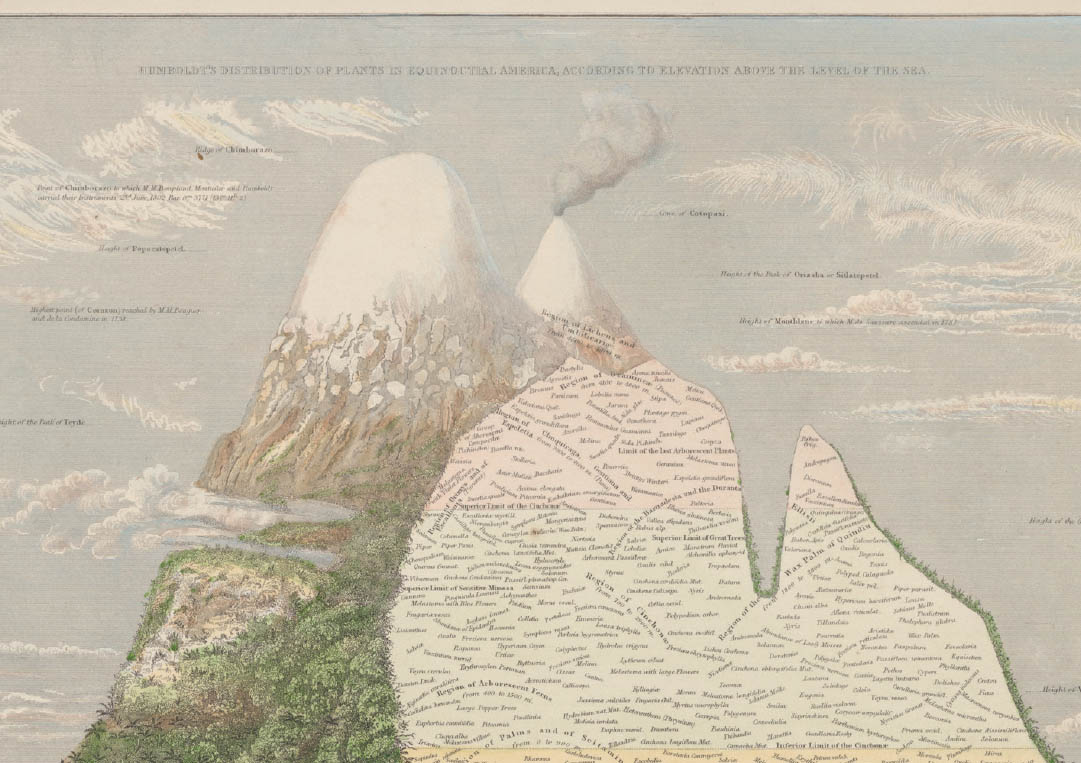
1.4692° S, 78.8175° W, Alexander von Humboldt, Humboldt Distribution of Plants in Equinoctial America: According to Elevation above the Level of the Sea, 1854.
Alexander von Humboldt wrote frequently about the need for an integrated global perspective on ecology and illustrated his views with images of the richly intertwined ecological networks he encountered in the tropics. His early observations in Europe (noted first at the volcano on Tenerife, the largest and most populous of the Canary Islands) and further, more thorough observations in South America revealed new patterns of vegetation zones in relation to geology, topography, and climate. This exaggerated, iconic section of ecotones within the Mount Chimborazo region in Ecuador provides a perfect graphic frame to relate vegetal information and climate zones through the clever juxtaposition of text and image.
8.11
0.2186° S, 78.5097° W, Felipe Correa, The Section as a Tool: A Regional Framework for Alexander von Humboldt’s Avenue of the Volcanoes, 2004. Scale: approx. 1:30,000 (shown at half size).
The Section as a Tool, as the name suggests, is an effort to establish the relevance of the section as an urban-design apparatus, one that better addresses the relationship of topography and urbanization than the ubiquitous plan. San Francisco de Quito—a city in Ecuador located ten thousand feet above sea level and located within the Ecuadorian sierras that Alexander von Humboldt called the Avenue of the Volcanoes—is the testing ground. The sequence of sections through the mountainous region mark the operations of cut and fill required to level the ground for human occupation.
8.12
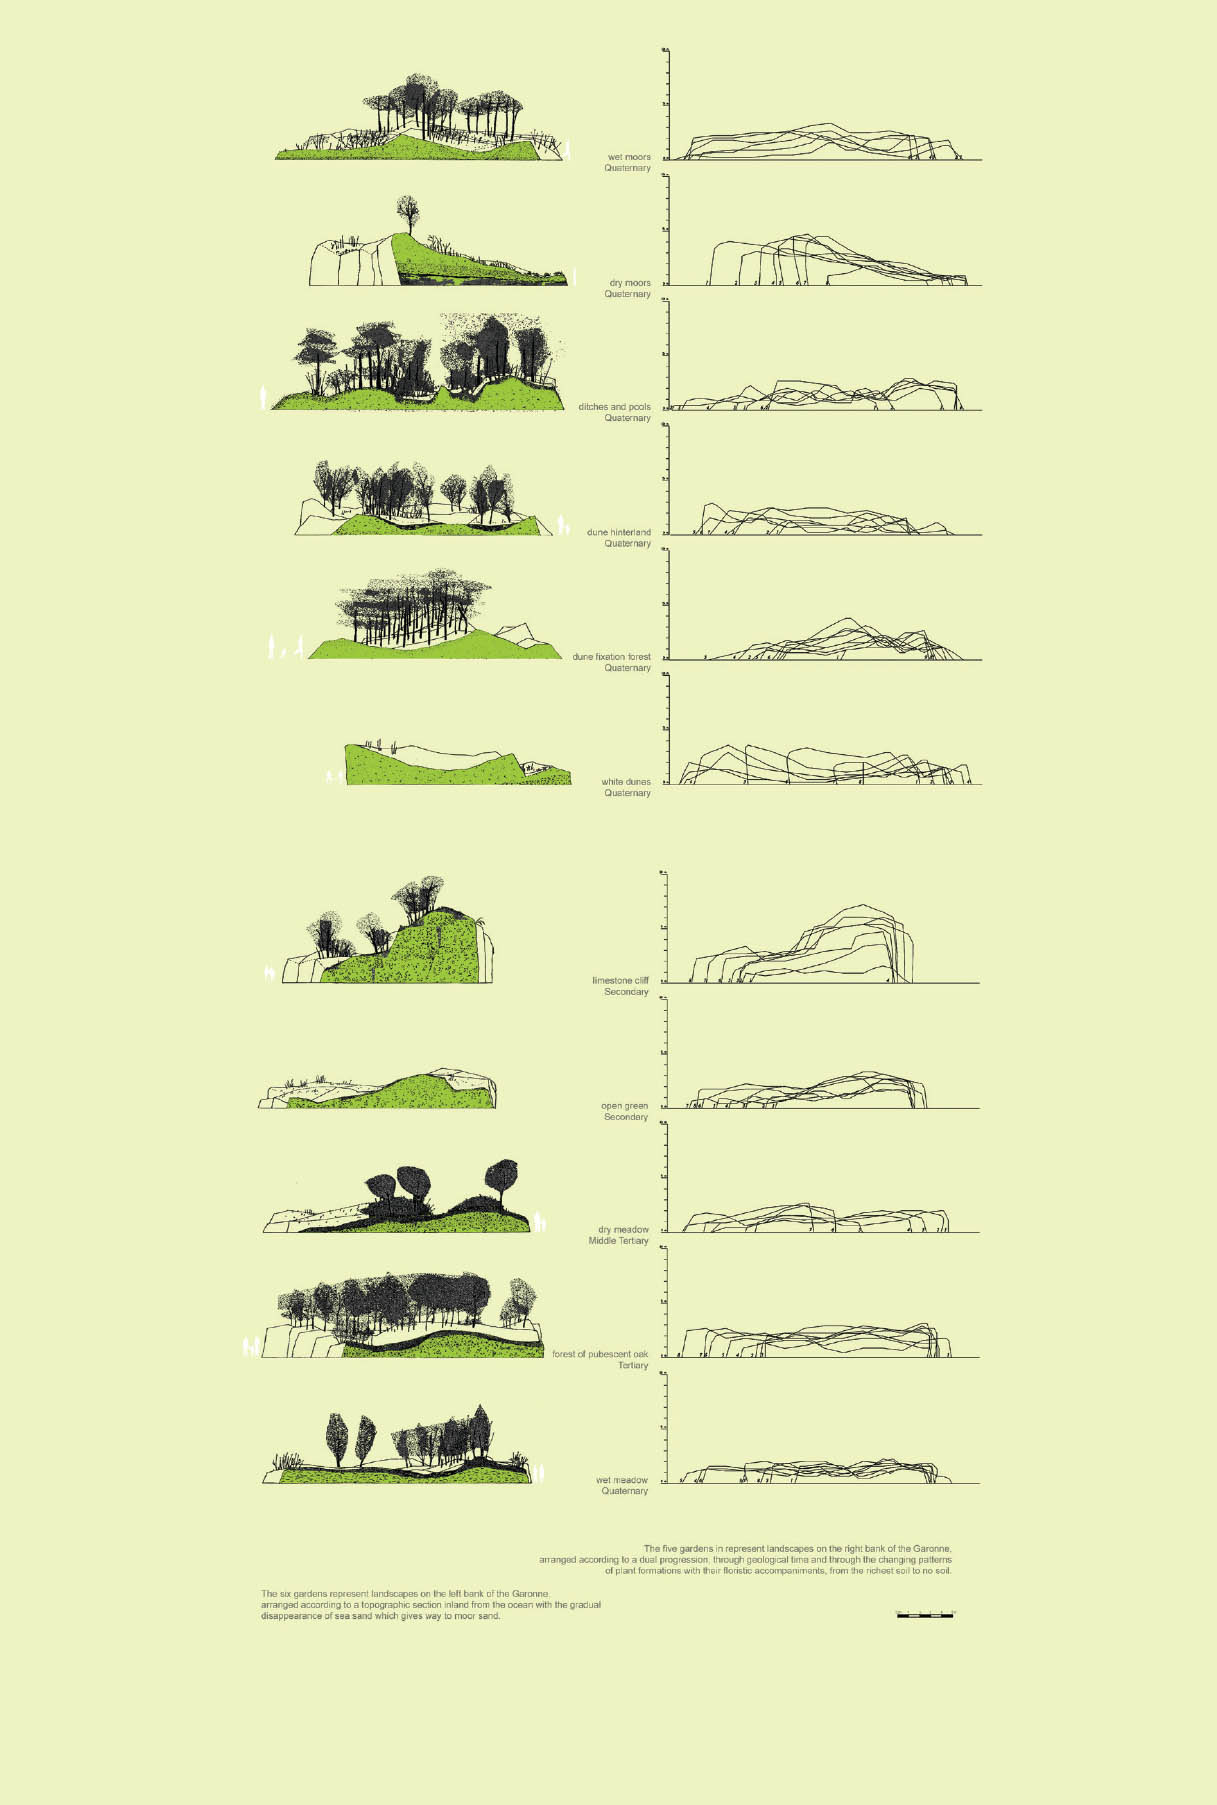
44.8386° N, 0.5783° W, Mosbach Paysagistes, Bordeaux Botanical Garden: Sections of the Environment Gallery, 2000–2.
The Bordeaux Botanical Gardens is a 4.8-hectare site designed as research facility, conservatory, laboratory, and community garden organized by topography and microclimate. The superimposed sections allow for the topographical shifts to register, and the shifts themselves reveal material stratification. The sections are organized to show the ecological transformation of the environment from sea to moor, the corresponding layers of geological epochs, and the responsive vegetation patterns governed by the different soil conditions.
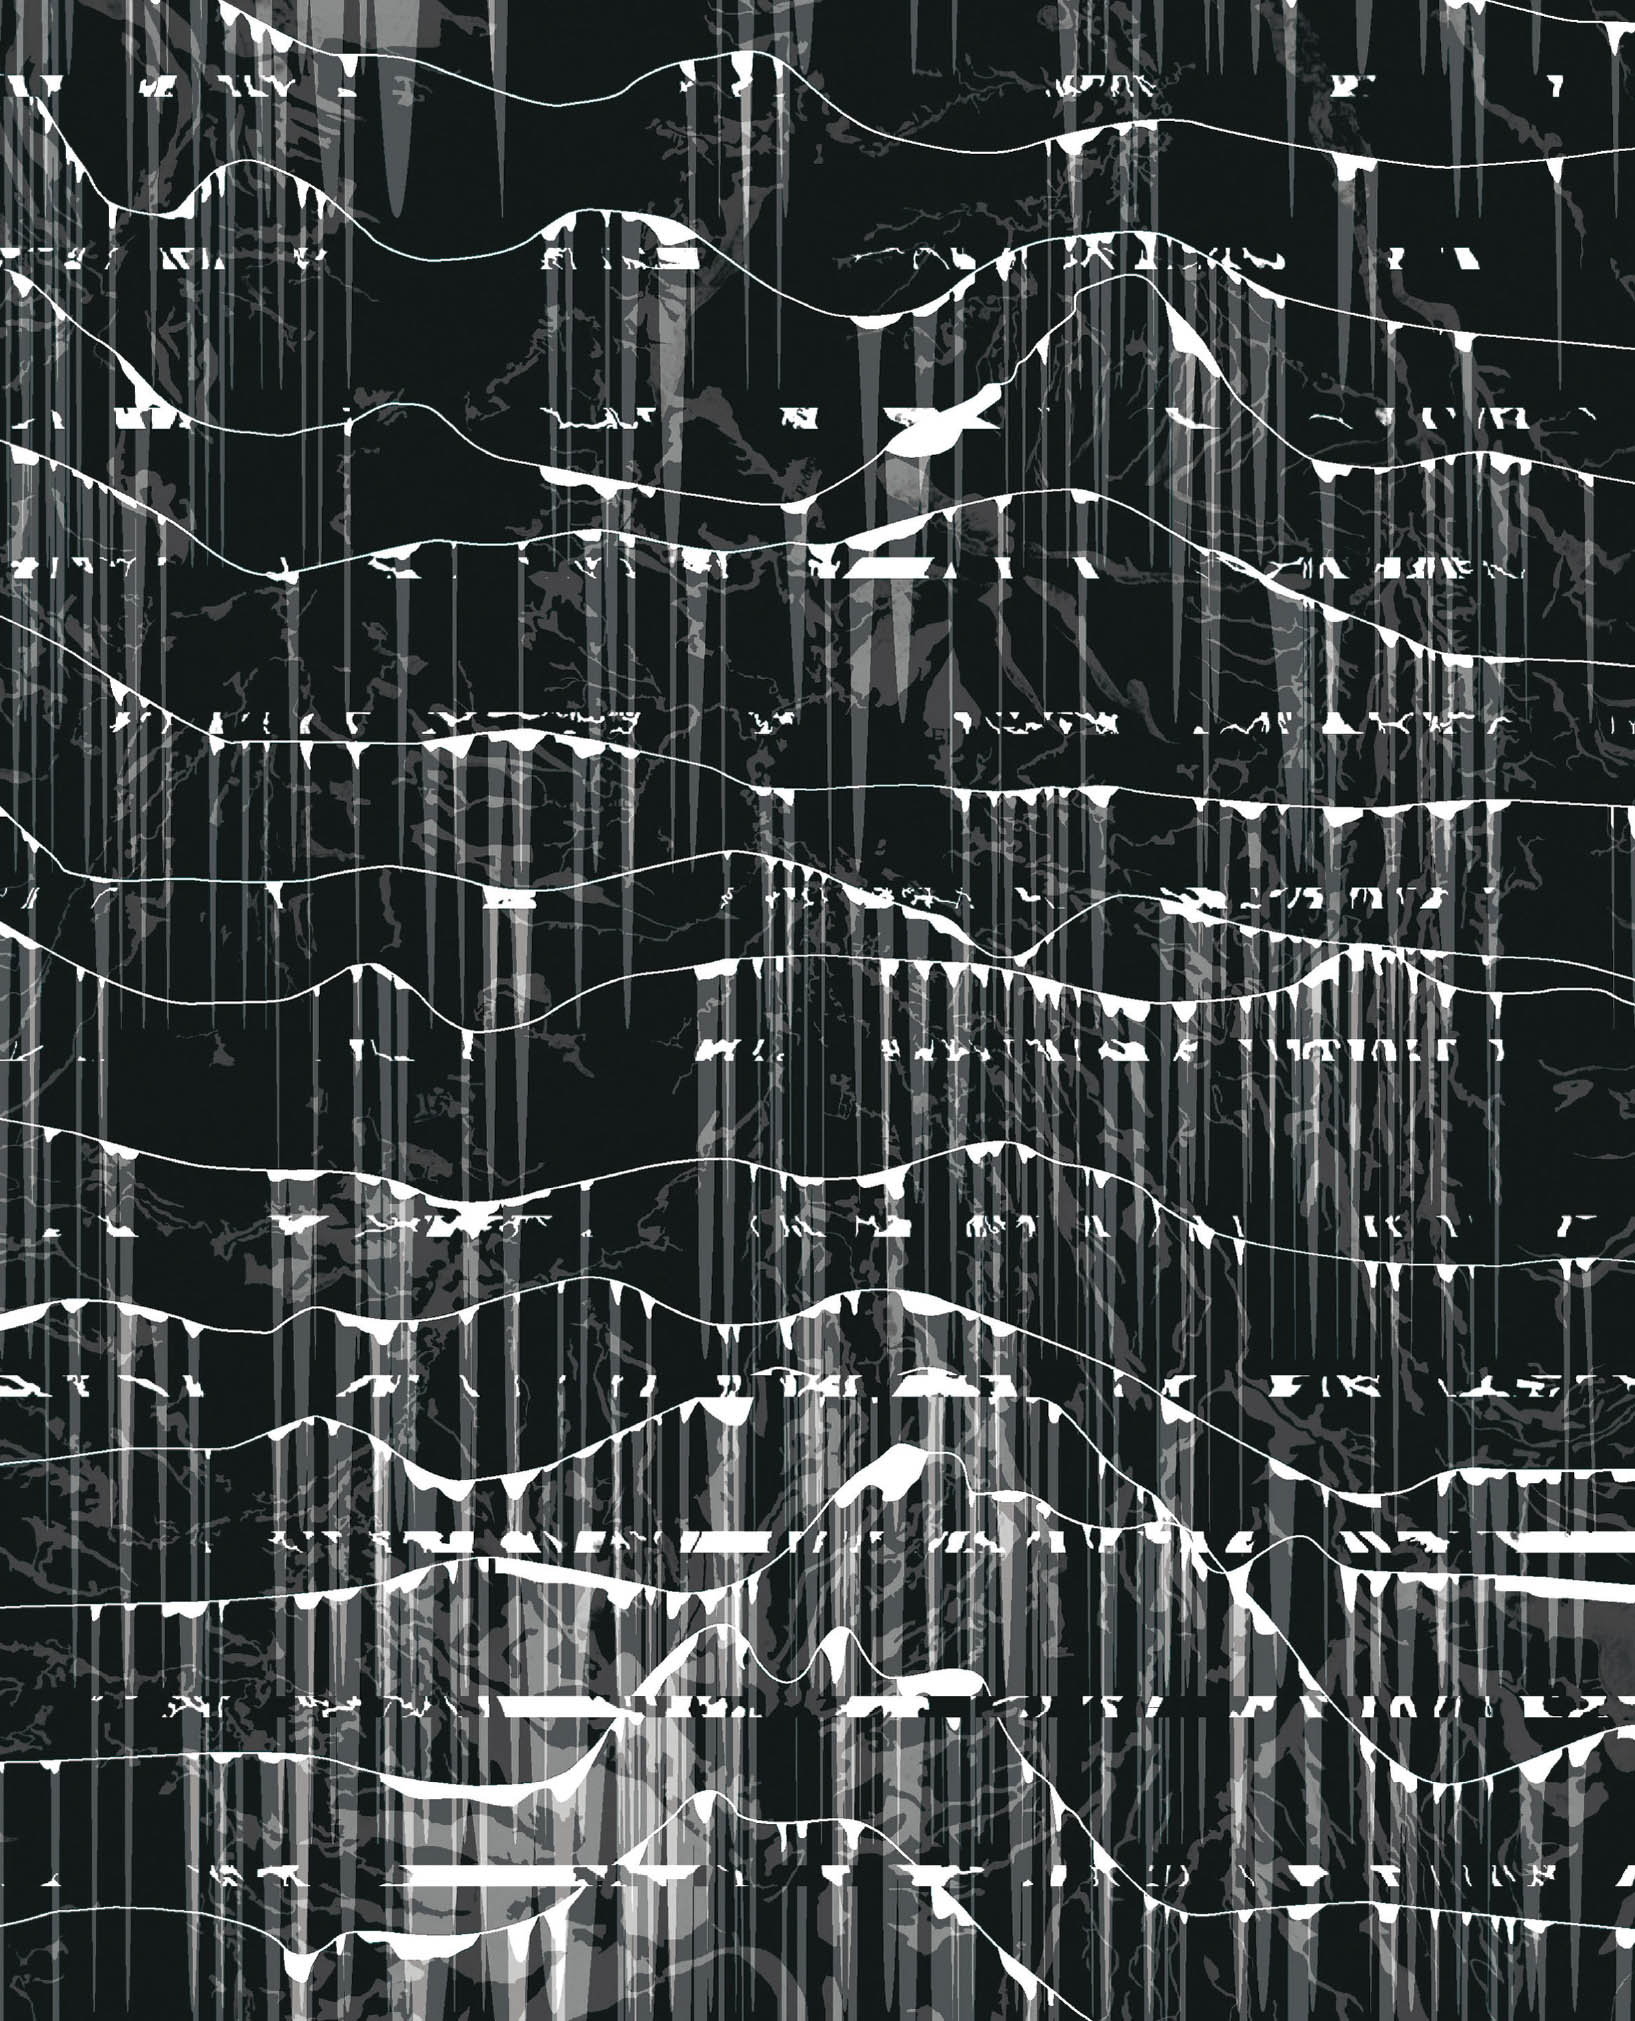
8.13
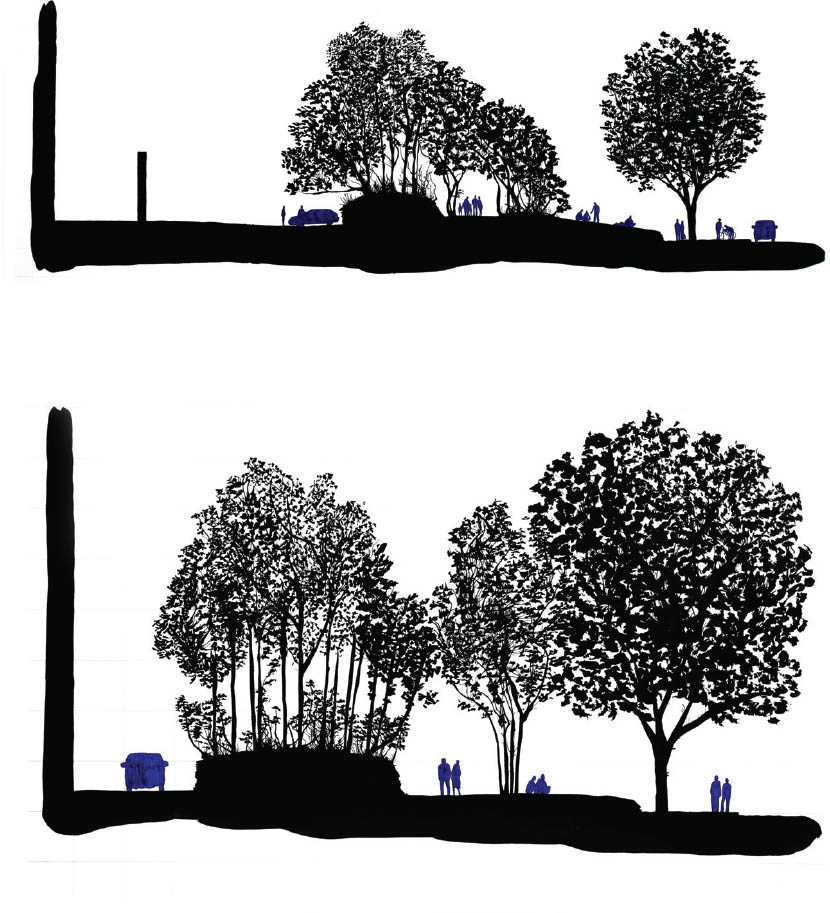
51.5082° N, 0.1001° W, Vogt Landscape Architects, Tate Modern, 2001.
The vegetation is hand-drawn with black ink, the most visceral and effective technique for the designers to quickly communicate the qualitative characteristics of foliage. The results are intricate and abstract sections that demonstrate the relative lightness and heaviness of the vegetation as well as its connection to a thickened ground.
8.14
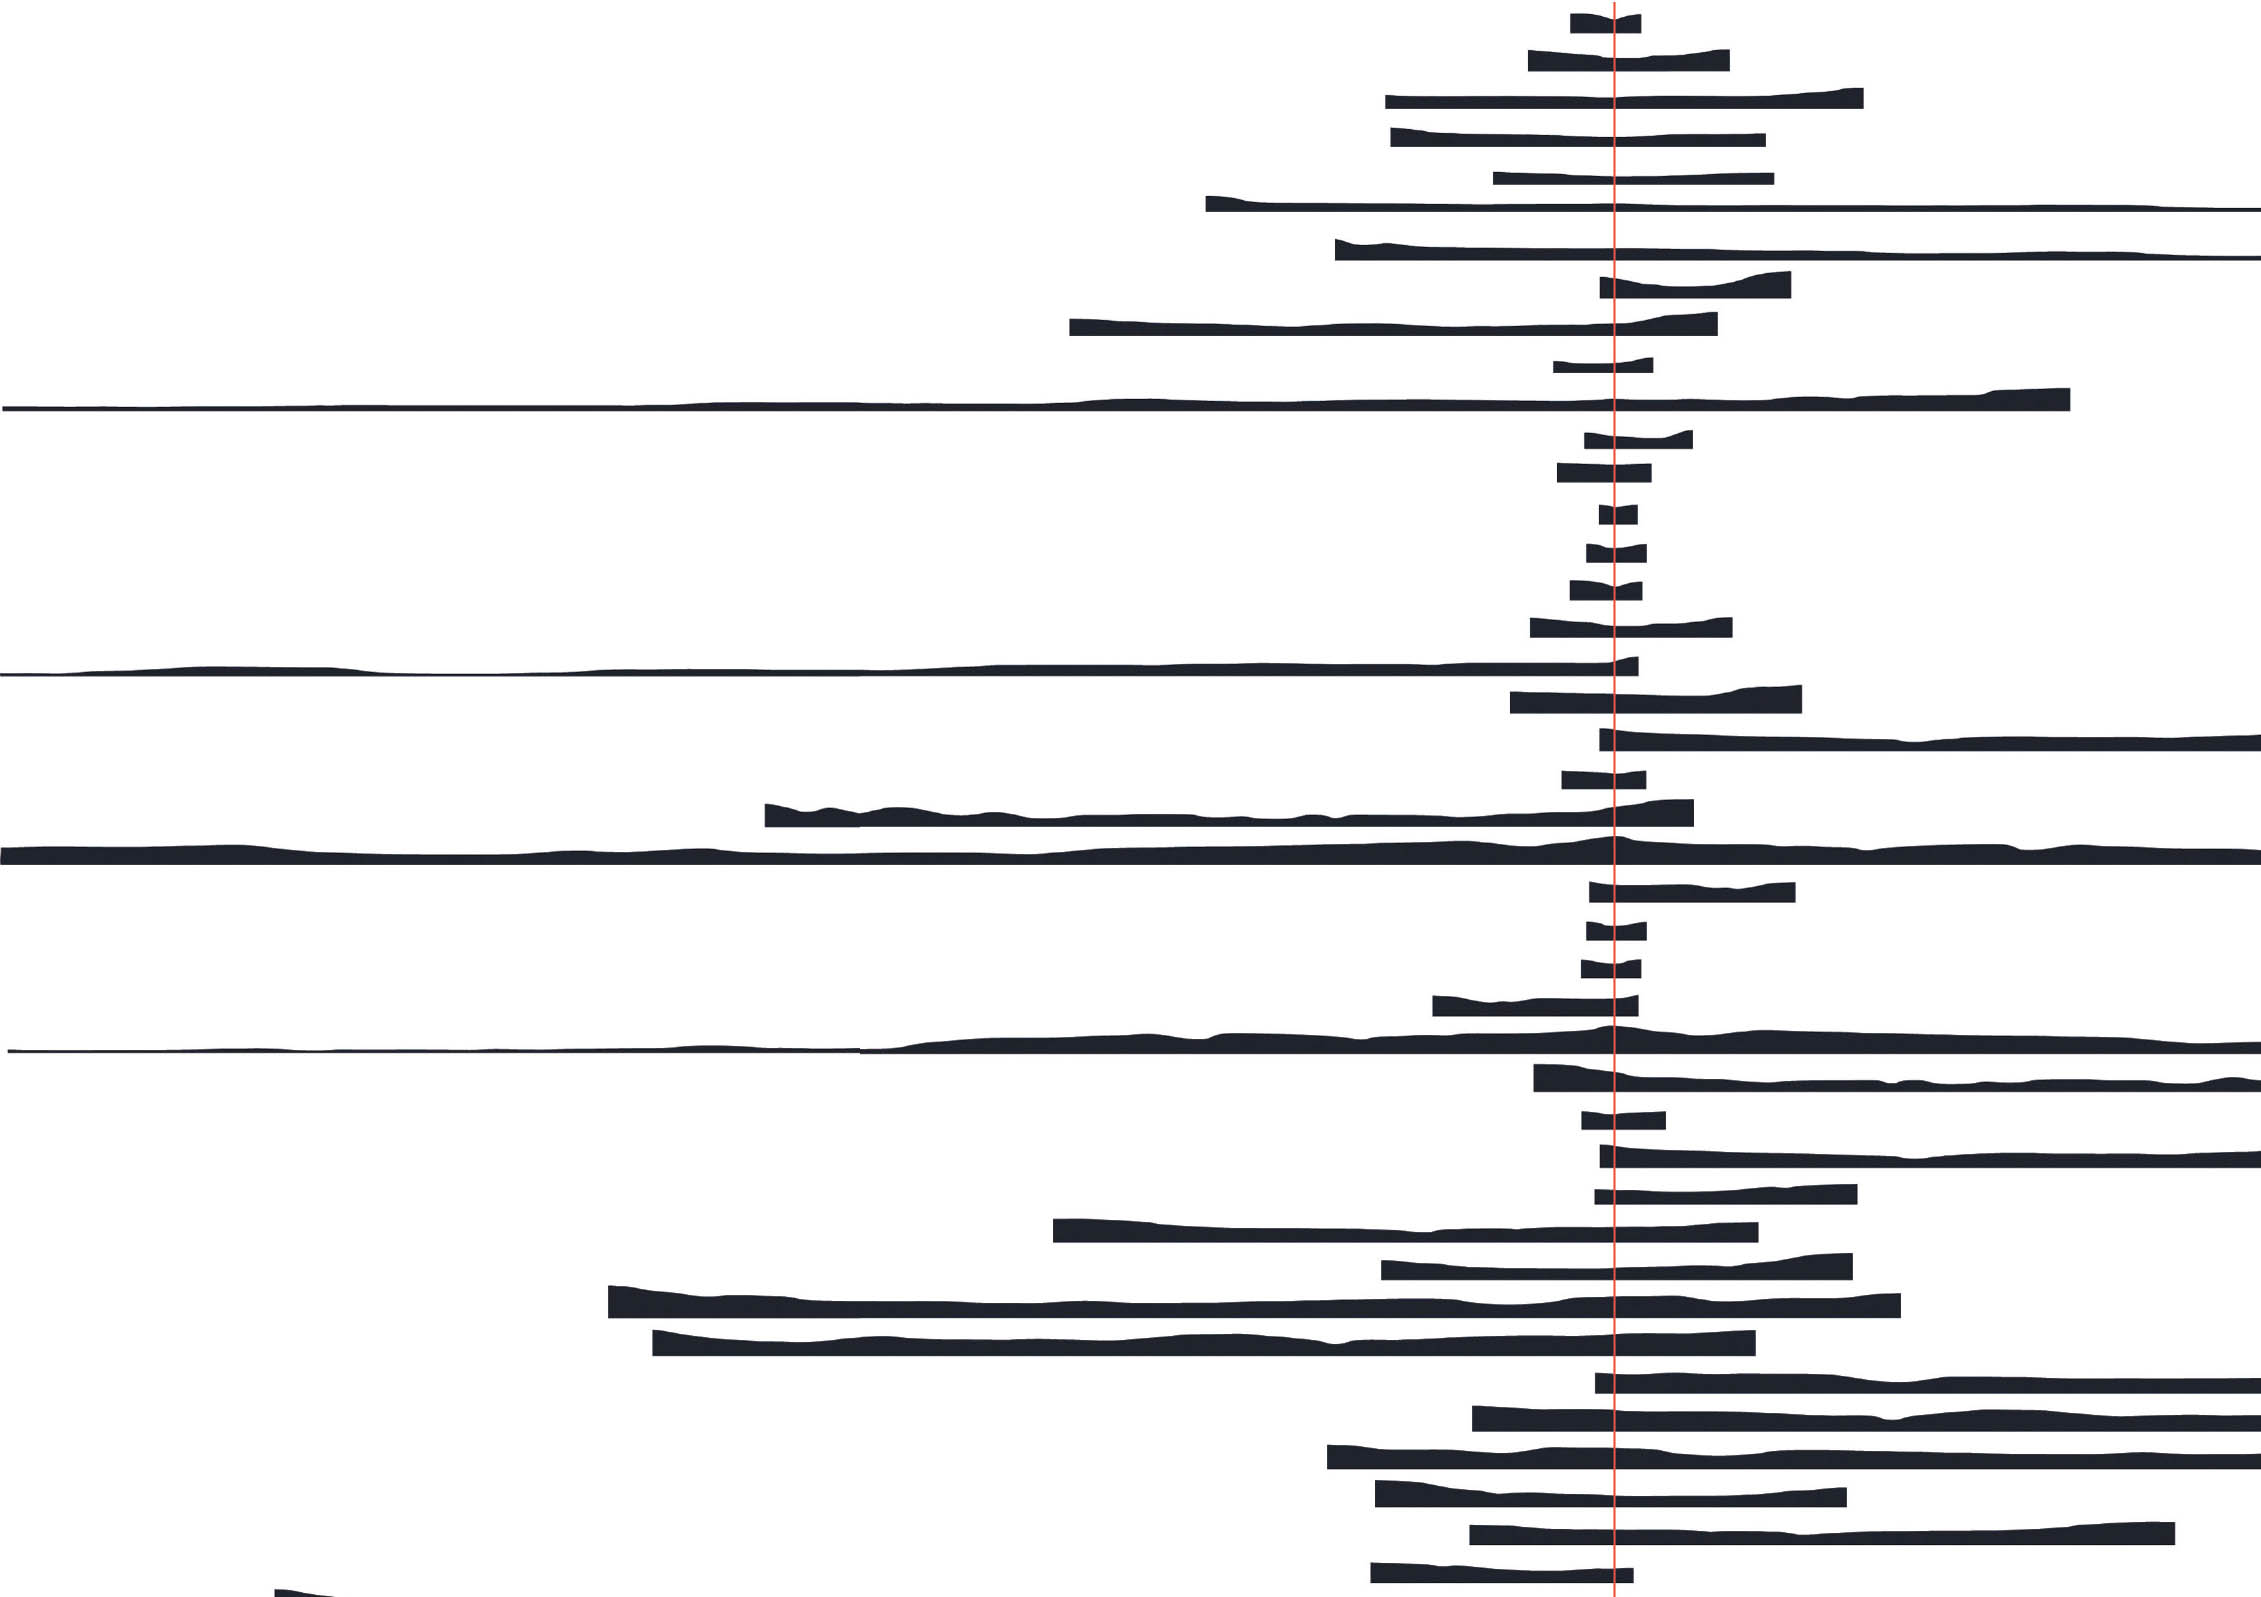
51.0915° N, 2.4908° W, Vogt Landscape Architects, Hadspen House Estate: Shape of a Walk, 2007–8. Scale: 1:25,000 (shown at half size).
The Hadspen House Estate sections focus on the walker’s perspective. The central red line represents the route, while the section length corresponds to the walker’s viewshed. The distance seen is the distance mapped. Thus, the section from the low point is short, and the section from the high point is long. The topography is reflected through the drawing as the sections wax and wane along the undulating route. Topography and experience are not disparate elements but continuously acting upon one another.