CHAPTER 11
Should Direct Loan Portfolios Be Leveraged?
Many investors in US middle market direct lending use leverage (borrow), typically at the fund level, to enhance return. Whether and how much to leverage is an important decision in constructing a direct lending portfolio. This chapter addresses how leverage impacts direct lending return and risk and provides some guidance as to how the leverage question might be answered.
Exhibit 11.1 provides underlying fee and leverage assumptions that are representative of an institutional private fund vehicle. Those assumptions are then used in conjunction with the historical Cliffwater Direct Lending Index (CDLI) returns to project return and risk outcomes at varying leverage levels.
EXHIBIT 11.1 Indicative fee and leverage specifications for a direct lending portfolio.
| Direct lending asset returns | Cliffwater Direct Lending Index (CDLI) |
| Leverage (borrowing/net assets) |
0.0 unleveraged 0.6 average leverage for BDCs 1.0 leverage 1.5 leverage 2.0 leverage |
| Cost of debt | 3.96%, equal to the average 2004–2017 historical financing cost of all BDCs in the CDLI, taken from 10‐Qs/Ks |
| Management fee | 1.00% of gross assets |
| Administrative expenses | 0.20% of gross assets |
| Carried interest/preferred return | 10%/6% |
As an illustration, the net of fee return for this direct lending portfolio example is calculated in Exhibit 11.2, assuming leverage equal to 0.61 (61%) of net assets. This is the average leverage used by BDCs on their loan portfolios over the last 13.25 years. The fees selected for our example are representative of an institutional account, but less than fees typically charged by the average publicly traded BDC.
EXHIBIT 11.2 Indicative direct lending portfolio after fees, expenses, and leverage.
| 9.70% | Asset return net of realized, unrealized losses |
| +5.92% | Gross additional return from leverage at 0.61 times NAV |
| −2.41% | Cost of leveraged financing (@3.96% of borrowings) |
| =13.20% | Gross of fee return |
| −0.32% | Administrative expenses (@0.20% of gross assets) |
| −1.61% | Management fees (@1.00% of gross assets) |
| 11.27% | Return net of management and administrative fees |
| −1.13% | Incentive fees (@10% of return net of management fee and expenses) |
| 10.14% | Net return to investors |
| 21% | Manager fees as a % of gross of fee return |
The representations in Exhibit 11.2 are intended to reflect what an investor would have received since 2004 from a direct lending portfolio with the characteristics of the CDLI and a leverage level that asset managers (lenders) used to support those loan assets. Instead of using actual historical fee levels, fees more reflective of current institutional managers were selected, acknowledging that fees have come down over time as a byproduct of greater scale in direct lending platforms and the desire to examine prospective performance rather than historical performance.
The calculation progression in Exhibit 11.2 begins with the 9.70% unleveraged, gross of fee CDLI return since September 30, 2004, through December 31, 2017. Our example assumes that direct loan assets will return a level similar to the average over the past 13.25 years. Next, an additional 5.92% is added to reflect the 61% leverage being used and equals 9.70% times 0.61. The cost of leverage financing is assumed to equal 3.96%, the actual cost of debt financing loans in the CDLI over its history. The cost of leveraged financing in the example equals 2.41%, the 3.96% cost of financing times the 0.61x amount of financing. Together, the unlevered and 0.61 levered direct loan assets produce a 13.20% return net of borrowing costs but still gross of fees.
Fees are next deducted from the 13.20% return. Administrative fees equal to 0.20% of gross assets are subtracted. These fees, as a percent of net assets, equal 0.32% (0.20% times 1.61). The term gross assets is generally used to refer to the combined value of both unlevered and levered direct loans. Since lenders and administrators must create and service all loans, fees are often charged on all assets rather than net assets. In our example both management and administrative fees are charged on gross assets. Consequently, the 1.00% management fee on gross assets is the equivalent to 1.61% (1.00% times 1.61) on net assets.
The last fee deduction in Exhibit 11.2 is the incentive fee, which is calculated after management fees and administrative expenses. The 1.13% incentive fee equals 10% multiplied by the 11.27% net return excluding the incentive fee. The example includes a 6% preferred return, but it does not affect the outcome since it is well below the 11.27% net return before application of the incentive fee. The net, after fee return for the direct lending portfolio with average performance (CDLI) and 0.6 leverage ratio equals 10.14%. In this example, total management fees paid equal 2.72% of net assets and represent 21% of the direct lending portfolio's 13.13% gross return.
SIMULATED DIRECT LOAN PORTFOLIOS WITH LEVERAGE
The calculations for leverage and fees in Exhibit 11.2 are repeated but instead of the 9.70% cumulative annualized CDLI return as a starting point, quarterly CDLI returns are used to create a simulated quarterly return series with leverage and after fees. Additionally, a quarterly return series is created for leverage levels 1.0x, 1.5x, and 2.0x. Exhibit 11.3 plots cumulative returns for the unlevered CDLI, which is gross of fees, the unlevered CDLI net of fees, and four‐levered CDLI return series, also net of fees. Annualized return and risk statistics are shown for the six return series in Exhibit 11.4.
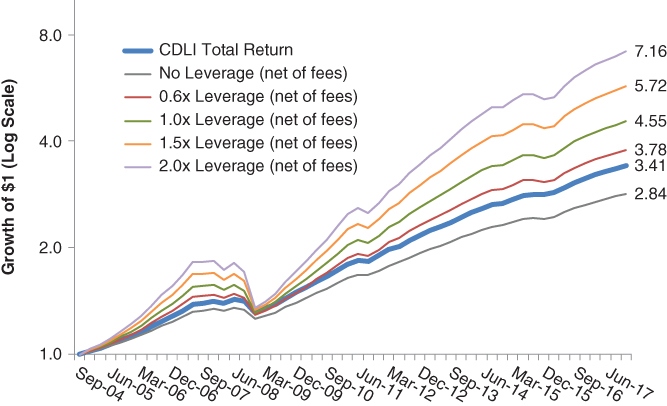
EXHIBIT 11.3 Performance simulation for direct lending portfolios with leverage: September 2004 to December 2017.
EXHIBIT 11.4 Simulated return and risk for levered direct lending portfolios: September 2004 to December 2017.
| Return | Risk (Std. Dev.) | Return/Risk | 2008 Max Drawdowna | |
| Cliffwater Direct Lending Index | 9.70% | 3.54% | 2.74 | −8% |
| CDLI, no leverage, after fees | 8.20% | 3.18% | 2.58 | −7% |
| 0.6x Leverage, after fees | 10.55%b | 5.09% | 2.07 | −13% |
| 1.0x Leverage, after fees | 12.12% | 6.37% | 1.90 | −16% |
| 1.5x Leverage, after fees | 14.07% | 7.96% | 1.77 | −21% |
| 2.0x Leverage, after fees | 16.02% | 9.55% | 1.68 | −25% |
aMax drawdown from June 30, 2008 to December 31, 2008.
bThe 10.55% return is slightly higher than the example in Exhibit 10.2 because performance fees are not paid in quarters where preferred return is not achieved.
As expected, return increases with leverage because direct lending returns, as measured by the CDLI, exceed the combined costs of financing, administrative fees, management fees, and incentive fees. Annualized returns range from 8.20% for an unlevered direct lending portfolio to 16.02% for a portfolio leveraged 2.0x. Very rarely are portfolios of direct loans leveraged more than 2.0x, unless they are within a structured vehicle like a collaterized loan obligation (CLO). When leverage is used, the most common level is 1.0x.
Noteworthy is the reduction in the return‐to‐risk ratio in Exhibit 11.4 as more leverage is used. Leverage increases risk as it increases return, but return increases at a lower marginal rate compared to risk. For example, risk roughly doubles from the 3.18% unleveraged portfolio to 6.37% for the 1.0x leveraged portfolio. Return does not double, but increases only by one half, from 8.20% to 12.12%. Leverage does not bring double the pleasure because leveraged assets have lower returns due to the cost of financing, administrative, and management fees that are typically charged at the same rate on leveraged assets as unlevered assets. Unlevered assets have a return‐to‐risk ratio equal to 2.58, but as leverage is applied the return‐to‐risk ratio declines to 1.68 for a 2.0x leveraged direct lending portfolio.
Investors might think about the optimal amount of leverage by comparing the risk and 2008 drawdown columns in Exhibit 11.4 with comparable data for private equity and real estate presented in Exhibit 3.1 in Chapter 3. Comparisons with publicly traded high‐yield bonds and leveraged loans are interesting as well, but risk statistics for those asset classes are based upon market price and not quarterly determinations of ASC 820 fair value.
Selection of a leverage level likely depends upon investor risk preference. Investors that are looking for a direct lending portfolio to have low risk and perhaps be a substitute for their traditional liquid fixed income portfolio are likely to select an unlevered direct lending portfolio. This might also be the choice of an investor that is new to direct lending and wants to build up some experience before adding the complexities of borrowing to the portfolio. For this investor, the 3.18% risk level for the unleveraged, after‐fee portfolio is very similar to fixed income risk.
Investors that are looking for a direct lending portfolio to be a component of a higher‐returning portfolio, perhaps including private equity, are more likely to apply leverage to direct loans to get expected returns at a level comparable to private equity. To achieve the 12–15% level of return often targeted for private equity would require a leverage level between 1.0x and 2.0x. A 2.0x direct lending portfolio is perhaps optimal for a direct lending portfolio seeking private equity returns. Its 9.55% risk level shown in Exhibit 11.4 is roughly equal to the 9.2% private equity risk reported in Exhibit 3.1.
Investors looking to direct lending as an asset class that sits between stocks and bonds might find a leverage level equal to 1.0x the most attractive. The 6.37% risk level in Exhibit 11.4 is like the 5.5% risk level for equity real estate in Exhibit 3.1. Real estate is often viewed as an asset that offers cash flow, moderate risk, and good returns over time. A 1.0x levered direct lending portfolio could serve a similar role.
The analysis of leverage and risk is extended to drawdown in the last column of Exhibit 11.4. Drawdown has been a very useful alternative measure of risk since the global financial crisis (GFC) due to the serial correlation of returns, discussed in Chapter 3. Drawdown sharply magnifies the risk in leverage and is likely better understood by investors. By the drawdown measure, unlevered direct lending looks like a low‐risk portfolio with a maximum drawdown equal to 7% after fees. Most institutional portfolios fell 20% during the GFC and a 7% drawdown would likely be viewed as an attractive risk mitigator by most asset allocators.
Even with one turn of leverage (1.0x) the drawdown equals an acceptable, though undesirable, 16%. A 16% drawdown would have been less than the 20% level for the average institutional portfolio and below the 24% drawdown equity real estate suffered during the GFC. The simulated 12.12% return for a 1.0x leveraged direct lending portfolio would seem to be more than sufficient compensation for the extra risk‐taking from leverage.
A leverage level between 0.5x and 1.5x is what most institutional investors are engineering for their direct lending portfolios. This suggests that direct lending is being viewed more as an asset class that institutional investors want to sit between stocks and bonds, providing high levels of cash flow (yield) at moderate risk.
DETERMINANTS OF FINANCING COSTS
The leverage analysis presented in Exhibits 11.3 and 11.4 is based upon a direct lending portfolio whose composition reflects the average characteristics of the direct lending market, captured by the CDLI, and a constant average cost of financing equal to 3.96% that reflects the historical average cost. A more refined analysis would tailor both the direct lending portfolio and the financing to specific circumstances. For example, Chapter 9 identified direct loan risk factors and premiums that might also influence the cost of financing. It would also seem reasonable to assume that the same or other risk factors might impact the cost of financing leverage.
Exhibit 11.5 presents results from an analysis to identify what factors might explain differences in portfolio financing costs in the presence of leverage. A cross‐sectional multiple regression was performed on 55 separate business development companies (BDCs) with data from the fourth quarter of 2017. The dependent variable was the cost of debt (Y) for the fourth quarter. Three independent variables were identified as potentially impacting financing costs: the amount of loan assets that are subordinated or second lien (X1), the size of the direct loan portfolio (X2), and the amount of leverage (X3). Financing costs would be expected to be higher for riskier subordinated debt. The size of the portfolio might lower financing costs if scale could extract better financing terms. And, finally, financing costs would be expected to rise as more leverage is used.
EXHIBIT 11.5 Factors explaining the cost of financing leverage.
| Regression Results | ||
| Dependent variable | ||
| Y = Cost of debt (annualized) | ||
| Independent variable | Coefficient | t‐Stat |
| X0 = Intercept | 3.61% | 8.56 |
| X1 = % Subordinated | 1.88% | 3.37 |
| X2 = Asset size | 0.00% | 0.22 |
| X3 = % Levered | 0.25% | 0.49 |
The intercept term in Exhibit 11.5 equals 3.61%. This is the cost of the first dollar of financing of a 100% senior direct loan portfolio. Expressed differently, first dollar financing for senior direct loans equaled Libor plus 2.10% during the fourth quarter of 2017 as three‐month Libor averaged 1.51%.
Only the percent of loan assets that were subordinated (X1) proved statistically significant with a t‐statistic equal to 3.37. Its 1.88% coefficient means that leveraging a subordinated portfolio 1.0x would raise the cost of financing by 1.88%. Exhibit 9.1 earlier showed that the yield premium for subordinated direct loans was 3.3% at December 31, 2017, suggesting that leveraging subordinated direct loans would provide a yield spread after financing costs of 1.4% (3.3% minus 1.9%), and before deducting for potential credit losses and management fees on levered assets. It is no wonder why portfolios of subordinated direct loans are seldom leveraged to a significant degree. Asset size (X2) was found to have no impact on financing costs with a 0.00% coefficient. Size does not appear to have an impact on financing costs, which is somewhat unexpected. Finally, leverage itself is found to raise financing costs. While the first dollar of senior loan financing equals 3.61%, that cost increases to 3.86% for a portfolio with 1.0x leverage. However, the leverage regression equals 0.49 and is not statistically significant. The weakness of leverage as an explanatory variable may be attributable to BDCs as a source of financing data because leverage by regulation at the time is limited to less than 1.0x. It may be that a sample set that included more highly levered direct loan portfolios might shed greater light on leverage and financing costs.
Looking just at the one statistically significant independent variable, Exhibit 11.6 plots the cost of financing on the vertical axis with loan subordination, measured as the percent of assets in subordinated loans, on the horizontal axis.
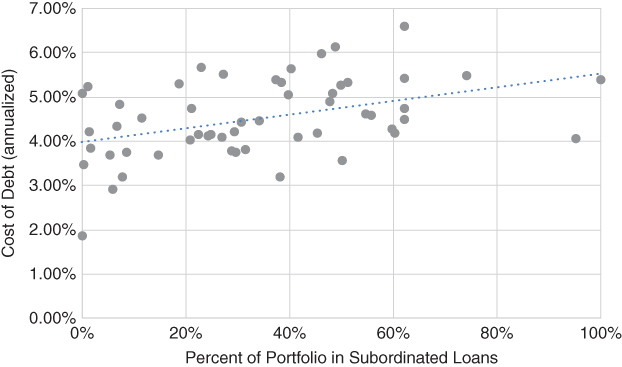
EXHIBIT 11.6 Loan subordination and financing cost.
The line in Exhibit 11.6 represents the best fit regression line and represents what financing costs to expect given the percent of subordinated loans in the portfolio. The significant deviations of actual financing costs from predicted suggests that either other systemic factors are involved that were not captured or, more likely, the discrepancies are attributable to negotiating and structuring skills of CFOs at direct loan managers that put financing in place. Traditional investor due diligence focuses mostly on the operational and risk management capabilities of the CFO, but with direct lending the position can also meaningfully enhance value (alpha) through negotiating lower financing costs with asset flexibility.
Fiduciaries approach leverage very cautiously, particularly when they have discretion over its use. This chapter showed that the low volatility found in direct loans makes leverage a likely acceptable addition to a portfolio. However, understanding the complexities of financing and its costs becomes ever more important as more leverage is used and should become an integral part of investor due diligence.