CHAPTER 15
Investment Fees
This chapter examines fees for direct lending investment management services, both their level and structure. It draws upon fee, expense, and portfolio information on 33 direct lending managers who together manage $129 billion in direct lending assets and offer limited partnership interests in private partnerships upon which the fee information is based. Portfolio information includes use of portfolio leverage, loan seniority, borrower size, and allocations to nonsponsor borrowers, all characteristics found to explain differences in loan yields and which may explain fee differences as well. All fee and portfolio data are as of September 30, 2017. The intent is to understand whether the direct lending fees found today are at levels that make sense given the expected value proposition for direct lending as an investment, and how direct lending fees compare to private equity.
Direct lending fees vary across the types of vehicles and investors. The analysis in this chapter is mostly based upon direct lending fees charged in private partnerships, whose investors are largely institutional investors and larger high‐net‐worth investors. Other investor groups will pay higher and lower fees than those for private partnerships. Very large investors, those who can allocate over $100 million to a single manager, create separately manage accounts (SMAs) with direct lenders and are able to negotiate lower fees because of the scale of the portfolios. On the other hand, small investors that access direct lending through public BDCs generally pay higher fees due to their regulatory requirements. This chapter focuses on fees charged on private partnerships, which represent the largest group of investor capital.
DIRECT LENDING FEE STRUCTURES
Fee structures for direct lending managers differ in four significant ways from private equity fee structures.
- Direct lending fees are most often charged on invested, not committed assets. Private equity managers almost universally charge fees on committed assets during a fund's investment period. This difference is likely explained by legacy practices, more robust deal flow, shorter investment periods, and a shorter deal life compared to private equity. Fees on invested assets reduce both overall fees and mitigate or eliminate the J‐curve phenomena found in private equity. For purposes of this analysis, direct lending managers who charge on committed assets are excluded, of which there are five. The remaining 33 of the direct lending managers charge fees on invested assets. The few managers who do charge on committed assets generally take greater risks, particularly in subordinated and mezzanine debt.
- About half of the direct lending managers charge fees on gross assets, including leveraged assets, rather than net assets (investor capital), whereas private equity managers will charge fees on invested capital (contributions minus distributions) after a fund's investment period. Fees charged on gross assets is unusual outside direct lending, other forms of structured finance, such as collaterized loan obligations (CLOs), and some real estate private funds. The argument for charging fees on leveraged assets is that the amount of resources and efforts required of a manager to deploy assets is the same regardless of whether those assets are invested or leveraged, and in fact, additional resources may be required to maintain leverage. In the data sample, 15 of the 33 direct lending managers charge management fees on gross assets, including the five largest managers who combined represent almost one‐half of total direct lending assets.
- With few exceptions, direct lending managers, 31 out of 33, charge an incentive fee. For managers charging incentive fees, the average incentive fee equals 14.2% of profits, well below the ubiquitous 20% incentive fee found in private equity, with 10% and 15% incentive fees being the most commonly found. As might be expected, managers who charge asset fees on gross assets have lower incentive fees than those charging asset fees on net assets, at 13.7% versus 14.6%, respectively, but the difference is not great.
- The average preferred return equals 6.8% and is identical for managers charging asset fees on gross and net assets. This is lower than the typical preferred return of 8% for private equity, reflecting lower return expectations for direct lending.
Combined Fees for Direct Lenders
Fee comparisons across managers can be difficult with the variety in fee structures and use of leverage. The approach used below calculates a single fee measure called expected combined fee or combined fee for each direct lending manager regardless of fee structure. The combined fee represents the sum of asset fees and incentive fees, as a percent of investor assets (net asset value), assuming the underlying loan portfolios are all earning a market yield equal to 9.57%; market borrowing rates equal to 4.00%; and historical CDLI realized credit losses equal to 1.04% per year. All data is as of September 30, 2017. Each manager's combined fee is calculated by applying their asset and incentive fees to assets yielding 8.53% (9.57% gross unlevered yield minus 1.04% historical credit losses) and the manager's targeted leverage. (The same analysis was conducted using actual or target yields for each manager without material differences in the regression results presented in Exhibit 15.2.)
The average combined fee was 2.97% of net assets for direct lending managers offering private partnership funds. That average fee should be evaluated against an average gross of fee expected return equal to 12.23%, which is based upon the 9.57% unleveraged yield assumption, the 1.04% credit loss assumption, the average 0.82x leverage used in the private funds sample, and a 4.00% cost of financing available at the study date. The 2.97% average combined fee equals 25% of the 12.23% average gross‐of‐fee return. The 75% gross‐of‐fee return going to the investor produces an average 9.26% expected return.
The 75% investor – 25% manager split of the direct lending gross return is an important number for institutional investors allocating to private assets. Private asset opportunities where investors expect to receive more than 80% of gross returns are viewed as very attractive, though rare, while opportunities where investors expect to receive less than 60% of gross returns are viewed as unattractive.
Manager Style and Fees
The distribution of combined fees as a percent of net assets vary widely around the 2.97% average for individual direct loan managers, as shown in Exhibit 15.1. The lowest fee equals 1.73% and the highest fee equals 4.33%. The 25th to 75th percentile range in composite fees is a much narrower 0.75%, from 2.64% to 3.39%.
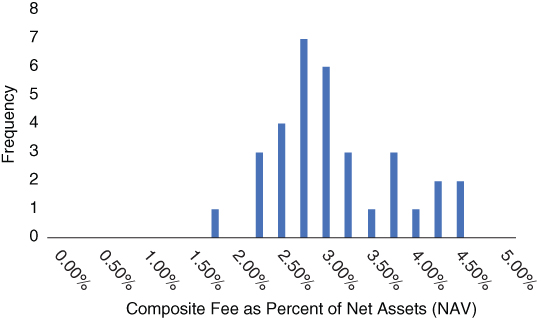
EXHIBIT 15.1 Distribution of combined direct lending fees as a percentage of net assets.
A statistical test is performed to identify the extent to which individual manager fee differences are explained by four primary portfolio risk factors: borrower size, borrower type (sponsor versus non‐sponsor), credit seniority, and leverage. A reasonable expectation is that direct lending portfolios constructed with smaller borrowers, non‐sponsor borrowers, and junior securities might demand higher fees than the average due to higher costs of information and deal complexity. Multiple regression is used to test this hypothesis, where the manager's combined fee is the dependent variable, and manager values for average EBITDA borrower size, percentage of sponsored borrowers, and percentage of senior securities (first lien) are independent variables. While not a portfolio risk factor, leverage will positively impact composite fee as we have defined it and therefore is added as an independent variable as well.
Exhibit 15.2 provides the multiple regression results.
EXHIBIT 15.2 Factors explaining direct lending fee differences.
| Regression Results | |||
| Independent Variable | Coefficient | t‐Stat | |
| X0 Intercept | 3.45% | 5.23 | |
| X1 EBITDA (mil) | −0.00% | −0.43 | |
| X2 Percent Sponsored | −0.31% | −0.51 | |
| X3 Percent First Lien | −0.95% | −1.31 | |
| X4 Leverage | 0.53% | 1.80 | |
All coefficients are directionally as expected, with negative values for EBITDA, sponsored borrowers, and first lien, and a positive value for leverage. The EBITDA factor (x1) has no measured relationship to fees and its coefficient is statistically insignificant. This is somewhat surprising because there exists significant yield spreads for loans to smaller‐sized borrowers as reported in Chapter 9.
As expected, the combined fees are lower for managers with higher allocations to sponsored borrowers (x2) and higher allocations to first‐lien loans (x3), though the result for sponsored borrowers is statistically insignificant (t‐stat = −0.51) and the result for first‐lien assets is significant only at the 90% confidence level (t‐stat = −1.31). Finally, leverage increases combined fees by 0.53% for each turn of leverage, a finding that is statistically significant at the 95% level (t‐stat = 1.80).
The regression R‐squared equals just 0.13, meaning that 87% of the variation in fees is not explained by the four independent variables. We interpret the low regression R‐squared as suggesting that manager fee differences could be related to many other factors, including legacy fee schedules, past performance, and unique competitive advantages.
COMPARISONS TO PRIVATE EQUITY
The natural analog to direct lending fees would be private equity fees. The challenge in such a fee comparison is that private equity fees are considerably more complex compared to direct lending fees.
The following table provides a list of private equity partnership fee‐related inputs and assumed values based on likely terms found in institutional quality buyout partnerships.
| Partnership Term | Assumed Value | Description |
| Investment period (years) | 5 | Time over which investments are made |
| Fund life (years) | 10 | Life of the fund |
| Maximum percent funded | 90% | Amount of committed capital drawn |
| Average holding period | 5 | Length of time portfolio company is held |
| Carry percentage | 20% | Percent of profits owed to GP |
| LP preferred return | 8% | Minimum return before GP earns carry |
| GP catchup | 80% | Percent of profits paid to GP after preferred return achieved |
| Management fee (investment period) | 1.5% | Fee paid on committed capital |
| Management fee (post‐investment period) | 1.0% | Fee paid on invested capital |
| Transaction fees as % of TEV | 0.50% | Paid by portfolio companies to GP on total enterprise value |
| Monitoring fees as % of invested capital | 0.25% | Paid by portfolio companies to GP for management services |
| Fee offset percentage | 80% | Percent of transaction/monitoring fees reducing management fees |
| Average percent leverage | 60% | Percent of portfolio company debt used to determine TEV |
Because private equity fees and invested assets vary significantly over the life of the investment partnership, the approach to measuring fees as a percentage of invested assets is to sum the discounted value of all fees paid by the partnership over its life and divide by the sum of the discounted value of all invested partnership assets. Fees and invested assets are estimated quarterly over the 10‐year assumed partnership life and then discounted back to the initial investment date at an 8% rate, the assumed preferred return.1
Fee assumptions are used to calculate a range of fee outcomes based on an expected 15% gross‐of‐fee private equity return and 25% risk (standard deviation). Weighting return and fees by their probability of occurrence gives an expected fee equal to 3.73% for private equity, the equivalent of 25% of the expected 15% gross‐of‐fee private equity return.
Comparing these findings to direct lending shows that although direct lending fees are lower at 2.97% of invested assets, compared to 3.73% for private equity, both direct lending and private equity fees represent the same percentage (25%) of expected gross‐of‐fee return. This comparison also suggests that direct lending and private equity have the same fees in the context of investment return generated.
COMPARISONS TO BDCs
Management fees charged on BDC assets are known to be significantly higher than fees for the same services charged to private funds, as illustrated in Exhibit 15.3. Exhibit 15.3 adds to the private fund fee histogram in Exhibit 15.1, investment fees as a percent of net assets for the universe of BDCs, both private and publicly traded. BDC management fees are an average of the trailing three years ending December 31, 2017 while private fund fees come from stated fee schedules as described above.
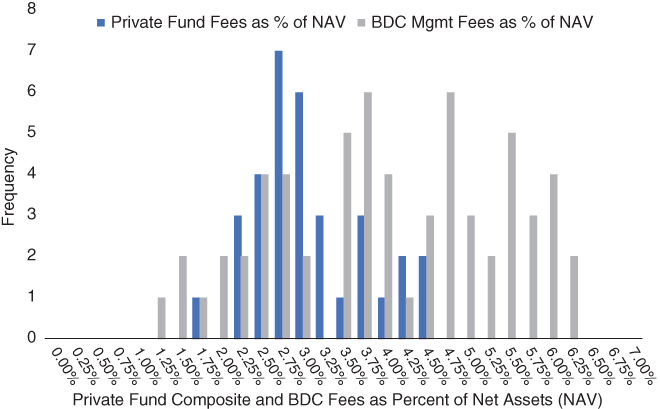
EXHIBIT 15.3 Distribution of combined direct lending fees as a percentage of net assets.
As the histogram visually shows, BDC fees have a much greater range of value compared to private funds. The average BDC management fee as a percent of net assets equals 3.91%, almost a full percentage point above the 2.97% composite fee calculated for private funds. It is difficult to rationalize the difference in fees across these two vehicles, particularly since some of the same managers offer private funds and BDCs at the same time.
FEES AND ALPHA
Besides fee comparisons to other asset classes like private equity, another institutional approach to evaluating direct lending fees is to measure those fees not against gross return, but against only that fractional return contributed by the direct lending manager and not the market. An argument could be made that the value created is the total return on the loans the manager creates and holds. However, the interest income negotiated by the manager with the borrower is partly compensation for the time value of money and partly compensation for credit risk. Compensation for the time value of money equals the three‐month Treasury or Libor rate. Compensation for credit risk can be proxied by credit spreads on loans for a broadly diversified group of borrowers with similar credit quality, such as the S&P/LSTA Leveraged Loan Index or the Credit Suisse Leveraged Loan Index. Both these indices are comprised of non‐investment‐grade borrowers with similar ratings as the loans underlying the Cliffwater Direct Lending Index. Returns on these two indices also include the same three‐month time value of money component as direct loans. Consequently, the yields and total returns for the S&P/LSTA or Credit Suisse Leveraged Loan indices should reflect the market's (not the manager's) contribution to direct loan yields and total return.
From Exhibit 4.4, CDLI yield‐to‐three‐year‐takeout, exceeds the yield to maturity on the S&P/LSTA Leveraged Loan 100 Index by an average of 5.92% over the past five years, which also represents the gross‐of‐fee value produced by the average direct lending manager over a risk‐equivalent benchmark. If 5.92% equals the gross return, or alpha, contributed by the direct lending manager, then the 2.97% private fee average should be judged against that backdrop. Before doing so, the 2.97% average fee should be adjusted downward for the 0.50% average fee for managing a leveraged loan portfolio and adjusted downward another 0.43% to arrive at an unlevered fee. The 0.43% adjustment equals a product of the 0.82x average leverage in the private fund sample and the 0.53% fee coefficient on leverage, found in Exhibit 15.2. With these adjustments, the calculation for direct lending fees as a percent of manager alpha equals 2.04% (2.97% minus 0.50% minus 0.43%) divided by 5.92%, or 34%. A 34% split of gross alpha for the direct lender is attractive by institutional standards. Ideally that manager split would be 30% or below which some managers do achieve, but as an average, private funds fee schedules would appear friendly to investors.