CHAPTER 17
Portfolio Construction
Portfolio construction is often not well understood by investors. It refers to the construction of a single portfolio or group of portfolios to maximize long‐term risk‐adjusted return. Risk can be an absolute value, measured by standard deviation of return, or the risk of varying from a benchmark return, measured by the standard deviation of differences between portfolio and benchmark returns, the latter definition also referred to as benchmark risk or tracking error.
DIRECT LENDING BENCHMARKS
Almost without exception, institutional investors will select a benchmark against which to evaluate performance as a first step in portfolio construction. As fiduciaries, they require a means to measure the performance of managers to whom investment discretion is being given and fees paid. With private asset portfolios there are generally three possibilities, none of which is ideal.
The first option is to find the publicly traded index that is most representative of the private asset portfolio in question. For private real estate this is a real estate investment trust (REIT) index. For private equity it's the Russell 3000 Index or similar index. The closest public equivalent index for corporate direct lending is either the S&P/LSTA Leveraged Loan Index or Credit Suisse Leveraged Loan Index. Private assets can generally outperform these public equivalent indices over longer periods of time, but over the short term there can be wide discrepancies between the private asset class and the public index. It becomes difficult to tell whether wide differences are attributable to the manager(s) selected or the failure of the public benchmark to adequately capture private asset characteristics that cause performance to diverge from the public benchmark.
The second option is to use performance data from vendors that produce return universes of similar funds and composites from data collected on individual funds. Useful and comprehensive fund universe data is available for most private equity and real estate portfolios, but not yet for private debt. The problem with universes of comparable funds is that the data collection process can be subject to selection biases that may overstate actual achievable returns. As well, composite returns based on the databases may not reflect the specific investment strategy being followed by the investor. Finally, these universe databases often lack information on underlying company holdings that would help define an appropriate benchmark for portfolio construction purposes.
The third option is an index constructed of actual private securities. A good example is the NCREIF Property Index1 (NPI), which consists of thousands of commercial real estate properties across the US and whose data is collected quarterly and consolidated into industry‐wide information and index returns. Unfortunately, there is no equivalent database and index available for private equity. The Cliffwater Direct Lending Index (CDLI) is constructed in the same way as the NPI except that the source of its data are public filings while NPI data is submitted to NCREIF by fund managers. The NPI and CDLI are good performance comparisons with actual portfolios, except that both the NPI and CDLI are before all fees and expenses and private asset managers almost always report performance net of fees and expenses, making performance comparisons only accurate if adjustments for fees are made.
THE IMPORTANCE OF A BENCHMARK
Real estate and private equity investors vary widely in their selection of benchmarks. This has probably contributed to the wide range in performance outcomes found among investors in these two private asset classes. Exhibit 17.1 provides the distribution of 10‐year asset class returns for 64 state pensions with fiscal years ended June 30, 2016. Six major asset classes are represented together with total fund returns. Not all 64 state pensions that reported 10‐year total fund returns ended June 30, 2016 also reported all asset class returns. The number of state funds represented in each asset class distribution is located below the asset class labels along the horizontal axis.
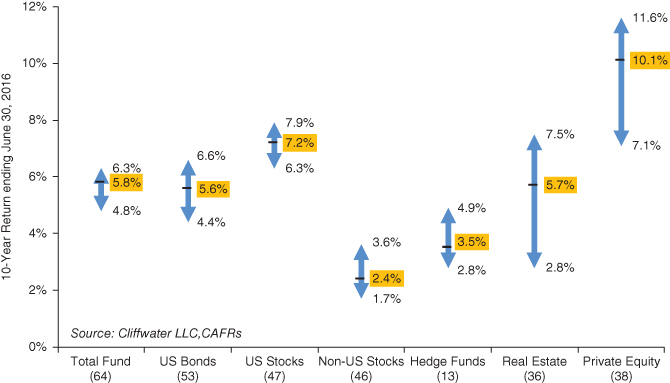
EXHIBIT 17.1 10th to 90th percentile distribution of state fund returns, 10 years ending June 30, 2016.
The arrows in Exhibit 17.1 display the range of individual state pension returns from low (the 90th percentile return) to high (the 10th percentile return) along with their values. Median returns are shown in gold on the right with a dash mark depicting where in the arrow the value falls.
The return distribution for US stocks at 1.6% (7.9% − 6.3%) is the narrowest, reflecting the wide use of indexing by state pensions and the low tracking error brought about by using multiple managers which individually are also well diversified. Return distributions for US bonds, non‐US stocks, and hedge funds are somewhat wider and about the same at 2.2%, 1.9%, and 2.1%, respectively. Each of these asset classes has a unique risk factor that impacts both portfolio construction and performance divergence. Different sub‐allocations to high‐yield bonds within fixed income cause wider US bond return outcomes; different sub‐allocations to emerging markets cause wider non‐US equity return outcomes; and different suballocations to equity‐oriented hedge funds cause wider hedge fund return outcomes. Nonetheless, the comparatively tight dispersion in returns across these four asset classes reflects a portfolio construction process among institutional investors that is for the most part very tightly controlled and driven by the portfolio construction of the targeted benchmark index.
On the other hand, the 10‐year returns for real estate and private equity are widely distributed at 4.7% and 4.5% respectively. The wide dispersion is caused by the lack of a common, investable benchmark that can guide portfolio construction across multiple institutional investors. Instead benchmarks vary, and those that rely upon publicly traded benchmarks find they are not useful guideposts for private asset portfolio construction.
Exhibit 17.1 demonstrates that fund sponsors need to recognize that portfolio construction within private asset classes is as important as the amounts allocated to these asset classes. Note that the 4.7% and 4.5% return distributions for real estate and private equity, respectively, exceed their 0.1% and 4.3% absolute return differences with the state pension average return. In short, portfolio construction may be more important than asset allocation when it comes to private assets.
THE CDLI AS A PRIVATE DEBT BENCHMARK
The challenges to finding a single benchmark that serves objectives of performance measurement comparison and portfolio construction may be too great for both private debt generally and corporate direct lending specifically. The CDLI has the best chance, given its similarity in construction to the NPI and the general, though not unanimous, acceptance of that index as a benchmark for equity real estate allocations.
There are six characteristics of good benchmarks:2
- Unambiguous
- Investable
- Measurable
- Appropriate
- Reflective of current investment opinions
- Specified in advance
Unambiguous means that the securities and asset values in the index are known. The loan securities in the CDLI and their fair values are published in 10‐Q/K Securities and Exchange Commission (SEC) filings quarterly, thereby meeting this criterion. Other useful information included in the quarterly 10‐Q/Ks includes specific borrower, industry classification, yields, and seniority.
Investable means that the securities are available to be held as a passive investment if the investor wants to forego active management. This criterion is not suited for private assets since it is the active manager who creates the security or loan in this case. However, the CDLI is comprised of direct loans within business development companies (BDCs), most of which are publicly traded, and index funds of BDCs exist for investors that choose that option. Conceptually, the CDLI is available as a passive investment option through a BDC index fund but a publicly traded BDC index fund displays much more price volatility.
Measurable means that a return on the benchmark can be calculated on a regular basis and within a reasonable time. The CDLI is published within three months after quarter‐end. While not as timely as public indices that are updated at end of day, the timing of the CDLI is similar to the NPI, and a full quarter ahead of the publication of most private fund universe data.
Appropriate means that the index reflects the activity or investment style of the manager. The CDLI fits this criterion by the simple fact that it is comprised of the loans managers underwrite.
Reflective means that the manager is knowledgeable of the securities in the index. Unlike public securities where the assumption of perfect information creates market efficiency, the private markets are characterized by information asymmetry, where managers possess proprietary information on the securities they underwrite. However, the disclosure of the names of borrowers in the CDLI allows all managers the opportunity to acquire information about the borrower and participate in refinancing. Therefore, the CDLI meets the reflective requirement of a good benchmark to the closest extent available to a private benchmark.
Specified in advance means that the benchmark is known to the manager in advance of the evaluation period. The CDLI meets this criterion with the only qualification being the three‐month lag in reporting quarterly returns, but with the understanding that private asset reporting can't be continuous as with publicly traded securities.
With the understanding that private asset benchmarks by their very nature can't perfectly fit the criteria laid out for the ideal benchmark, the CDLI meets five of the six criteria and falls short to a degree on investability because of its gross‐of‐fee calculation. The CDLI could be adjusted for fees, however, by deducting an appropriate fee rate. By contrast, an equivalent public benchmark such as the S&P/LSTA Leveraged Loan Index falls short on the appropriate criterion, meaning that the broadly syndicated loans within the S&P/LSTA Leveraged Loan Index are not middle market loans that are appropriate securities for the direct loan manager's portfolio. Universes and composite returns based on private funds of direct loans fall short on the investability and reflective criteria. Some private funds in the universe are not available to investors and therefore not investable. Also, private fund holdings are considered intellectual property by the managers and not disclosed. Therefore, managers have no information about the underlying holdings against which they are being evaluated.
In summary, there is no ideal benchmark for direct lending, but this is also a problem that applies to all private asset classes. While the most common benchmark used currently is an equivalent public index, like the S&P/LSTA Leveraged Loan Index or the Bloomberg Barclays High Yield Bond Index, more investors are shifting to the CDLI because it better represents what loan managers actually invest in.
DIVERSIFICATION
Some early investors in direct lending selected just one or a couple of direct lenders, perhaps to gain understanding of the asset class or as an opportunistic investment within private equity. Now that institutional investors (fiduciaries) are beginning to make larger and targeted allocations to private debt as an asset class, a more structured approach to portfolio construction is needed.
Leaving the benchmark choice aside, the presence of direct loan risk factors (Exhibit 9.1) and the exposures of loan manager to those risk factors (Exhibit 13.3) provide useful guidance for portfolio construction.
First is the recognition that no single loan manager can represent the US corporate middle market for direct loans. In fact, it is not even close. Not only does the average manager have too few loans, but each manager has different exposures to risk factors and premiums. Unless the fiduciary wants to provide long‐term direction on what parts of the direct loan market are most favorable – and they don't – then a multiple manager structure is an absolute requirement.
Regarding risk‐factor exposures, fiduciaries should target the aggregate exposures of the direct loan market, as represented by the CDLI, when they are selecting direct lenders as a group. Markets tend toward efficiency, even private ones, and aggregate characteristics are more likely to produce the best risk‐adjusted returns. Given the more focused tendencies of individual loan managers as reported in Exhibit 13.3, it will likely take five or more direct lenders to achieve a portfolio that sufficiently captures the variety in middle market loans.
Second is the recognition that the lack of diversification among managers will likely expose the overall portfolio to other factor risks that are diversifiable with no likely sacrifice in long‐term return. These include sponsor risk and industry risk. Sponsors back approximately 70% or more of borrowers. In a typical direct lender profile, sponsor‐backed loans are not broadly diversified across private equity firms. Instead, one or a few firms represent an outsized percentage of loans originated by the direct lender. By itself, this is not necessarily a bad thing as the lender may have a very good relationship with one or two private equity firms that result in regular deal flow with benefits that can be passed along to investors. However, a portfolio consisting of only one or two direct lenders has a good chance of having excessive exposure to a few private equity firms. In effect, the investor ends up with not only direct lender manager risk but also private equity manager risk. A portfolio with multiple direct lenders will diversify the private equity firm risk underlying the sponsor‐backed loans made by the direct lenders.
The US corporate middle market is well diversified across industries. Investors will likely take on unnecessary and noncompensated risk by concentrating loans in one industry or subset of industries. That industry risk increases the probability of defaults. From a practical perspective this was recently illustrated during the oil crisis in 2015 and 2016. A lender skilled at picking energy borrowers would still produce outsized realized and unrealized losses because of the industry downturn, even though the lender's borrower performed better when compared to the average energy borrower.
Exhibit 17.2 reports global industry classification standard (GICS) sector weights for direct corporate loans in the CDLI at December 31, 2017. One modification has been made to the sectors. An Other sector replaces the GICS Real Estate sector because the direct lending represents corporate, not real estate loans. The Other category captures mostly structured financial assets collateralized by corporate loans.
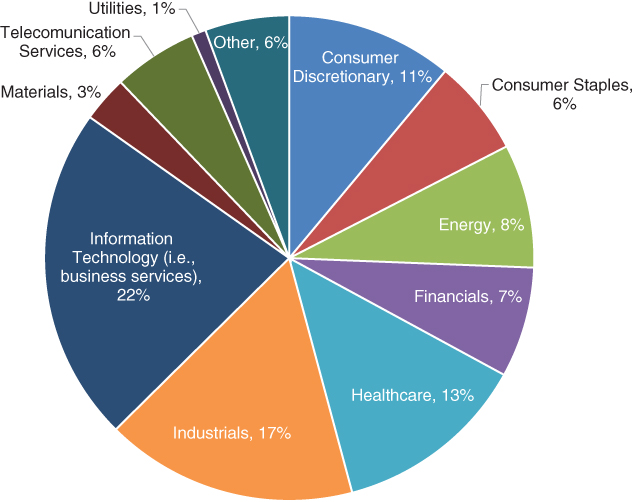
EXHIBIT 17.2 CDLI industry weightings as of December 31, 2017.
The pie chart in Exhibit 17.2 shows that the direct lending market is well diversified across GICS sectors. The largest sector is Information Technology at 22% of total loan assets, with the next two largest sectors, Industrials and Healthcare, comprising 17% and 13%, respectively, of total loan assets.
Exhibit 17.3 provides GICS sector weights for the Russell 2000 Index of middle market and smaller company stocks which should have industry weightings similar to direct middle market loans.
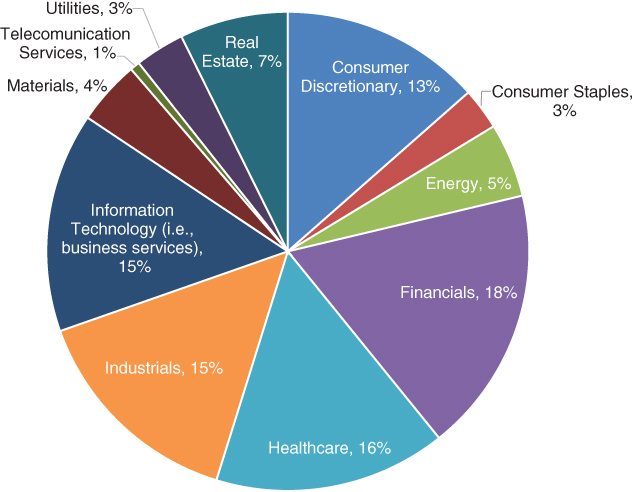
EXHIBIT 17.3 Russell 2000 industry weightings as of December 31, 2017.
Russell 2000 Index sector weightings for stocks are very similar to the CDLI sector weightings for direct loans. Differences lie in two sectors. Financials represent 18% of the Russell 2000 Index and is its largest sector, while representing just 7% of the CDLI. This difference is likely explained by middle market banks not needing access to direct loans through the private markets when they have customer deposits to finance their investment activities. The second difference is the 7% weighting to Real Estate in the Russell 2000 Index. Real estate loans are not part of the CDLI and are therefore excluded from Exhibit 17.2.
A well‐constructed portfolio of direct loans should produce a diversified sector profile like that found in Exhibit 17.2. This is much more likely to be achieved when multiple managers are used because individual direct loan managers seldom construct a portfolio of loans that is sector balanced. Unlike traditional stock and bond managers who can easily optimize portfolios to insure sector diversification, direct lending managers have much greater difficulty creating sector weighting neutrality, even if they have a desire to do so. Consequently, investors need to consider the sector imbalances in the managers they select and actively pursue combinations of managers that achieve sector diversification.
Diversification is perhaps best measured non‐statistically by the number of individual loans (credits) in the overall portfolio. The larger the number of credits, the more credit losses will approach and eventually equal market averages, in this case the realized credit losses for the CDLI and over 6,000 loan holdings. The investor reaches that extreme by hiring all 70‐plus direct lenders represented in the CDLI. Obviously, executing on that strategy is administratively costly unless the investor builds a portfolio of publicly traded BDCs. A combined portfolio that held 150 to 250 individual credits would seem appropriate for an objective to achieve risk‐adjusted returns at or above the CDLI. With leverage, the desired number of credits might be even greater.
The final factor is the level of confidence in the abilities of the direct lender, primarily to underwrite risk well and produce below‐market credit losses. Qualitative factors and quantitative factors such as those covered in Chapter 13 are important. Most institutional investors err on the side of more managers when constructing a portfolio and narrow the list over time as experience reveals a clearer picture of manager skill.
Top performing institutional investors implement disciplined and diversified portfolio construction techniques to asset classes. As allocations to direct lending and private debt increase, investors need to follow the same best practices for portfolio construction followed in other private asset classes. There is no single best answer, but having a good benchmark and guidelines to maintain diversification are necessary for favorable long‐term outcomes.