6 ENSEMBLES OF TEAMS: THE NETFLIX PRIZE WINNERS
Pragmatic (adjective)—Dealing with things sensibly and realistically in a way that is based on practical rather than theoretical considerations.
Chaos (noun)—The property of a complex system whose behaviour is so unpredictable as to appear random, owing to great sensitivity to small changes in conditions.
—Oxford English Dictionary, 2017
CLOSING THE GAP BETWEEN CONTENDERS
The first year of the Netflix Prize had been a whirlwind of ideas and a blur of progress. Before BellKor rose to the top of the leaderboard, a handful of other teams came in and out of the top spot, while a flurry of discussion and exchange of ideas taking place in the community helped to close the gap between the remaining contenders. Some of this discussion took place at academic conferences and workshops focused on data mining. Another venue was the Netflix Prize Forum, an online community Netflix had set up for the contestants.
The Netflix Prize Forum offered a place for contestants to share their results and insights informally. Soon after the competition began, the forum was humming with activity. As one of the competition’s organizers observed:
In addition to active submissions, there has been substantial engagement between contestants on the Netflix Prize Forum, including sharing of code and coding ideas, additional data, insights on the patterns found in the data, even pooling of submissions (and hence teams) themselves to achieve increased accuracy (“blending”).1
Before the teams had published much of their research, Netflix also studied comments in the forum to find which methods performed well. On this forum, within less than a year after the competition began, Netflix noticed two of the key ideas that became ubiquitous among the top teams’ submissions: an influential description of matrix factorization as well as an approach known as model blending.2
Newspapers and magazines had also begun to chronicle the real-life stories of casual and part-time data scientists working nights and weekends from their home offices. One contestant, a 48-year-old management consultant with a degree in psychology, was considering whether to get a PhD in machine learning. He went by the name “Just a guy in a Garage” in the competition, although technically he worked out of his bedroom.3 Soon after that, the New York Times chronicled a 32-year-old father of four who worked at his dining room table, along with a 51-year old “semi-retired” computer scientist who brainstormed with his 12- and 13-year-old kids about which new ideas to try. They suggested looking carefully at movie sequels to get a leg up on the competition.4
THE END OF THE FIRST YEAR
In the final weeks of the first year of the competition, Team BellKor—the AT&T and Yahoo! researchers—held first place. But near the end of the first year they found themselves challenged by the second- and third-place contenders, teams consisting of young and ambitious recent graduates from two teams, Gravity and Dinosaur Planet.
A day before that first year ended, these second- and third-place teams literally merged. The combined team, which called itself “When Gravity and Dinosaurs Unite,” averaged their predictions and submitted this average of their two models to Netflix, and the newly minted team was suddenly in first place.5 Over the next day, BellKor and the new team raced against the clock, furiously coding and debugging. Technically they could only submit one model to Netflix per day, so their final submission needed to count. In the end, BellKor managed to submit an entry that barely beat When Gravity and Dinosaurs Unite, coming in at 8.43 percent above Cinematch—and just 0.05 percent above their competitors. BellKor won the first year’s $50,000 Progress Prize, but not by much.6
To claim the reward, BellKor needed to publish a report about their algorithms. After they did this, their secrets were out in the open for everyone to see, and the moat around them continued to fill with other contestants.7 To make matters worse, BellKor found that it was becoming more and more difficult to beat their own results. Having averaged an improvement of 0.16 percent per week toward the Prize goal of 10 percent in the first year, BellKor averaged just 0.02 percent per week the second year. Their progress had ground to a near-halt.
They had already picked most of the low-hanging fruit in the first year, when the teams established the most successful components of their models. This included the baseline model—the Scrooge effect (to describe users’ tendency to rate high or low) and the E.T. effect (to explain whether movies were good or bad regardless of who was rating them)—along with models like matrix factorization to handle the Terminator effect, which summarized users’ unique preferences.
In the second year, these teams were facing what we might call the Napoleon Dynamite problem. Teams competing for the Netflix Prize found it famously difficult to predict the effect the 2004 cult classic Napoleon Dynamite would have on different viewers.8 Clive Thompson explained the reason the film posed such a challenge in the New York Times Magazine, citing one of the contestants:
The reason, [the contestant] says, is that Napoleon Dynamite is very weird and very polarizing. It contains a lot of arch, ironic humor, including a famously kooky dance performed by the titular teenage character to help his hapless friend win a student-council election. It’s the type of quirky entertainment that tends to be either loved or despised. The movie has been rated more than two million times in the Netflix database, and the ratings are disproportionately one or five stars.9
The difficulty in predicting whether a Netflix customer will like Napoleon Dynamite gets at both the core strength and the core weakness of any recommendation system: personalized recommendations can only work if there is some redundancy in users’ preferences. If a movie existed that was completely un-redundant with other movies, then neither matrix factorization nor other methods would be useful for making personalized recommendations about that movie.10 This doesn’t mean that Napoleon Dynamite wasn’t redundant, but with many of the methods people tried, they couldn’t find where that redundancy was hidden.
It felt like the ratings matrix was a wet towel that they had been trying to squeeze dry for a while, collecting the precious water from the towel in a bucket. They had squeezed it as long as they could in a certain way, so it was time to unfold the towel to try squeezing it in a different way. And so these teams tried some different approaches to capture the Terminator effect, turning the towel this way and that.
One model that became popular, even in the first year, was an artificial neural network developed by the researchers in the team ML@UToronto. This neural network was mathematically very similar to matrix factorization, but it dealt with missing ratings differently, and it treated ratings as discrete categories 1, 2, 3, 4, or 5 instead of real numbers in the range 1.0 to 5.0. In other words, it twisted the towel a bit differently than matrix factorization.
Another method the teams used searched for movies that were similar to one another. If you like a certain movie—say, Cinderella—and this movie is very similar to another one that you’ve never rated—say, Sleeping Beauty—then these methods should be able to recommend the latter movie to you. The teams also tried to find which users were similar. If you were similar to a fellow over in Wyoming in the way you’ve rated movies, and this fellow has given a high rating to a movie you’ve never seen—say, Back to the Future—then these methods should recommend that movie to you, too. The trick with getting these methods to work, of course, was in how they decided what made one user “similar to” another user. There’s no single, correct way to do this, but the teams did their best, writing out mathematical functions in their programs to encode their intuitions.
Another trick to solving the Napoleon Dynamite problem was by looking not just at which star ratings users gave to different movies, but also at which movies they had rated. For example, regardless of whether you like the movie Star Trek IV—the one in which they go back to present-day Earth to find whales—the fact that you have even rated a Star Trek movie gives a lot of information about which types of movies you tend to like.11 The teams found that by incorporating this “implicit” information—that is, information about which movies you’ve watched, not just how you rate them—they could decrease their relative error by roughly 10 percent. This was a small but welcome improvement, given how difficult it was to squeeze water out of their towel by this point.12
PREDICTIONS OVER TIME
The second year of the competition, these teams also turned their attention to a different part of the data: when users rated movies.13 But contestants faced a problem because Netflix ratings reflect a changing world: the popularity of movies changes over time, and people themselves change their preferences over time. If you asked a viewer to rate a movie one month and have her rate the movie again a month later, her rating would change by an average of 0.4 stars.14 And to make things even more difficult, she’d tend to assign different scores to movies on Mondays than she will on Fridays.15
The researchers behind BellKor addressed this problem by letting parts of their model be flexible enough to reflect their observations about how ratings changed over time. They revisited the movie-popularity offset in their baseline model. Instead of measuring a movie’s popularity once over the entire period, they measured it more often, grouping the ratings into 10-week “bins.”16
Figure 6.1 shows what the average popularity looked like for The Matrix, which came out in 1999, if we break it up into 10-week intervals. Over the two years following its release in 1999, The Matrix gradually decreased in popularity. Its sequel, Matrix Reloaded, was released in May 2003, which might have explained the spike in popularity of the original Matrix in early 2003.
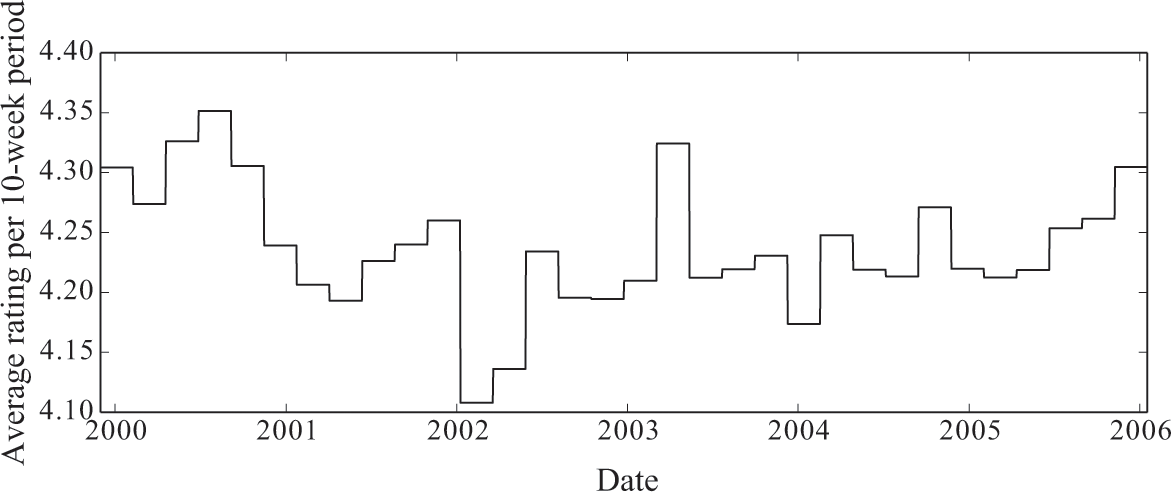
Popularity of the movie The Matrix over time.
A bigger challenge in how time impacted movie ratings rested in the viewers themselves. Sometimes a user rated many movies at a time, and those “bursts” might occur when she was in a particularly good or bad mood. Other times the primary Netflix user in a household changed—for example, as a teenager began watching more Netflix than her parents. BellKor addressed this by assuming that customers’ preferences might drift gradually over time in a fixed direction, while also assuming that their ratings on a given day might be a bit higher or lower than this gradual drift suggested.17
The data was wildly distorted in other ways, too. BellKor noticed that Netflix customers’ rating scales could moderate over time, as if they were becoming more or less apathetic in rating movies. It wasn’t that their ratings became higher or lower on average (although this happened too). It was that they also became more or less extreme over time. As before, BellKor captured this effect by assuming that users rated movies in bursts on a given day, when they were particularly moderate or extreme in the ratings they assigned.18
Sometimes these trends were harder to explain. The members of Pragmatic Theory—the “two guys without a clue” we briefly met in the last chapter—noticed that the number of ratings made by a customer on a given day was a useful predictor of whether the movie was good or not.
The team’s observation was confusing because it wasn’t just due to anomalies in the users who made the bulk ratings: that part was old news. This was a peculiarity about the movies being rated. Some movies tended to receive more stars than expected when included in a bulk rating, while other movies tended to receive fewer stars than expected when included in a bulk rating. When team BellKor eventually learned about this result from the guys in Pragmatic Theory, they hypothesized that users remember movies asymmetrically. Some movies are memorably good or memorably bad, while others are just not very memorable. When users rates movies in bulk, they tend to include movies they saw a long time ago—particularly those movies that were memorably good or bad. Those who loved or hated a memorably good or bad movie will remember it long afterward and likely rate it during a bulk rating, while those who didn’t feel strongly about it will simply forget about it by the next time they bulk-rate movies.19
The Netflix Prize dataset was chock-full of data-mining gems like this. Here’s another one: a team named BigChaos noticed that the number of letters in a title was predictive of whether users liked it (the effect wasn’t large, but it was present). As the competition wore on, the different teams mined these gems, bit by precious bit.
OVERFITTING
Since Netflix gave its contestants so much data, the teams could just about “assume” parts of their model into existence by adding parameters to their model in a way that matched their intuitions. If a team had a hunch that movies’ popularities were predictive of customers’ ratings (they are), they simply needed to add a new parameter to their model for each movie that could “absorb” that information.20 If the team had a hunch that customers might be somewhat biased in their ratings (they are), then they simply needed to add a new parameter to their model for each customer to absorb that information too. These two parameters made up their baseline model. And when a team wanted to also assume that movies’ popularities change over time, and that customers’ biases vary over time, they did so by adding parameters to their model for each of those things.
The main risk the teams faced with these parameters was whether they were adding more flexibility to their models than justified by the amount of data they had. If they added too many parameters, they ran a risk of “overfitting” to their dataset. Overfitting means that their apparently good performance in predicting ratings might be a mirage. They might think that they’re predicting ratings well because the error in their predictions looks low, when it’s instead because they have so many parameters to work with—basically, so many knobs to tune—that they end up making their model look better than it really is. If they were overfitting, then their apparently good predictions might not carry over to the secret dataset that Netflix used to evaluate the contestants. For example, BellKor could have added a parameter to their model for every customer-movie pair in their dataset. This could explain the ratings in their movies dataset with perfect accuracy.21 But it would be useless in predicting ratings for any user-movie pairs they hadn’t seen before. Fortunately it was easy for the contestants to keep an eye on whether they were overfitting, because they could keep aside a fraction of their own dataset (Netflix provided them with a sample for this very purpose) and test against it to make sure they weren’t overfitting. We’ll see a couple more ways to deal with overfitting when we look at neural networks in a few chapters.
MODEL BLENDING
The progress toward the Netflix Prize and its conclusion in the first year had transfixed the contestants. After BellKor published their work for the community, their peers pored over their report carefully, reading about their baseline model, their matrix factorization model, and the neural network BellKor used. They also read about how BellKor had blended a whole bunch of different versions of these models together. It wasn’t a surprise to the other contestants that BellKor had been blending models—it hadn’t exactly been a secret, and blended models had already been discussed in the online forum. But it was now undeniable from BellKor’s paper that blended models worked. Besides, when Gravity and Dinosaur Planet combined, they had implicitly used model blending when they averaged predictions from their two separate models.
When BellKor was researching how to predict ratings, they needed to make a lot of decisions about what should go into their model. When they fit a matrix factorization model, they needed to answer questions such as: How many “genres” should we use to summarize each movie? Should we include the implicit ratings information? When they fit a nearest-neighbor model for movies, they needed to decide what it meant for two movies to be similar. They could try a bunch of educated guesses and validate their guesses with data, but they had a lot of different decisions to make. If they tried to tune all of their parameters to find the perfect setting for all of them, there was a good chance they might overfit.
Instead, BellKor created many models with somewhat different parameter settings, and then they averaged them. To win their first Progress Prize, they averaged 107 different models. Did BellKor need to combine so many separate models? Probably not: they noted that they used so many models in part for convenience. They already had those models from earlier experiments, and it didn’t hurt to keep them in the final blend, so why not? But they found that they could get results that were comparably as good or better with only about fifty models.22
Why does model blending work? When a contestant asked BellKor on the Netflix Prize Forum which of their 107 models was best, Yehuda Koren, one of the members of the team, listed some of its benefits:
It allows concentrating on relatively simple models, which are fast to code and to run. The result is also more robust against programming bugs and overfitting. …
I will not recommend just one of the predictors. You want at least to explain the data at multiple scales (local+regional).23
In other words, blending models is good for both practical and modeling reasons. It’s practical to use the average of many simple models, because simple models are easy to program and less prone to bugs. And if you use many different models, you can capture the uncertainty in your dataset at many different “granularities.” For example, if you’re debating between using 10 genres and 100 genres in your matrix factorization model, you can simply use both. The 10-genre model can capture the high-level “gist” of each user’s movie preferences, while the 100-genre model can capture the fine nuance of her preferences.
This idea of model averaging is also supported by a rich set of theoretical results, and the intuition is easy to get at. Let’s say that you’re investing in the stock market, and you are deciding whether to put all of your money into stock A, which returns, on average, 12 percent per year; or into a hundred different stocks which each return, on average, 12 percent per year. If you have the same uncertainty about the outcome of all of these stocks, then you’re better off splitting your money equally among the hundred stocks.24 Why? Because you can still expect to get an average of 12 percent per year, but you’ll have lower uncertainty about your outcome: some of the stocks that return less than 12 percent will be offset by the stocks that return more than that.25 Each of BellKor’s 107 models was “trained” to make a different prediction of users’ movie-ratings; so by blending these 107 models, BellKor’s new predictor still predicted the same thing, but with less uncertainty.
But wait, you might say. We saw that with the financial crisis of 2008 and 2009, the entire stock market went down. Having a portfolio of 100 stocks wouldn’t have offered much protection against this, so this “less uncertainty” argument is bogus. This is correct, and it gets at the core of when model blending works and when it doesn’t work. Most stocks are correlated to one another, and model blending works well when the models are uncorrelated. If one model predicts too high a Netflix rating, the other models should help to mitigate this, not to reinforce it. This can happen more easily when they are uncorrelated.
We can get some further intuition for how model blending helps by looking at boosting, one of the methods the top teams used to blend their models as their submissions improved. The intuition behind boosting is that by combining many “weak” models—each one of which might not be very good, but each of which is at least a little good—we can end up with a much more powerful model than any of the original ones.26
To apply boosting to a problem like the Netflix challenge, we would begin by training a very simple model to predict movie ratings. Its predictions won’t be perfect, so we take the ratings that the model got wrong and magnify them—that is, we give them more weight than the other ratings, because we want the classifier to care about them more the next time around—and then we fit a second model with these adjusted weights. Then we repeat the process again and again, magnifying the incorrect ratings and refitting a new model each time. By the time we’re done, we’ll have easily trained tens, hundreds, or even thousands of models. If we average these models with the right weights, the result will be a single, blended monster of a model that works better than any single one.
THE SECOND YEAR
As the second year wore on, several other teams began threatening BellKor on the leaderboard. The team When Gravity and Dinosaurs Unite was never very far behind, but after the first summer, the three Princeton undergrads from the Dinosaur Planet part of the team found themselves busy with grad school and work.27 As the end of the second year of the competition grew near, another team called BigChaos began to threaten BellKor.
BigChaos was experimenting a lot with the way they blended their models. In the first year, they combined models by simply using a weighted average of them. During the second year they found a neural network to be especially useful when combining their models. The neural network could learn a more sophisticated way to combine the simple models than by taking a simple average.28
But as the second year continued, all of the top teams struggled to make more progress. The prize organizers were starting to wonder whether contestants would make enough progress to win the prize at all.29 As the deadline for the second Progress Prize approached, the situation grew more intense. For any team to win the second $50,000 Progress Prize, they needed to exceed the previous year’s 8.43 percent improvement by an entire 1 percent. BellKor and BigChaos were the top two teams, but at the rate they were progressing, it could take them over a month to reach the 9.43 percent goal.30
In the end, BellKor and BigChaos caused another upset: they combined into a single team. The merged team, which they decided to call BellKor in BigChaos, exceeded Cinematch by 9.44 percent. This was precariously close to the threshold they needed for the second Progress Prize, and it was still far from their 10 percent target, but it was enough for the new team to win their $50,000.
The five members of BellKor in BigChaos could pause to make a collective sigh of relief, but they couldn’t rest long. If no team hit that 10 percent goal in the coming year, nobody would qualify for the Progress Prize either. Would that be the end of the competition? There was also palpable speculation in the air about another topic: Which teams would merge next? The competition had entered a new phase, and the teams’ attention began to shift from predicting ratings in the ratings matrix to finding the best strategy for teams to merge.
THE FINAL YEAR
As the final year progressed, BellKor in BigChaos continued to top the leaderboard, with When Gravity and Dinosaurs Unite never far behind. But by then, another team had begun to show up on the leaderboards: Pragmatic Theory, the Canadian duo we’ve seen a couple of times already, the two guys without a clue. Despite their initial unfamiliarity with the field, they found the Netflix community to be extremely collegial, and they carefully studied the methods of the other contestants. When BellKor in BigChaos published their results, the members of Pragmatic Theory immediately downloaded and carefully studied their papers. Over time, and working nonstop, Pragmatic Theory continued to move up the official leaderboard.31
If BellKor’s emphasis was on the theory of collaborative filtering, and BigChaos’s emphasis was on blending algorithms, then Pragmatic Theory’s emphasis was the sheer quantity of effort they invested and results they obtained. In one paper they published about their methods, I counted 707 separate models that went into their blend. Although this would have been impractical for the production system that Netflix would need to implement, Pragmatic Theory didn’t care about that. They cared about predicting the ratings as accurately as possible. They outlined this philosophy in one of their papers (emphasis added):
The solution presented in this document was exclusively aimed at building a system that would predict subscriber ratings with the highest possible accuracy. … The solution is based on a huge amount of models and predictors which would not be practical as part of a commercial recommender system. However, this result is a direct consequence of the nature and goal of the competition: obtain the highest possible accuracy at any cost, disregarding completely the complexity of the solution and the execution performance.32
In other words, Pragmatic Theory developed a solution that would have been impractical to implement precisely because they were being pragmatic. BellKor in BigChaos saw another trait in them. Chris Volinsky, of the original team BellKor, explained that he and his colleagues converged on the adjective fearless to describe Pragmatic Theory. But Pragmatic Theory was also alarming to BellKor in BigChaos for another reason.
This late in the competition, the focus of the community had moved somewhat away from optimizing and blending their models and toward optimizing their teams. Since each team was facing the same difficulties in eking out improvements in their models, the tone of the competition was beginning to suggest that these teams would continue to merge to reach the 10 percent target.
BellKor in BigChaos noticed that Pragmatic Theory—the fearless Canadian duo—was a prime “merge target” by another team. If another team picked them up, that team could become a serious threat. Should BellKor in BigChaos try to merge with Pragmatic Theory? Maybe, but BellKor in BigChaos were also in secret discussions with other teams, and there might be a better team to merge with, such as When Gravity and Dinosaurs Unite—the recent grads from Princeton who went off to industry and grad school, who had combined with the Hungarian graduate students.
BellKor in BigChaos needed to act, and they needed to do so quickly. Around this time, When Gravity and Dinosaurs Unite formed a new team called Grand Prize Team. This new team invited anyone to join, offering a fraction of the $1 million prize proportional to how much closer the newcomers brought them to winning. This frightened BellKor in BigChaos, as it could quickly spell the end of them if a team like Pragmatic Theory joined Grand Prize Team.
In the end, BellKor in BigChaos decided to merge with Pragmatic Theory to form the new team BellKor’s Pragmatic Chaos (you can keep track of how the leading teams merged in figure 6.2). BellKor in BigChaos had been in secret discussions with Pragmatic Theory and other teams for some time before their merger. When BellKor’s Pragmatic Chaos submitted their combined model, they beat Cinematch by 10.05 percent, putting them past the 10 percent threshold.

The chart shows team progress toward the Netflix Prize. The final team to win the competition was BellKor’s Pragmatic Chaos.
But this wasn’t quite the end of the competition. Netflix’s rules dictated that, once the first team breached the 10 percent barrier, a 30-day “last call” period would begin. At the end of that period, the winner would be decided, based on whoever had the lowest prediction error on that double-secret dataset that Netflix had set aside at the very beginning of the competition. Scores on that double-secret dataset would be rounded to four decimal points, and ties would be broken by submission time.
The remaining teams had a month to catch up. The bubbling phenomenon of team merging spilled over into a desperate froth. The other leading teams, including Grand Prize Team, brokered a deal to form a massive consortium called “The Ensemble,” which contained over thirty teams (an “ensemble” in machine learning is another name for a blend of different models).33
Internally, the members of The Ensemble debated about their strategy in the final month: Should they wait until the last minute, and then submit their combined model? Or should they make submissions early and often? Submitting late could keep their existence a secret and catch BellKor’s Pragmatic Chaos by surprise. But submitting early could enable them to avoid any last-minute catastrophes. Ultimately they voted to keep the existence of The Ensemble a closely held secret and to make their first submission as a team one day before the deadline; when that day arrived, they submitted their model as The Ensemble, coming in at 10.09 percent, just barely beating BellKor’s Pragmatic Chaos, who had gotten up to 10.08 percent by then. Twenty-four minutes before the final deadline, BellKor’s Pragmatic Chaos submitted again, and also came in with a score of 10.09 percent. And then, four minutes before the final deadline, The Ensemble submitted a model that reached 10.10 percent on the leaderboard. The competition was over, and Netflix needed to evaluate the models on their double-secret dataset.
On the double-secret dataset, BellKor’s Pragmatic Chaos and The Ensemble tied up to four decimal places, which, according to Netflix’s rules, put them at a tie; and ties were to be broken based on the time of submission. BellKor’s Pragmatic Chaos had made their submission 20 minutes earlier than The Ensemble, and so the three-year competition came to an end. BellKor’s Pragmatic Chaos claimed the $1 million prize.34
AFTER THE COMPETITION
Despite the impressive performance of the final teams, Netflix never implemented the final suite of models submitted by either BellKor’s Pragmatic Chaos or The Ensemble. A few people, apparently upset about this, even called the Netflix Prize a failure. And although Netflix tried to anonymize their dataset, one group of researchers pointed out some ways the dataset theoretically exposed its customers’ privacy, claims which were widely misinterpreted in the media. As a result, Netflix withdrew their dataset from the public and attempted to scrub all traces of it, a move one contestant called a “damned shame.”
This aside, the competition was a success by a number of metrics. First, Netflix had incorporated some of the ideas from the competition. They found that two of the methods described by teams in their first year—matrix factorization and the neural network developed by the Toronto team—offered significant improvements over Netflix’s own algorithm; these two alone netted them a 7.6 percent improvement over Cinematch. For paying out two Progress Prizes of $50,000 and the grand prize of $1 million, they received in return many thousands of hours of cutting-edge research by world experts along with exposure to this talent in a tight labor market.35
They also received—possibly most importantly of all—strong evidence that they shouldn’t invest significant effort beyond a certain point. They had seen from the contestants where they should start to expect diminishing returns. In the meantime, they had also seen their business moving much more in the direction of online, streaming video, and away from DVD rental. While their recommendation engine would still be an important feature of their new product, they also had other things to think about.36
The Netflix Prize was a success for the research community as well. While the DARPA Grand Challenges received hundreds of submissions, the Netflix Prize had tens of thousands.37 On the technical side, the competition empirically established matrix factorization and model averaging as some of the best methods for recommendation systems. While these ideas had been around for a long time, the competition helped to publicize them by offering objective and public evidence of their performance.