CHAPTER 14
The Steady Advance of Lean Thinking
In July of 2000, Art Byrne and his management team at the Wiremold Company reached a somber conclusion. They decided they should accept the $770 million buyout offer from Legrand S.A. of France and bring three generations of Murphy family ownership to an end.
Viewed in one way, this was a sad event driven by the need of the five members of the Murphy family, all in their 80s or 90s, to pay inheritance taxes on the extraordinary appreciation in the value of their company since Art’s team took over in 1991. But viewed another way, the sale marked a triumph of lean thinking. A firm near bankruptcy in 1991, with an assessed value of only $30 million, was turned into an engine of wealth creation over the course of a decade. Even better, the newly created wealth—a 2500 percent increase on the level of 1991—was shared widely with Wiremold’s employees who collectively owned the largest block of Wiremold stock. In our view, Wiremold’s steady advance through an entire decade could have been duplicated by most companies in the 1990s. All they needed to do was follow Wiremold in steadily eliminating waste and pay ever more attention to the voice of the customer in order to create a win-win-win-win for customers, owners, employees, and suppliers.
1
And, as we will see in the pages ahead, Wiremold’s continuing success up to the present
was
duplicated in varying degrees by many firms, including those whose lean transformations we chronicled in the first edition of
Lean Thinking.
By contrast, many other firms in the 1990s flew a ballistic trajectory. They zoomed upward in sales and stock valuations on the basis of new business models and optimistic earnings projections before going over the inflection point and heading back to their starting point, if not into bankruptcy.
As managers and investors survey the wreckage of the bubble economy and search for sustainable approaches to wealth creation in the future, a fresh look
at the steady advance of lean thinking firms is instructive. The obvious place to begin is with Toyota, the firm that pioneered lean thinking many years ago.
The Steady Advance of Toyota
In the summer of 2002 Toyota allowed itself to do something it almost never does. It talked out loud about its plans for becoming the market share leader in the global motor vehicle industry. A remarkable company document titled “2010 Global Vision”
2
projected a future in which Toyota’s global market share would continue its steady growth from 11 percent in 2002 to reach 15 percent by about 2010. By contrast, General Motors, the current market share leader, had about 14 percent of the global market in 2002, and its share has been trending downward for decades, as shown in
Figure 14.1
. Toyota doesn’t say so explicitly—this is definitely not the company’s style—but everyone in the industry understands that the “2010 Global Vision” is a statement by Toyota that it plans to be number one within a few years.
(Toyota’s vision is given credibility by the success of its Global 10 initiative launched in the mid-1990s to gain 10 percent of the global motor vehicle market by 2000. In 2000, Toyota’s global share was 10.01 percent.)
F
IGURE
14.1: G
LOBAL
M
ARKET
S
HARE
: T
OYOTA
V
ERSUS
GM
Data includes cars and commercial vehicles. GM includes Saab, Opel, and Holden. Toyota includes Daihatsu and Hino. © Copyright 2003, Ward’s Communications
.
F
IGURE
14.2: U.S. M
OTOR
V
EHICLE
M
ARKET
S
HARES BY
C
OMPANY
Note: Chrysler Corp. does not include Mercedes; Ford does not include Jaguar, Land Rover, or Volvo; and GM does not include Saab. Source: Ward’s AutoInfoBank
Looking at the U.S. market, we note the same trend of steady share gains by Toyota, compared with the declining shares of the traditional Big Three. On current trend, Toyota will pass both Chrysler and Ford in the U.S. market by the time it achieves its global share target (see
Figure 14.2
).
It’s important to note that Toyota’s steady share gains are not being bought at the cost of low margins. Toyota reported growing profits through the 1990s and record profits in 2002. Indeed, its return on sales in fiscal 2002 was the highest in the global auto industry, excepting one company we will discuss in a moment.
It’s also important to understand that the company marches steadily ahead without needing to be a dramatic innovator in the vehicle market. With the exception of the Prius hybrid, the RX300 “crossover” SUV, and the recently announced Scion line to attract young buyers, Toyota has been a plodding follower in the new market segments with highest growth: pickups, minivans, SUVs.
3
This strategy has worked and continues to work because Toyota is the most brilliant manager of core processes in the history of industry. Its product development process delivers new products on time with very few defects,
products
that are more refined and cheaper to make than similar offerings from competitors. And its production and supplier management processes, as described in
Chapter 10
, deliver higher quality at lower cost with higher selling prices within each segment of the market.
In addition, Toyota relentlessly manages and improves every process in its business. Even something seemingly minor, like the spare parts distribution process described in
Chapter 4
, is continually pushed ahead. When we visited this process in 1996, Toyota was just introducing its Daily Ordering System and showing its suppliers how to make and ship replacement parts every day. Its competitors, by contrast, were ordering parts monthly and their suppliers shipped large batches of parts infrequently according to traditional auto industry practice. By the end of 2002, 60 percent of Toyota’s spare parts suppliers were making and shipping parts every day in response to deliveries by Toyota to its dealers the previous day. These parts were shipped via a central cross-docking center in Kentucky to the eleven Regional Parts Distribution Centers. Toyota has also made steady progress in improving processes in its dealerships, halving dealer inventories of spare parts while increasing the productive area for vehicle service (freed up from former parts storage space) by 20 percent.
The brilliance of Toyota’s processes mean that Toyota does not need to gamble on daring product designs within an established segment of the market or to pioneer new segments. Its situation is remarkably similar to that of General Motors in its golden period from the early 1920s into the 1960s, when Alfred Sloan decreed that gambles on product technology were unnecessary as long as the company could quickly match any successful innovation by more daring competitors.
4
Toyota can quickly copy the products others pioneer and win decisively because it continues to pioneer brilliant processes its competitors have taken halting steps to copy.
We emphasize this observation because it is truly good news for companies embracing lean thinking: you usually don’t need to play brilliant hunches or score dramatic product breakthroughs to be successful. You can get there with brilliant process management instead, which is within the grasp of any firm with an enduring commitment.
Lean Processes Plus Brilliant Products at Porsche
We told in
Chapter 9
of the revitalization of Porsche in the mid-1990s, but noted that its new products set for launch just as the book was published—the Boxster and the new 911—really did need to be brilliant and required perfect placement in a crowded market. Porsche could not afford a major product error and needed both brilliant processes and brilliant products to garner the high prices necessary to survive as the lone midget in an industry of giants.
5
Fortunately, the new Porsches
were
brilliant, and not by accident—Porsche completely overhauled its traditional functional development process, as we explained in
Chapter 9
. In addition, Porsche continued to make steady progress in its manufacturing operations
6
in two directions.
First, it was able to offer customers a huge and growing range of options for their vehicles, while steadily reducing the number of hours it took to assemble each car.
Second, by improving quality, both in assembly and in purchased parts (by sending its lean promotion team to work closely with suppliers), Porsche was able to close the Pre-Delivery Inspection Centers in its main markets like the USA, where engineers used to go through each car with a fine-tooth comb to maintain Porsche’s leading position in consumer quality rankings. These were simply not needed anymore because the quality at the end of the assembly lines was now truly excellent.
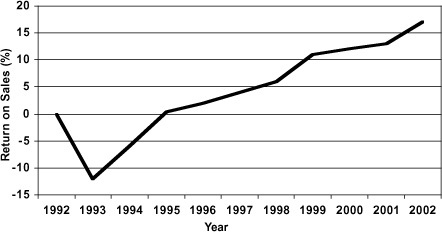
As a result, Porsche is not only the world’s smallest independent car company by a large margin, it is also by far the most profitable. Even using the conservative accounting of a family-controlled German firm (where large amounts of revenues are routinely held back as reserves), Porsche reported a 17 percent return on sales in 2002, twice the rate of Toyota, the next most profitable car company.
F
IGURE
14.3: P
ORSCHE
G
LOBAL
V
EHICLE
S
ALES
Source: Porsche AG Annual Reports
In
Chapter 9
we conjectured that combining German engineering brilliance with Toyota-style process management might produce an industrial hybrid better than either alone, one suited to a low-
volume, high-variety
business. Our surmise seems to be borne out at Porsche in the years since
Lean Thinking
was launched.
F
IGURE
14.4: P
ORSCHE
R
ETURN ON
S
ALES
Source: Porsche AG Annual Reports
Note: “Return on Sales” is net profits before taxes divided by sales
It’s great to be brilliant like Porsche, and you may be even more successful than a Toyota, if
you tend first to your core processes.
Lean Thinking in Capital Goods: Lantech
On November 4, 2002, we stood in the great hall at McCormick Place, the gargantuan exhibition center on the shore of Lake Michigan in Chicago. We were there to inspect a remarkable range of new products launched by Lantech at the annual Packaging Industry Expo to answer the question we asked at the end of
Chapter 6
. What is the future for a “lean” company making products in single-piece flow when these products are designed to wrap large batches for mass producers?
We received a special demonstration of the new devices from founder Pat Lancaster, who has pioneered a whole range of new wrapping equipment designed to stretch and shrink-wrap small amounts of goods at the rate of each cell or assembly line in a manufacturing company. This is in contrast to the usual practice of wrapping large amounts of goods at high speeds in a dedicated shipping department
.
For example, Lantech launched a new integrated palletizer/stretch wrapper at the Chicago show that runs at one-third the rate of previous palletizers, requires one-fourth the footprint on the factory floor, and employs practically no complex electronics to sense where the pallet is, when to start, and when to stop. What makes it a breakthrough into truly continuous-flow manufacturing, with wrapping at the end of the process rather than in a separate department, is that Pat’s new invention costs less than one-fifth the amount of any previous palletizer. Thus the cost per pallet wrapped is lower than for large machines even before the economies in handling are added.
In the period since the end of the show, Lantech has used its “right-sized” product to grow sales almost back to their 1999 peak. The truly remarkable aspect of this accomplishment is that the packaging industry as a whole continues to slog through a deep recession, with sales across the industry down by more than 35 percent from the peak in 1999.
Lantech has therefore taken the path of Porsche in combining a brilliant set of internal processes with a brilliant set of new—and very lean—product technologies, to create a bright future for an already outstandingly profitable business.
Pratt & Whitney: Lean Thinking in a Terrible Industry in a Terrible Time
We noted in
Chapter 8
that the jet engine industry has long been difficult for producers because the amount of physical goods needed to provide a given amount of value to the consumer continually falls. The number of engines per aircraft has fallen from four for the first generation of jet aircraft—the Comet and the Boeing 707—to two on the highest selling current generation products and the amounts of service parts needed per engine hour of operation has fallen steadily from the beginning of the jet age. Through the 1990s, these two trends largely offset the increase in the number of aircraft in operations so that the total sales volume in the industry was stagnant.
However, the industry has now entered a much more difficult era, one with no visible endpoint. By the beginning of 1991—well before the shock of September 11—the hub-and-spoke business model of the major airlines was under severe assault from low cost point-to-point carriers. In addition, disgruntled “road warriors” (high volume business travelers) were rethinking whether the hassle plus the cost of current air travel was worth the benefit. These customers were critical to the hub-and-spoke carriers; in the 1990s high-volume travelers unable to take advantage of special fares requiring advance purchase or Saturday stays accounted for 8 percent of passenger miles
but 50 percent of airline revenues. By the first quarter of 2001 they had seemingly gone on strike and have not returned.
The meltdown of the business model plus the new security environment have resulted in the world’s airlines collectively losing $12 billion in 2002, with a number filing for bankruptcy. As a consequence, new orders for large jet aircraft (netting out cancellations) fell from about 1,100 in 2000 to fewer than 600 in 2002, and engine hours of operation (the key long-term driver of demand for spare parts) fell by 5 percent over this same period, the first sustained decline since the beginning of the jet age.
The other half of industry revenues comes from military customers. Given the war on terrorism we might expect the situation here to be different. However, the end of the Cold War and confusion about the military’s needs in the new security regime have actually worked against Pratt & Whitney’s interests.
To take the most striking example, Pratt provides the sole engine option for the F-22 and F-35,
7
the new front-line American fighter and attack aircraft for at least the next twenty-five years. Pratt’s position sounds like an excellent recipe for sustainable long-term sales and profits. Yet these aircraft have come under continual challenge by new views on defense priorities. As a result, the original projection of 750 twin-engine F-22s for the U.S. Air Force (to replace roughly the same number of F-15s) has been steadily scaled back to 276 aircraft as of mid-2003. Meanwhile, orders for the single-engine F-35, to replace the F-16, originally targeted at 3,000 units, are already down to 2,500, with production still four years away.
Thus, the core of the military market for new Pratt engines has been shrinking, with capital investments spread over smaller and smaller production runs. Continuing orders for spare parts for the large number of military engines currently in use is keeping revenues healthy for now but not to the extent of offsetting the distress in the commercial engine business.
So far we have only described the challenges from the market. We need to complete the picture by pointing out that the industry has three competitors for a shrinking volume of large jet engines—Pratt, GE, and Rolls—and none shows inclination to exit. Even worse, from Pratt’s standpoint (but not in the view of lean thinkers), the two lean laggards as of 1996, GE and Rolls, have been energetically copying the operational leadership of Pratt, intensifying competition even further.
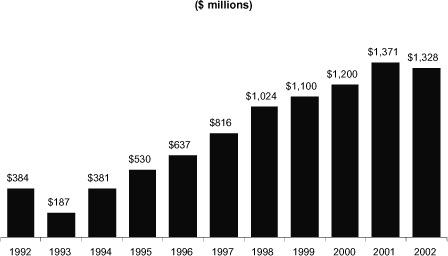
Putting this all together, it’s easy to see why Pratt has not been able to grow its top line (its revenues) since the mid-1990s, as shown in
Figure 14.5
.
What is remarkable is what Pratt has been able to do with its bottom line by continued application of lean thinking.
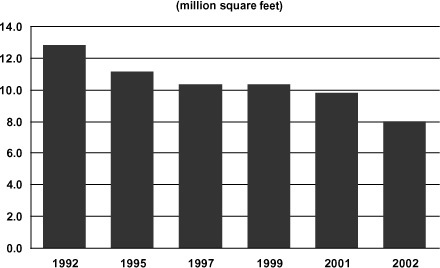
For starters, Pratt has continually shrunk its physical footprint, as shown in
Figure 14.6
. The billion-dollar room in North Haven, Connecticut (
described
on page 174) has been closed, with production moved into a much smaller existing space in East Hartford. The military engine business in Florida has been relocated to existing space in East Hartford as well. And even with these relocations, the footprint of the main Pratt complex in East Hartford has been continually reduced.
F
IGURE
14.5: P
RATT
& W
HITNEY
R
EVENUES
, 1992–2002
Source: Pratt & Whitney
F
IGURE
14.6: P
RATT
& W
HITNEY
M
ANUFACTURING
N
ORTH
A
MERICA
M
ANUFACTURING
F
OOTPRINT
Source: Pratt & Whitney
F
IGURE
14.7: P
RATT
& W
HITNEY
R
ETURN ON
S
ALES AND
R
ETURN ON
A
SSETS
Source: Pratt & Whitney
In addition, capital spending for new equipment has been reduced by buying small, “right-sized” tools with only the capacity and features needed for the job at hand, and Pratt has challenged every new investment using the same thought process. By finding ways to do more with less in every aspect of its business, Pratt has driven its return on assets employed and return on sales steadily upward despite stagnant revenues and severe pricing pressures in its spare parts business (see
Figure 14.7
).
This performance is a remarkable contrast to the last crisis in the aerospace industry, in 1991, when Pratt’s capital heavy business fell immediately into a deep loss
8
and threatened to drag down the parent United Technologies with it. After a decade of lean thinking, spurred by the 1991 crisis, Pratt has been able to weather the loss of volume and prices pressures of 2001–2002 with only a minor drop in its return on sales and assets and its operating profits, as shown in
Figures 14.7
and
14.8.
To use an aerospace metaphor, this is like flying through a severe wind shear (like the downdrafts in a thunderstorm) with practically no loss of altitude.
Given the long-term realities of the market—distressed customers, large minimum scale requirements for new commercial product
programs, and a
large number of competitors in relation to the stagnant manufacturing volume—the 150-year-old Pratt may well face the need for another dramatic transformation into a different type of business. This was achieved twice before: in 1925, when it jumped from machine tools to aircraft engines, and in the late 1940s, when it abandoned piston engines for jets.
F
IGURE
14.8: P
RATT
& W
HITNEY
E
ARNINGS
B
EFORE
I
NTEREST AND
T
AXES
, 1992–2002
Source: Pratt & Whitney
The most promising strategy would seem to be diversification into the $10 billion overhaul and repair business, where lean thinking can be applied with the same results as in manufacturing. Pratt is already well along the path and recently has been acquiring overhaul businesses around the globe as well as growing its small in-house overhaul business. These initiatives have increased its global market share in overhaul and repair from 1 percent in 1992 to 10 percent in 2002.
Whatever the path to growing the top line of the business, Pratt’s lean practices are providing the operating margin and cash needed to steer a new course
.
Beyond Isolated Advances
These are stories of sober success, of companies doing well despite difficult market conditions.
9
They are not the giddy tales often heard during the recent boom, but rather successful keep-on-keeping-on efforts by early adopters (excepting Toyota of course) of the lean thought process we have described. However, they are only meaningful for society at large if many other firms are following them along the path. What evidence can we provide that our ideas are being embraced by firms across the economy?
The best measure is also the simplest: the inventories needed in the economy to support a given level of sales to end customers. It is simply impossible to create a lean business or a lean enterprise encompassing an extended value stream without greatly increasing the velocity of value flowing from raw materials to customers and greatly reducing inventories. This is because the essence of leanness is to eliminate time-consuming but wasteful steps and to create a condition in which the remaining value-creating steps occur in continuous flow at the pull of the customer.
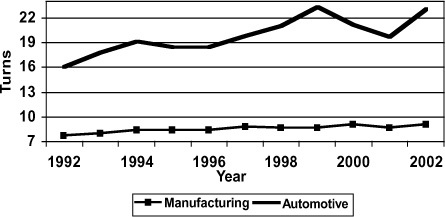
F
IGURE
14.9: U.S. I
NVENTORY
T
URNS
: A
UTOMOTIVE AND
M
ANUFACTURING
Source: U.S. Census Bureau
When we sum the experience of our sample firms along with the thousands of other firms comprising the American economy, using data collected by the American government in a consistent format since 1958, we discover that for a very long time, nothing changed. The level of inventory turns (that is, sales to end customers divided by the
total inventories in the manufacturing
process including raw materials, work in process, and finished goods) was level for nearly forty years from 1958 into the mid-1990s. Turns moved up and down slightly with the business cycle, but showed no trend toward improvement.
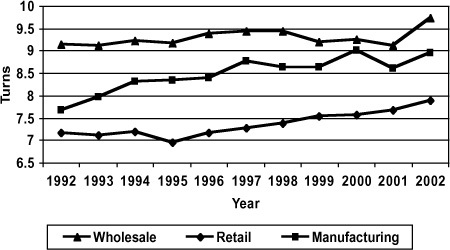
F
IGURE
14.10: U.S. I
NVENTORY
T
URNS
: M
ANUFACTURING
, W
HOLESALE, AND
R
ETAIL
Source: U.S. Census Bureau
During this same interval, the trend in inventory turns in wholesale and retail was much worse. It moved steadily downward from 1958 through 1995 in lockstep with the ever-growing variety of products on offer and the need to support each product with inventory. This trend was despite many innovations in information technology, logistics, and retail formats.
And then the needle began to move. The trend is clearest in motor vehicle manufacturing, as shown in
Figure 14.9
. This is not surprising given Toyota’s powerful presence in this industry. But a steady improvement trend is apparent in many other manufacturing activities and the rate of improvement appears to be picking up again after the recession of 2001, which, like all recessions, caused a temporary fall in inventory turns.
10
Perhaps more interesting is the upward in trend in inventory turns in wholesale and retail where the simple principle of replenishing small amounts frequently from manufacturers (as explained in
Chapter 4
), instead of prepositioning large amounts of goods ahead of demand on the basis of forecasts, seems to be taking hold (
see
Figure 14.10
).
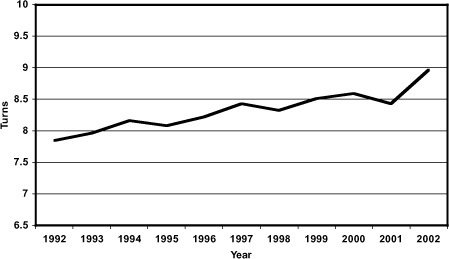
F
IGURE
14.11: U.S. I
NVENTORY
T
URNS
: T
OTAL
E
CONOMY
Source: U.S. Census Bureau
When the manufacturing, wholesale, and retail turns are combined, we see a steady increase across the entire economy, as shown in
Figure 14.11
.
It is certainly too early to claim victory, but the trend since the initial publication of this volume in 1996 is very promising and we look forward to a leaner future than we could have imagined only a decade ago.
This said, the pace is still too slow! What can we do to make greater progress toward the perfect land of zero waste and pure value we envisioned in
Chapter 13
? What can we do to institutionalize and spur the slow revolution in value creation that we believe is under way?
In fact, we have learned a lot about this question in observing the progress of many companies during the years since the launch of this book and we will devote the remainder of this Epilogue to sharing our new wisdom about the lean leap.