CHAPTER 15
Institutionalizing the Revolution
Revolutions in business practice don’t just happen. There must be an action plan that real managers in real companies can deploy. We therefore presented a step-by-step action plan in
Chapter 11
that summarized and condensed the plans of attack of our sample firms. Now we’ll enhance this plan based on direct observation of the change process in a much wider range of organizations over the past six years.
An Enhanced Action Plan
We believe that our original plan is still remarkably sound and we retain all of the steps in the same sequence. However, for many of the steps we have gained additional insights. We will therefore go through our checklist in the same sequence shown in
Chapter 11
, adding to each step where appropriate.
FIND A
CHANGE
AGENT
This first step is as important as ever, but we have discovered in recent years that the typical change agent is evolving as lean thinking spreads. When we began our research a decade ago, a truly inspired and forceful leader at the very top—an Art Byrne, Pat Lancaster, Karl Krapek, or Wendelin Weideking in the position of CEO—seemed to be required to overcome corporate inertia. More recently we have observed a number of lean transformations in companies of different sizes in which the point of origin was mid-level managers and where quiet leadership was effective without need for shouting or theatrics.
But still, a leader—someone who will take personal responsibility for
change—is essential. No organization has ever undergone dramatic and comprehensive change without someone somewhere, softly or in a loud voice, taking the lead.
We’ve learned something else about transformational leadership involving a phenomenon often remarked in human political history: Revolutionaries are often poor managers of the new order once it is put in place. Many of the most effective change agents succeed in the long term because there is someone behind them putting a rigorous system of lean processes in place, someone who can take over and push improvement continuously ahead when the change agent leaves or moves on to other issues. This may be the COO behind the CEO or the head of the Lean Promotion Office under the COO or the product line manager reporting to the head of product development or the value stream manager under the plant manager. The key is that someone somewhere needs to turn a revolution into a rigorous system and make sure that everyone understands and follows the new system.
When there is no one there to put the system in place, the higher level of performance usually lasts only as long as the change agent is directly in charge. (We’ve learned this several times from hard experience when a dynamic leader left and the organization quickly regressed to the mean.) So our advice, based on years of experience, is that every organization should carefully team a system builder with each of its revolutionary change agents in order to sustain results.
GET THE
KNOWLEDGE
Our view of the second step has evolved as well. When we started our research in 1992, the highest levels of lean knowledge were usually resident in Japanese
sensei,
1
often graduates of Toyota or its supplier group, who taught by starting with a simple problem. For example, they identified a multistep process within a single facility, with materials transfers and inventory between each step, and quickly converted the isolated steps to single-piece-flow within a cell. They then went to the next isolated problem—perhaps in the area of 5S or simple pull systems—and solved it. This created a dramatic sense that rapid change was possible while the
sensei
taught lean thinking and lean methods along the way.
For the sensei,
the most valuable aspect of these exercises was not the improvement in performance in a specific process. Rather, it was the raised consciousness of the managers involved in the change process and their enthusiasm for tackling other problems using the knowledge they were slowly acquiring from the sensei.
Behind the stern mask of the sensei,
there was a detailed master plan of how all the parts would eventually fit together to create a complete lean production
system. But this was not revealed at the outset and became apparent to managers only over time as they learned to see.
The problem with this teaching system, once consultants with no direct link to Toyota and many self-taught managers began to practice it, was that there tended to be no big picture waiting to be revealed. Instead of flow kaizen
directed at the total flow of value for a product family, there was only process kaizen,
and usually lots of process kaizen,
focused on isolated individual steps in many value streams. We coined the term “kamikaze kaizen
” (and the accompanying term “kamikaze Six-Sigma”) to describe the likely result: lots of commotion, many isolated victories in the great war against muda,
widespread initial enthusiasm on the basis of early results, impressive amounts of consciousness raising, and … loss of the war when no sustainable benefits reached the customer or the bottom line.
The solution, which we believe is increasingly accepted, is for firms without access to a master sensei
to start consciously at the system level for each product family. This means looking at the big picture, including the most important business needs, and determining the overall plan of march before conducting process kaizen
on the individual steps. As we will see in a moment, this is a job for line managers, not for technical advisers who often have reservoirs of specific lean knowledge but who lack expertise in flow kaizen
and insight into the most important needs of the business. The value-stream map is an invaluable tool to help line managers along the value stream see the whole, as we will explain shortly.
For firms with access to a master sensei,
we have some similar advice. Invest early in systematically writing down the knowledge of the sensei
and inquire about the big picture before too many process kaizen
events are lined up. This may not be an easy conversation, but we believe a higher-level, system focus by senior managers, as the sensei
proceeds with process kaizen,
will produce a better result than either approach alone.
FIND A
LEVER BY
SEIZING THE
CRISIS, OR BY
CREATING
ONE
Our third step is still critical and the reason that recessions are so valuable to firms and society. They create the necessity to seize the opportunity that was always there, by embracing lean thinking. And we know that recessions do at least raise consciousness because sales of our books—including this book—always rise in bad times. But just because there is a crisis does not mean the opportunity will be grasped. The hapless manager we describe on page 251 created a profound crisis for his firm by dramatically reducing selling prices for his durable good. But he soon lost his job for failure to take out the necessary costs through dramatic restructuring of his entire design and production process. For a crisis to be useful, leadership and knowledge must lead to
decisive
action on the tough issues of excess assets, wrong locations, and excess people.
We are also seeing many managers who use the current era of stagnation as an excuse to abandon any efforts to improve their current operations. Instead they relocate design and production, almost always using mass production methods, to remote locations, often thousands of miles from their customers. The new locations have one key attribute—low factor costs, particularly in the form of cheap labor—and they seem irresistible.
The problem is that every competitor can immediately pursue the same strategy, so the advantage is short-lived. In addition, because firms following this strategy add nothing to their knowledge of lean practice, they are vulnerable to shifts in currency rates and geopolitics that may require them to move again soon. We’ll return to this point in a moment in discussing the need to optimize entire value streams on a global basis.
MAP
YOUR
VALUE
STREAMS
This has been the greatest area of learning for us because we had not grasped just how much help the average manager needs to see the value stream. The maps we drew on pages 39 and 42, although accurate and provocative, turned out to be too simple. And we made a critical error by failing to connect on one map the flow of information
going back from the customer to the producer with the transforming actions
on the product, in response to this information, as the good or service moves toward the customer. Making this connection is the critical leap in being able to see the closed circuit of demand and response that is the essence of value creation, an insight that traditional process maps, showing physical transformations alone, fail to provide.
Thus we are deeply grateful to Mike Rother and John Shook for adapting Toyota’s standard method for portraying material and information flows into the value stream maps we now use.
2
These maps can be drawn at any scale, from a simple administrative process within an office to the global flow of an extended value stream running from raw materials in the ground to the end consumer.
The objective in each case is to write down all of the steps in the process as it currently operates to define what we call the Current State. For each step we urge managers to ask a set of very simple questions. Does the step create value for the customer? Is the step capable? (That is, does it produce a good result every time?) Is it available? (That is, can it produce the desired output, not just the desired quality, every time?) Is it flexible? (Can it be changed over quickly from one product to the next so that items can be produced in small lots or even lots of one?) Is capacity for the step adequate so the product doesn’t need to wait on the process? Or is there too much capacity (due to
designing
equipment in large increments of capacity based on demand forecasts that are often wrong)?
3
Steps that do not create value should, of course, be eliminated, while steps that are incapable, unavailable, inflexible, inadequate, and under- or overcapacitized should be perfected. But this step-by-step analysis provides only part of the picture because the relation between the steps is equally important. Does the information coming back from the customer flow smoothly without delays? Does the product moving toward the customer flow smoothly from step to step so that total throughput time is only slightly more than the sum of the times needed for individual processing steps? Does the product flow at the desire of the customer rather than at the push of the producer? Finally, is demand “leveled” at each stage so that small perturbations are smoothed rather than amplified?
By writing down all the steps as a team, as shown in
Figure 15.1
for the flow of value within the walls of a factory, it’s possible for everyone to see the whole value stream under discussion and to agree on its current level of performance.
The map below shows the flow of information from the customer to the various points in the production process, moving from right to left in the upper half. Orders go from the customer to a Material Requirements Planning computer, where they are held in inventory awaiting the weekly run of the system to devise the production schedule for the following week. A considerable amount of information expediting occurs as floor managers discover shortages or customer demand suddenly changes.
F
IGURE
15.1: C
URRENT
S
TATE
V
ALUE
S
TREAM
M
AP
The map also shows the flow of products from raw materials to customer, moving from left to right in the lower half. It summarizes the performance of the five necessary steps, shows the inventory currently accumulating between them, compares value-creating time (very small) with total throughput time (very large), and helps managers envision the initial flow kaizen
needed to drastically compress the throughput time for the product, eliminate wasted steps, and rectify quality, flexibility, availability, and adequacy problems.
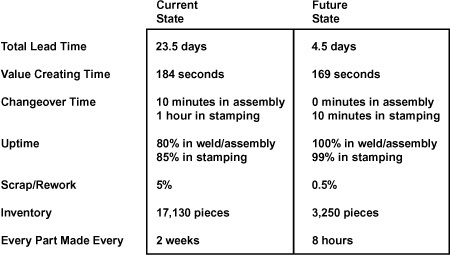
All of this information can be summarized in a box score of Current State performance as shown in
Figure 15.2
.
F
IGURE
15.2: C
URRENT
S
TATE
B
OX
S
CORE
The visioning process facilitated by the map and the box score should lead to a vastly improved Future State, as shown in
Figure 15.3
. Reaching this state requires achieving the “
kaizen
bursts” on the Future State map, which show the necessary points for flow and process
kaizen.
In this case, the specific steps required are to improve the capability (first-time quality), availability (uptime), and flexibility (changeover time) of the four weld and assembly steps and to eliminate the inventories impeding flow by turning the four steps into a cell. (Note that one fewer operator is required as a result.) In addition, setup times of the stamping press are greatly reduced
to permit the production of much smaller batches, further reducing inventories.
F
IGURE
15.3: F
UTURE
S
TATE
V
ALUE
S
TREAM
M
AP
The final step is to disconnect the Material Requirements Planning system previously giving production orders to every step in the process. A simple pull system is put in its place that sends kanban
signals from a heijunka
box (a demand leveling device) at precisely paced intervals to the weld/assembly cell, which is the “pacemaker process” for this value stream. Additional pull loops are installed from the weld/assembly cell to the stamping machine and from the stamping machine to the supplier of steel coils. As a result, the entire process of information management is vastly simplified and transitioned from push to pull.
The implications for performance of this Future State are shown in the expanded box score contrasting the Current State and the Future State in
Figure 15.4
.
The mapping process clearly reveals the potential for a major leap in performance if a relatively small number of flow and process kaizens
can be conducted and then sustained. And this is not the end of the
potential for improvement. As we will show below, in the section on perfecting the value stream, it is always possible to make further progress by designating the Future State, once achieved, as the new Current State and beginning the improvement cycle again.
This brings us to our major concern about value stream mapping. We’ve
found overwhelming acceptance of this tool across the world
4
and we now find many managers with beautiful Current State maps and with equally beautiful Future State maps indicating the potential for major leaps in performance. But, when we take a walk along the value stream, there is no actual Future State. The promised leap in performance has never occurred or has been achieved to only a fraction of the extent possible.
5
F
IGURE
15.4: C
URRENT TO
F
UTURE
S
TATE
B
OX
S
CORE
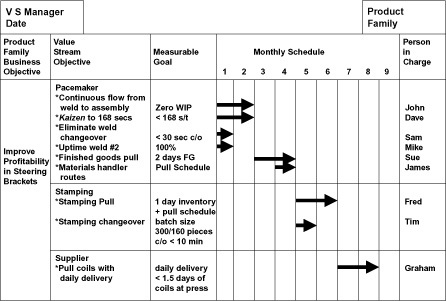
When we see this situation we always ask to see the plan for achieving the Future State, which should look something like
Figure 15.5
, and we ask to meet the individual responsible for managing and improving the value stream. And this is the great problem: usually there is no real plan, or at least no implementable plan, because no one has the responsibility. There is no value stream manager
to perfect the process.
REORGANIZE
YOUR
FIRM BY
PRODUCT
FAMILY AND
VALUE
STREAM
Just as we underestimated the importance of the value stream map, we also failed to grasp the significance of the value stream manager. This is the person who leads the mapping process and takes responsibility for removing the muda
from the value stream for a product, while introducing flow and pull. Instead of describing the role of this critical individual in detail (whom we did mention briefly as the Directly Responsible Individual at Lantech, the Product Team Leaders at Wiremold and Pratt & Whitney, and the Chief Engineer
at Toyota), we concentrated on changing the organization of the firm so that all of the needed skills within functional areas would be directly under this person’s authority.
F
IGURE
15.5: I
MPLEMENTATION
P
LAN
We’ve subsequently found in a number of organizations that to get the attention of self-absorbed functions, it can be helpful to change reporting arrangements and move personnel under a product line manager or team leader, at least for one product generation. We’ve also realized that Toyota and more mature lean firms (now including Lantech) get brilliant results from giving the value stream manager complete responsibility for the value stream and the success of the product but hardly any direct reports or traditional authority.
Instead, the value stream manager develops the vision for the product, determines the Current State of the value stream, and then envisions the Future State. She or he then treats the functions as the suppliers of the essential inputs (for example, engineering, operations, purchasing, sales, lean knowledge) needed to reach this state. If the functions fail to perform, the value stream manager typically goes directly to the CEO, the COO, or the director of the office of value stream managers, to describe the problem, get to the root cause, and install a fix.
Finally, we’ve discovered that these value stream and product line
managers,
like so much in the lean world, are “fractal.” That is, a product line manager overseeing an entire product may work with a number of value stream managers at lower levels taking responsibility for different courses of the value stream. For example, a chief engineer (to use Toyota’s term for a product line manager overseeing an entire automotive platform) works with a development leader in design, a value stream manager in the assembly plant, and value stream managers in each of the component plants working on major items assembled into the finished product. Each manager is essentially doing the same job but with varying scope—wide at the top and narrow at the bottom.
That this approach works for maturing lean firms besides Toyota became apparent to us in talking with Pat Lancaster at the trade show where he launched his new right-sized wrappers (described in
Chapter 14
). We asked how Lantech’s dedicated product teams were functioning and got a quizzical look.
“Actually, we’ve found that the Directly Responsible Individual [the value stream manager] is the critical player in our organization. Once the functional departments got enlightened, we found we no longer needed to change the organization chart and move people onto product teams for each new product family. Instead, the DRI explains to the functions what they need to do as his suppliers to ensure the success of the product. And they do it.”
CREATE A
LEAN
PROMOTION
FUNCTION
In the first edition of Lean Thinking,
we proposed that a lean promotion function be created to house the functional expertise from old-fashioned industrial engineering, quality, and maintenance departments along with the newfound knowledge about flow and pull. Many readers found this suggestion problematic because they could not imagine that experts from a quality background, a total productive maintenance (TPM) background, and a lean (TPS) background could work in harmony.
As time has passed and we have listened to many pointless arguments between
sensei
from TPS, TPM, TQC, and TQM backgrounds, we’ve become even more certain that all of the expert animals in the lean zoo should live in the same cage. That’s because all of these experts—once differing vocabularies
6
and professional rivalries are stripped away—are in pursuit of the same goal: the perfect process.
Each expert would like to create value streams where every step is valuable, every step is capable (the starting point of quality experts), every step is available (the point of origin of maintenance experts), every step is adequate (with neither too much nor too little capacity), and all steps are highly flexible and linked by pull and flow with leveled demand (the starting point of TPS
experts).
And every value stream manager would like to be able to tap a single supplier of the knowledge needed to achieve perfection.
The challenge is to create a dialogue between all the experts so the value stream manager gets consistent, quality advice in a single voice. Only in this way can the rate of improvement can be maximized.
The Lean Promotion Office should be small, except for periods when excess employees from line jobs are being redeployed and put to work on short-term kaizen
projects. It needs only a few experts who are willing to master all of the knowledge and methods needed to create perfect value streams and to teach this knowledge, as necessary, to value stream managers and line employees. And it may get smaller over time.
After all, lean knowledge is most needed early in the transformation when most value stream managers lack critical knowhow and the value streams themselves are choked with muda.
As time goes on, the value stream manager can devote more time to individual product considerations—many of them due to changing markets and customer needs. Less time is needed for identifying Current States and achieving Future States once Current States are already performing at a very high level. (At Toyota the core lean knowledge is located in the Operations Management Consulting Division, but the professional staff totals only about sixty for a global organization with $127 billion in revenues.)
WHEN
YOU’VE
FIXED
SOMETHING
, FIX
IT
AGAIN
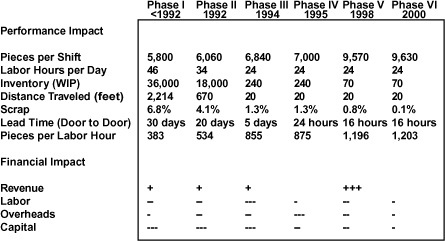
Most managers accept the intellectual proposition that improvement is never finished. Yet we repeatedly visit organizations that make an initial leap to lean and then stop, while talking endlessly about the endless journey. We were therefore delighted recently to revisit Freudenberg-NOK, a firm that had already shown an aptitude for pursuing perfection over an extended period. For example, in
Figure 5.1
(page 91), we presented their progress over a three-year period in a vibration damper product line.
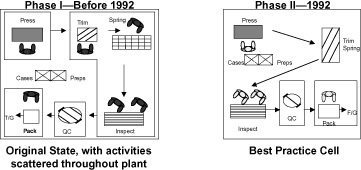
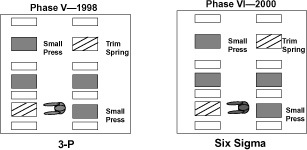
This time we looked at an oil seal product and found a path of steady improvement for a full decade, with no plans to quit. As the diagrams and charts in
Figure 15.6
show, FNGP made the initial leap with this product—from process villages to cells—in 1992. (This is the point at which many firms seem to stop.) They followed up this first step with careful attention to the operation of the cells to create “best practice” and then “model” cells in 1993 and 1994.
7
In 1995 they introduced pull systems throughout the facility to send production instructions to the cells and remove products frequently at a fixed pace. In 1998 they undertook a Production Preparation Process (3-P) for a new product generation. And in 2000 they applied all the tools of Six Sigma to improve the capability of their process to a point where scrap is less than one
tenth of a percent in an industry where no one else is below 1 percent. Perhaps a TPM program to obtain 100 percent equipment availability is
next?
F
IGURE
15.6A: F
REUDENBERG
-NOK
F
IGURE
15.6B: F
REUDENBERG
-NOK
F
IGURE
15.6C: F
REUDENBERG
-NOK
F
IGURE
15.6D: F
REUDENBERG
-NOK
F
IGURE
15.6E: F
REUDENBERG
-NOK S
UMMARY
In any case, the point is clear. It really is possible to continue improvements indefinitely for the same value stream. The question is whether value stream managers (and their top-level superiors) will emphatically demand truly continuous improvements and whether the Lean Promotion Office can continually supply the necessary knowledge.
UTILIZE
POLICY
DEPLOYMENT
In the past few years we’ve had extensive experience with policy deployment in our own research institutes. And it’s the hardest thing we’ve tried to do. Policy deployment forces senior managers to make painful choices about what is really most important for the organization and what is truly achievable. At the same time, policy deployment exposes the contradictions between the plans of every unit of the organization as these affect the other units.
We wish we could say it gets easier. But it doesn’t. Old conflicts will always give way to new in any organization as long as it is growing or faces resource constraints. So the intensity of the policy deployment process seems to be a constant. What’s more, we have found that the process can be led only by the senior executive.
Paradoxically, we have discovered that the actual plans emerging from our policy deployment exercises are only good for about three months, despite our hopes (and our initial expectations) that they would guide our organizations for at least a year. As we reflected on this, we remembered a principle central to lean thinking: A value creation system must be flexible and responsive because forecasts are always wrong.
And we realized that a policy deployment plan is nothing more than an organizational forecast, which future events quickly conspire to prove wrong.
At first we were bewildered but then found that Toyota long ago discovered the same thing. Today Toyota senior managers commonly note that “planning is invaluable but plans are worthless.”
8
Their conclusion is that going through the process forces everyone in the organization to understand the needs and constraints of everyone else and greatly heightens consciousness about the most promising future path even if the specific course of action chosen during the process needs frequent modification
.
CONVINCE
YOUR
SUPPLIERS AND
CUSTOMERS TO
TAKE THE
STEPS
JUST
DESCRIBED
In 1996, we hoped that the participants in the extended value stream—the firms stretching all the way from raw materials to the end consumer—were ready to go down a new path beyond meaningless “partnerships” (always fashionable in good times) and margin squeezing (the hallmark of every recession). However, in the giddy period of the New Economy in the late 1990s most firms seemed to focus instead on new information technologies, notably web-based reverse auctions, which were bound to show very limited results.
Reverse auctions always seemed a dubious prospect to us. Unless the customer and the supplier can learn to remove costly waste from their joint value-creating process, there is an inherent limit on the long-term price savings available to the customer. The maximum saving is the amount of margin the supplier can afford to give away over an extended period while still remaining in business. And this is typically a very small number—only a few percent—because the great bulk of the supplier’s price is determined by real costs resulting from the waste in the value stream.
Recently, as customers and suppliers have found the limits of new IT tools and gone through one more recession-driven round of traditional price squeezing, we have introduced a simple mapping tool that can teach the customer and the supplier to see the whole flow of value. This is the extended value stream map that is the logical complement to the facility-level value stream maps popularized by Mike Rother and John Shook in Learning to See,
which we described above in our discussion of mapping value streams.
The objective of this tool is not to perform costing studies (although it could be adapted to this task), but instead to raise the shared consciousness of every participant along a given value stream about the performance of the whole stream, the causes of waste, and the best approaches to improvements that can make all participants better off.
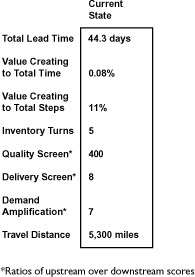
By taking a brief walk together, the participants in a shared value stream can quickly determine the Current State and identify the magnitude and sources of the waste, which then can be turned into benefits. For example, on a value stream walk we recently conducted while preparing our workbook
Seeing the Whole
9
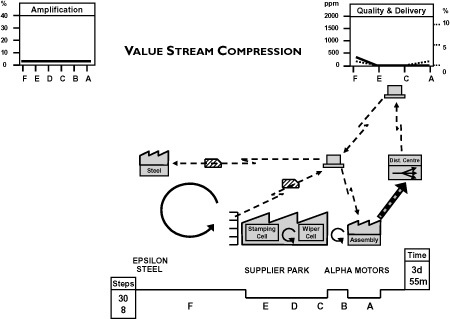
(similar to dozens of others we have conducted over many years), we found that only 8 of the 73 steps performed to physically transform a product (a windshield wiper and arm for an auto manufacturer) created any value for the end customer (the car buyer). And none of the 25 information processing steps actually created any value.
10
Of the total time involved, only 54 minutes out of the 44 days required to produce the finished product actually created value and none of the 58 days elapsing between placement of an order by a customer and its transmission to the most upstream producer were of any value from the standpoint of the customer (see
Figures 15.7
and
15.8
)
.
F
IGURE
15.7: C
URRENT
S
TATE
E
XTENDED
V
ALUE
S
TREAM
M
AP
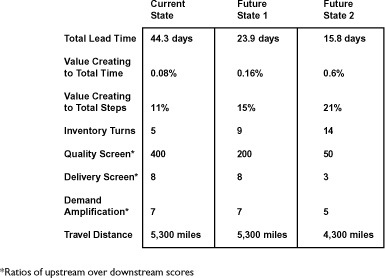
We also found that demand varied only about 3 percent at the customer end of the value stream but gyrated by 40 percent at the most upstream producer (the raw materials supplier). And as we continued our investigation, we found that defects became 7 times more likely and defective shipments to customers 8 times more likely as we walked back up the stream. In consequence, large inventories were present at many points to buffer the system and protect downstream customers from shortages, and large amounts of rework and expediting occurred at every transition from one firm to the next.
We could also see, however, that all of the wasteful steps and time were absolutely necessary because of the configuration of the value stream and the logic of the shared production process. Perhaps most important, no one looking at their stretch of the value stream alone had much hope of seeing the totality of the waste or of reducing it.
On the basis of our walk it was easy to envision a series of future states the participating firms might create that could make every firm better off. For example, simply agreeing to implement the type of Future State shown in
Figure 15.3
within
every plant, to introduce flow and pull, should cut throughput time in half and eliminate 25 percent of the wasted steps.
F
IGURE
15.8: C
URRENT
S
TATE
B
OX
S
CORE
F
IGURE
15.9: C
URRENT TO
F
UTURE
S
TATE
1 B
OX
S
CORE
F
IGURE
15.10: F
UTURE
S
TATE
2 E
XTENDED
V
ALUE
S
TREAM
M
AP
F
IGURE
15.11: C
URRENT AND
F
UTURE
S
TATE
2 B
OX
S
CORE
F
IGURE
15.12: I
DEAL
S
TATE
E
XTENDED
V
ALUE
S
TREAM
M
AP
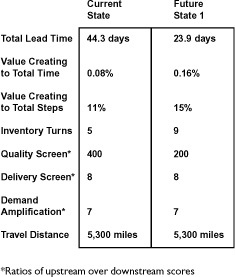
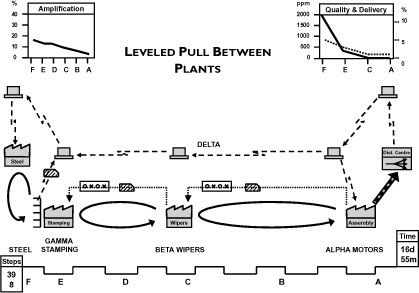
A second Future State (see
Figures 15.10
and
15.11
) could introduce leveled pull with frequent replenishment
between
every firm and facility touching the product. This step could reduce throughput time by another third, eliminate more wasteful steps, and reduce the number of warehouse and cross-dock facilities as well.
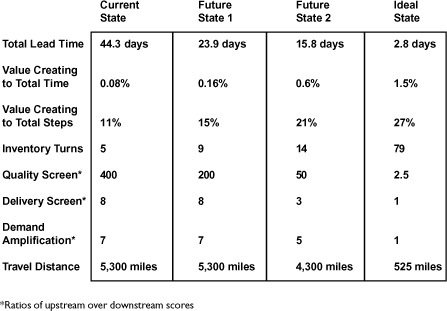
Finally, if every feasible step was taken to eliminate handoffs and transport links between the firms and physical operations on the current generation of product, it might be possible to shrink the total lead time from 44 to 2.8 days, which is to say to within the time the customer is willing to wait for the product. If this could be accomplished, the whole value stream could be converted from make-to-forecast to make-to-order, with large cost savings for every firm (see
Figures 15.12
and
15.13
).
And we can even imagine a succeeding Ideal State employing a new generation of product designs and process technologies, so that the manufacturer could produce completed wipers in a single
molding step. This would eliminate practically all of the remaining steps and effort and permit production to proceed in line sequence to exactly match the production rate and mix of wipers needed by the final assembler across the road.
Few value streams will ever get this far, but the mapping process itself can
at least produce agreement among the value stream partners on the current reality and facilitate achieving one or more future states. If rules can be agreed to on splitting the benefits—and there will probably be no benefits to split if they can’t—this simple mapping process can produce truly meaningful “partnerships” for every value stream, moving a long way toward the Lean Enterprises we described in
Chapter 12
.
F
IGURE
15.13: C
URRENT
S
TATE TO
I
DEAL
S
TATE
B
OX
S
CORE
DEVELOP A
LEAN
GLOBAL
STRATEGY
We’ve been amazed in the years since the launch of Lean Thinking
that many firms in the manufacturing world have continued to pursue mass production logic with respect to production location. They have disaggregated their value streams, seeking to place each processing step with significant labor content in that global location with the lowest wage costs and seemingly locating the processing steps as far apart as possible. The consequence is that many points are optimized but the whole surely is not.
We recently talked with a household name shoe manufacturer that has moved all of its shoe assembly for products sold in North America to Southeast
Asia. This has lowered the labor cost per shoe from the level previously achieved in Mexico, but has also greatly increased the time needed to get products to the customer. The twenty weeks of lead time in the new system effectively make it impossible to reorder during the short selling season of its models. Instead, this firm places all orders with its contract manufacturers on the basis of forecasts and ends up remaindering 40 percent of its shoes in secondary sales channels at very low prices. And this does not count the lost revenues from customers who visited retail stores or the manufacturer’s website and failed to find the models they wanted because they were out of stock.
Similarly, we recently encountered a large components manufacturer that some years ago decided to retain its capital-intensive part fabrication operations in the United States and Canada but moved its labor-intensive assembly operations to northern Mexico. As competitors have duplicated this strategy (moving assembly out of the U.S.) and as Mexican wages have started to rise, the firm is now looking to transfer its assembly operations to China or Vietnam, still shipping parts from the United States. We asked a very simple question: Instead of shipping parts from the U.S. to China and finished products from China to the U.S., with many weeks of cumulative lead time, why not move all of the parts fabrication next to the assembly operation in Mexico so the product can be ordered and shipped within three days to North American customers?
This mass production logic is also applied to the location of engineering. We recently visited the Mexican engineering center of a well known electronics multinational and found a large team of engineers hard at work on a product to be manufactured in Poland for sale in Europe. We immediately had some simple questions: “Don’t any Polish engineers know anything about electricity? We can understand why you [the multinational] have sought out cheaper engineering resources for your relatively mature product, but why not locate the engineers next to the point of production to gain the many benefits of co-location?”
After reflecting on these experiences—which seem to be typical—we’ve developed a very simple way to think about location for producers currently in high-cost areas. Let’s call it lean math.
• Start with the piece part cost of making your product near your current customers in high-wage countries (the U.S., Western Europe, Japan).
• Compare this number with the piece part cost of making the same item at the global point of lowest factor costs, probably dominated by wage costs. (The low-factor cost location will almost always offer a much lower piece part cost.)
• Add the cost of slow freight to get the product to your customer
.
You’ve now done all the math that many purchasing departments seem to perform. Let’s call this mass production math. To get to lean math you need to add some additional costs to piece-part-plus-slow-freight costs to make the calculations more realistic.
• The overhead costs allocated to production in the high-wage location, which usually don’t disappear when production is transferred. Instead, they are reallocated to remaining products, raising their apparent cost.
• The cost of the additional inventory of goods in transit over long distances from the low-wage location to the customer.
• The cost of additional safety stocks to ensure uninterrupted supply.
• The cost of expensive expedited shipments. (You’ll need to be careful here because the plan for the item in question will typically assume that there aren’t any expediting costs, when a bit of casual empiricism will show that there almost always are.)
• The cost of warranty claims if the new facility or supplier has a long learning curve.
• The cost of engineer visits, or resident engineers at the supplier, to get the process right so the product is made to the correct specification with acceptable quality.
• The cost of senior executive visits to set up the operation or to straighten out relationships with managers and suppliers operating in a different business environment. (Note that this may include all manner of payments and considerations, depending on local business practices.)
• The cost of out-of-stocks and lost sales caused by long lead times to obtain the correct specification of the part if demand changes.
• The cost of remaindered goods or of scrapped stocks, ordered to a long-range forecast and never actually needed.
• The potential cost, if you are using a contract manufacturer in the low-cost location, of your supplier soon becoming your competitor.
This is becoming quite a list—and these additional costs are hardly ever visible to the senior executives and purchasing managers who relocate production of an item to a low-wage location based simply on piece-part price plus slow freight. Lean math requires adding three more costs to be complete:
• Currency risks, which can strike quite suddenly when the currency of either the supplying or receiving country shifts.
• Country risks, which can also emerge very suddenly when the shipping country encounters political instabilities or when there is a political reaction in the receiving country as trade deficits and unemployment emerge as political issues
.
• Connectivity costs of many sorts in managing product handoffs and information flows in highly complex supply chains across long distances in countries with different business practices.
These latter costs are harder to estimate but are sometimes very large. The only thing a manager can know for sure is that they are very low or zero if products are sourced close to the customer rather than across the globe.
What does lean math usually say about location? We’ve found that most products fit into one of three categories:
• For products where rapid customer response can substantially raise sales and selling prices (probably including the higher-end shoes produced by the firm just mentioned), work hard to conduct every step of the production process as near the customer as possible. In many cases, the full application of lean techniques to production steps that are located immediately adjacent—a process we call value stream compression—can produce an acceptable combination of higher revenues and lower costs in a high labor-cost location.
• For products that are more price-sensitive but where rapid customer response is still important, co-locate all steps in the design and production process—that is, compress the value stream including engineering—at a low labor-cost site within the region of sale. For the U.S. and Canada, this will usually be Mexico; for Western Europe it will be Eastern Europe. By using trucks, which are fast and cheap, rather than boats, which are cheap but slow and often require fast but expensive airfreight backup to deal with inaccurate forecasts, it is still possible to replenish products in two or three days as they are sold or consumed rather than waiting weeks or maintaining large just-incase stocks near the customer. Remember: lean thinkers love trucks (when transport is needed at all), but they try to eliminate boats and planes!
• Finally, for commoditized products that have a fairly high value to weight ratio and where demand can actually be forecast due to stable sales over the long term, co-locate all production steps at the lowest labor-cost point, even outside the region of sale. (The best approach is to compress the value stream to conduct as many steps as possible, including engineering, at the low cost point, requiring only a single transport link to move the finished item from the point of design and manufacture to the market of sale.)
Even when these conditions are met, bear in mind currency risks (because shifts are often quite rapid), country risks (of trade protection in the receiving country and political chaos in the shipping country), and the connectivity costs (ranging from air freight expediting to unplanned engineer visits to the other side of the world to deal with quality issues) that are inherent in managing decompressed value streams. It’s our belief that when all these factors are weighed, this third category is much smaller than most managers currently think
.
CONVERT FROM
TOP
-DOWN
LEADERSHIP TO
BOTTOM
-UP
INITIATIVES
As we’ve gained experience in recent years, we’ve become ever more aware that in a truly mature lean business there is a transition from Policy Deployment to Policy Management.
11
This happens when there are value stream managers for every value stream and employees across the enterprise have learned to see. As a result, ideas for further improvements in every value stream continually bubble up to senior management, which needs only reconcile conflicts and make sober judgments on just how many improvement initiatives can be supported at one time.
This happy situation was brought home to us in a conversation with a senior manager at Toyota, in talking about the current state of affairs in the motor industry. He noted that Toyota at this point in its development obtains brilliant results from average managers utilizing brilliant processes, while its competitors often obtain mediocre (or worse) results from brilliant managers utilizing broken processes.
The natural instinct in this situation is to find more brilliant managers; many American firms went down during the bubble economy with only brilliant hands on deck. The correct response is to perfect the process—the value stream—for every value-creating activity and then rejoice in the fact that average people—and this group, if we are honest, includes most of us most of the time—can get brilliant results and get them consistently. A few brilliant process thinkers are still needed, perhaps housed in the Lean Promotion Office, to tackle the most difficult problems in perfecting every process as average managers bring these issues to senior management’s attention as part of Policy Management.
The Opportunity Now at Hand
As we’ve noted at a number of points, recessions are precious things because they shake conventional wisdom, even complacent lean wisdom, and motivate mangers to make hard choices. The current era is no exception. We are currently at the point of greatest opportunity during the boom-bust-boom cycle that still plagues market economies. This is because unnecessary investments (and investments in the wrong place) can still be avoided as the economy begins to expand from the trough while the dispiriting job losses of the down cycle are past. But the window of opportunity stays open for only a limited period before tradition reasserts itself and false confidence in a firm’s processes sets in.
The stories in this book are those of firms who were forced to look in the mirror during the recession of 1991 and who found a new and better way of
living as lean thinkers during the 1990s. As we’ve seen in this epilogue, they not only did well during the boom but have also prospered in the ensuing recession. The question now is which firms will seize the opportunities of the recession of 2001–03 to become the next wave of lean thinkers pushing the whole economy ahead.
We have all the necessary knowledge. Indeed, we know much more about the lean transformation than we did in the early 1990s. There is, therefore, no excuse for failing to act in this golden moment for lean thinkers.