CHAPTER 13
A Bottom‐Up Approach to Assessing Sovereign Default Risk*
In our list of Applications of Distressed Prediction models in Chapter 10 and 11, for example, Figure 11.1, we noted extending micro‐oriented corporate models to the sovereign risk arena. This chapter now goes into greater depth on that theme. In the past decade, bank executives, government officials, and many others have been sharply criticized for failing to anticipate the global financial crisis. The speed and depth of the market declines shocked the public. And no one seemed more surprised than the credit rating agencies that assess the default risk of sovereign governments, as well as corporate issuers operating within their borders.
Although the developed world had suffered numerous recessions in the past 150 years, this most recent international crisis in the wake of the mortgage‐backed security downfall in 2008–2009, raised grave doubts about the ability of major banks and even sovereign governments to honor their obligations. Several large financial institutions in the United States and Europe required massive state assistance to remain solvent, and venerable banks like Lehman Brothers even went bankrupt. The cost to the United States and other sovereign governments of rescuing financial institutions believed to pose “systemic” risk was so great as to result in a dramatic increase in their own borrowings. The general public in the United States and Europe found these events particularly troubling because they had assumed that elected officials and regulators were well‐informed about financial risks and capable of limiting serious threats to their investments, savings, and pensions.
High‐ranking officials, central bankers, financial regulators, ratings agencies, and senior bank executives all seemed to fail to sense the looming financial danger. This failure seemed even more puzzling because it occurred years after the widespread adoption of advanced risk management tools. Banks and portfolio managers had long been using quantitative risk management tools such as value at risk (VaR). And they should also have benefited from the additional information about credit risk made publicly available by the market for credit default swaps (CDSs). Instead, these mechanisms were cited by many as adding to the depths of the crisis.
But, as financial market observers have pointed out, VaR calculations are no more reliable than the assumptions underlying them. Although such assumptions tend to be informed by statistical histories, critical variables such as price volatilities and correlations are far from constant and thus difficult to capture in a model. The market prices of options – or of CDS contracts, which have options “embedded” within them – can provide useful market estimates of volatility and risk. And economists have found that CDS prices on certain kinds of debt securities increase substantially before financial crises become full‐blown. But because there is so little time between the sharp increase in CDS prices and the subsequent crisis, policy makers and financial managers typically have little opportunity to change course.1
Most popular tools for assessing sovereign risk are effectively forms of top‐down analysis. For example, in evaluating particular sovereigns, most academic and professional analysts use macroeconomic indicators such as GDP growth, national debt‐to‐GDP ratios, deficits to GDP, and trade deficits, and so on, as gauges of a country's economic strength and well‐being. But, as the recent Euro debt crisis has made clear, such macro approaches, although useful in some settings and circumstances, have clear limitations.
In this chapter, we present a totally new method for assessing sovereign risk, a type of bottom‐up approach that focuses on the financial condition of an economy's private sector. The assumption underlying this approach is that the fundamental source of national wealth, and of the financial health of sovereigns, is the economic output and productivity of their corporate entities. To the extent we are correct, such an approach could provide financial professionals and policy makers with a more effective means of anticipating financial trouble, thereby enabling them to understand the sources of problems before they become unmanageable.
In the pages that follow, we present Z‐Metrics™, as a practical and effective tool for estimating sovereign risk. Developed in collaboration with the Risk Metrics Group, now a subsidiary of MSCI, Inc., Z‐Metrics is a logical extension of the Altman Z‐Score technique that was introduced in 1968 and has since achieved considerable scholarly and commercial success (see Chapter 10 herein). Of course, no method is infallible, or represents the best fit for all circumstances. But by focusing on the financial health of private enterprises in different countries, our system promises at the very least to provide a valuable complement to, or reality check on, standard macro approaches. Before we delve into the details of Z‐Metrics, we start by briefly reviewing the record of financial crises to provide some historical perspective. Next we attempt to summarize the main findings of the extensive academic and practitioner literature on sovereign risk, particularly those studies designed to test the predictability of sovereign defaults and crises.
With that as background, we then present our Z‐Metrics system for estimating the probability of default for individual (nonfinancial) companies and show how that system might have been used to anticipate many developments during the recent EU debt crisis. In so doing, analyze the publicly available corporate data from 2008–2015 for nine European countries, both to illustrate our model's promise for assessing sovereign risk and to identify the scope of reforms that troubled governments must consider not only to qualify for bailouts and subsidies from other countries and international bodies, but to stimulate growth in their economies.
More specifically, we examine the effectiveness of calculating the median company five‐year probability of default of the sovereign's nonfinancial corporate sector, both as an absolute measure of corporate risk vulnerability and a relative health index comparison among a number of European sovereigns, and including the United States as well. Our analysis shows that this health index, measured at periods prior to the explicit recognition of the crisis by market professionals, not only gave a distinct early warning of impending sovereign default in some cases, but also provided a sensible hierarchy of relative sovereign risk. We also show that, during the recent European crisis, our measures not only compared favorably to standard sovereign risk measures, notably rating agency credit ratings, but performed well even when compared to the implied default rates built into market pricing indicators such as CDS spreads, while avoiding the well‐known volatility of the latter.
Our aim here is not to present a “beauty contest” of different methods for assessing sovereign risk in which one method emerges as the clear winner. What we are suggesting is that a novel, bottom‐up approach that emphasizes the financial condition and profitability of a nation's private sector can be effectively combined with standard analytical techniques and market pricing to better understand and predict sovereign health. And our analysis has one clear implication for policy makers: that the reforms for assisting ailing nations should be designed, as far as possible, to preserve the efficiency and value of a nation's private enterprises.
Modern History Sovereign Crises
When thinking about the most recent financial crisis, it is important to keep in mind how common sovereign debt crises have been during the past 150 years – and how frequently such debacles have afflicted developed economies as well as emerging market countries. Figure 13.1 shows a partial list of financial crises (identified by the first year of the crisis) that have occurred in “advanced” countries. Overall, Latin America seems to have had more recent bond and loan defaults than any other region of the world. But if we had included a number of now developed Asian countries among the “advanced” countries, the period 1997–1999 would be much more prominent.
| Austria | 1893, | 1989 | |||||||
| Brazil | 1898, | 1902, | 1914, | 1931, | 1939 | ||||
| Canada | 1873, | 1906, | 1923, | 1983 | |||||
| Czechoslovakia | 1870, | 1910, | 1931, | 2008 | |||||
| China | 1921, | 1939 | |||||||
| Denmark | 1877, | 1885, | 1902, | 1907, | 1921, | 1931, | 1987 | ||
| DEU | 1880, | 1891, | 1901, | 1931, | 2008 | ||||
| GBR | 1890, | 1974, | 1984, | 1991, | 2007 | ||||
| Greece | 1870, | 1894, | 1932, | 2009 | |||||
| Italy | 1887, | 1891, | 1907, | 1931, | 1930, | 1935, | 1990 | ||
| Japan | 1942 | ||||||||
| Netherlands | 1897, | 1921, | 1939 | ||||||
| Norway | 1899, | 1921, | 1931, | 1988 | |||||
| Russia | 1918, | 1998 | |||||||
| Spain | 1920, | 1924, | 1931, | 1978, | 2008 | ||||
| Sweden | 1876, | 1897, | 1907, | 1922, | 1931, | 1991 | |||
| United States | 1873, | 1884, | 1893, | 1907, | 1929, | 1984, | 2008 |
FIGURE 13.1 Financial Crises, Advanced Countries 1870–2010 Crisis Events (First Year)
Source: IMF Global Financial Stability Reports (www.imf.org), Reinhart and Rogoff (2010), and various other sources, such as S&P's economic reports.
The clear lesson is that sovereign economic conditions appear to spiral out of control with almost predictable regularity and then require massive debt restructurings and/or bailouts accompanied by painful austerity programs. Recent examples include several Latin American countries in the 1980s, Southeast and East Asian nations in the late 1990s, Russia in 1998, and Argentina in 2000. In most of those cases, major problems originating in individual countries not only imposed hardships on their own people and markets, but had major financial consequences well beyond their borders. We saw such effects recently as financial problems in Greece and other southern European countries not only affected their neighbors, but threatened the very existence of the European Union.
Such financial crises have generally come as a surprise to most people, including even those specialists charged with rating the default risk of sovereigns and the enterprises operating in these suddenly threatened nations. For example, it was not long ago that Greek debt was investment grade, and Spain was rated Aaa as recently as June 2010.2 And this pattern has been seen many times before. To cite just one more case, South Korea was viewed in 1996 as an “Asian Tiger” with a decade‐long record of remarkable growth and an AA– rating. Within a year however, the country was downgraded to BB–, a “junk” rating, and the county's government avoided default only through a $50 billion bailout by the IMF. And it was not just the rating agencies that were fooled; most of the economists at the brokerage houses and bond insurance companies also failed to see the problems looming in Korea.
What Do We Know about Predicting Sovereign Defaults?
There is a large and growing body of studies on the default probability of sovereigns, by practitioners as well as by academics.3 A large number of studies, starting with Frank and Cline's 1971 classic, have attempted to predict sovereign defaults or rescheduling using statistical classification and predicting methods like discriminant analysis, as well as similar econometric techniques.4 And in a more recent development, some credit analysts have begun using the “contingent claim” approach5 to measure, analyze, and manage sovereign risk based on Robert Merton's classic “structural” approach (1974). But because of its heavy reliance on market indicators, this approach to predicting sovereign risk and credit spreads has the drawback of producing large – and potentially self‐fulfilling – swings in assessed risk that are attributable solely to market volatility.
A number of recent studies have sought to identify global or regional common risk factors that largely determine the level of sovereign risk in the world, or in a region such as Europe. Some studies have shown that changes in both the risk factor of individual sovereigns and in a common time‐varying global factor affect the market's repricing of sovereign risk.6 Other studies, however, suggest that sovereign credit spreads are more related to global aggregate market indexes, including U.S. stock and high‐yield bond market indexes, and global capital flows than to their own local economic measures.7 Such evidence has been used to justify an approach to quantifying sovereign risk that uses the local stock market index as a proxy for the equity value of the country.8 Finally, several very recent papers focus on the importance of macro variables such as debt service relative to tax receipts and the volatility of trade deficits in explaining sovereign risk premiums and spreads.9
A number of studies have also attempted to evaluate the effectiveness of published credit ratings in predicting defaults and expected losses, with most concluding that sovereign ratings, especially in emerging markets, provide an improved understanding of country risks for investment analytics.10 Nevertheless, the recent EU debt crisis would appear to contradict such findings by taking place at a time when all the rating agencies and, it would seem, all available models for estimating sovereign risk indicated that Greece and Spain were still classified as investment grade.11 What's more, although most all of the studies cited above have been fairly optimistic about the ability of their concepts to provide early warnings of major financial problems, their findings have either been ignored or have proven ineffective in forecasting most economic and financial crises.
In addition to these studies, a handful or researchers have taken a somewhat different bottom‐up approach by emphasizing the health of the private sectors supporting the sovereigns. For example, a 1998 World Bank study of the 1997 East Asian crisis by Pomerleano (1998)12 used our average Z‐Score of listed (nonfinancial) companies to assess the “financial fragility” of eight Asian countries and, for comparison purposes, three developed countries and Latin America. Surprising many observers, the average Z‐Score for South Korea at the end of 1996 suggested that it was the most financially vulnerable Asian country, followed by Thailand, Japan, and Indonesia. A traditional macroeconomic measure like GDP growth would not have predicted such trouble since, at the end of 1996, South Korea had been growing at double‐digit rates for nearly a decade.13
The Z‐Metrics™ Approach14
In 2009, we partnered with RiskMetrics Group with the aim, at least initially, of creating a new and better way of assessing the credit risk of companies. The result was our new Z‐Metrics approach. This methodology might be called a new generation of the original Z‐Score model of 1968. Our objective was to develop up‐to‐date credit scoring and probability of default metrics for both large and small, public and private, enterprises on a global basis.
In building our models, we used multivariate logistic regressions and data from a large sample of both public and private U.S. and Canadian nonfinancial sector companies during the 20‐year period 1989–2008.15 We analyzed over 50 fundamental financial statement variables, including measures (with trends as well as point estimates) of solvency, leverage, size, profitability, interest coverage, liquidity, asset quality, investment, dividend payout, and financing results. In addition to such operating (or “fundamental”) variables, we also included equity market price and return variables and their patterns of volatility. Such market variables have typically been used in the “structural distance‐to‐default measures” that are at the core of the KMV model16 now owned by Moody's (see Crosbie and Bohn 2002 for Moody's documentation).
In addition to these firm‐specific variables, we also tested a number of macroeconomic variables that are often used to estimate sovereign default probabilities, including GDP growth, unemployment, credit spreads, and inflation. Since most companies have a higher probability of default during periods of economic stress – for example, at the end of 2008 – we wanted to use such macro variables to capture the heightened or lower probabilities associated with general economic conditions.17
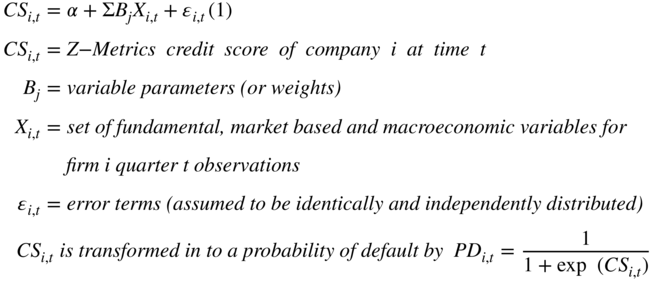
The final model, which consists of 10 fundamental, market value, and macroeconomic variables, is used to produce a credit score for each public company. Although our primary emphasis was on applying Z‐Metrics to publicly traded companies, we also created a private firm model by using data from public companies and replacing market value with book value of equity. The next step was to use a logit specification of the model (described in the Appendix) that we used to convert the credit scores into probabilities of default (PDs) over both one‐year and five‐year horizons. The one‐year model is based on data from financial statements and market data approximately one year prior to the credit event, and the five‐year model includes up to five annual financial statements prior to the event.
To test the predictive power of the model and the resulting PDs, we segregated all the companies in our sample into “cohorts” according to whether they experience “credit events” that include either formal default or bankruptcy (whichever comes first). All companies that experienced a credit event within either one year or five years were assigned to the “distressed” or “credit event” group (with all others assigned to the nondistressed group).
Our test results show considerable success in predicting defaults across the entire credit spectrum from the lowest to the highest default risk categories. Where possible, we compared our output with that of publicly available credit ratings and existing models. The so‐called “accuracy ratio” measures how well our model predicts which companies do or do not go bankrupt on the basis of data available before bankruptcy. The objective can be framed in two ways: (1) maximizing correct predictions of defaulting and nondefaulting companies and (2) minimizing wrong predictions (Type II accuracy).
As can be seen in Figure 13.2, our results, which include tests on actual defaults during the period 1989–2009, show much higher Type I accuracy levels for the Z‐Metrics model than for either the bond rating agencies or established models (including an older version of Z‐Scores). At the same time, our tests show equivalent Type II accuracies at all cutoff levels of scores.18
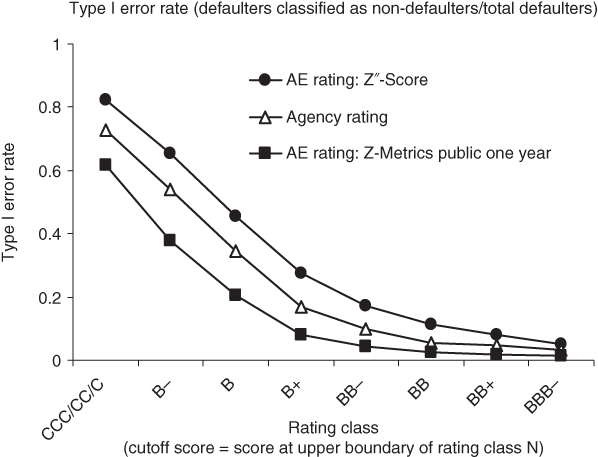
FIGURE 13.2 Type I Error for Agency Ratings, Z″‐score, and Z‐Metrics Agency Equivalent (AE Ratings (1989–2008): One‐Year Prediction Horizon for Publicly Owned Firms
Perhaps the most reliable test of credit scoring models is how well they predict critical events based on samples of companies that were not used to build the model, particularly if the events took place after the period during which the model was built (after 2008, in this case). With that in mind, we tested the model against actual bankruptcies occurring in 2009, or what we refer to as our “out‐of‐sample” data. As with the full test sample results shown in Figure 13.2, our Z‐Metrics results for the “out of sample” bankruptcies of 2009 outperformed the agency ratings and the 1968 Z‐Score and 1995 Z″‐Score models using both one‐year and five‐year horizons.
A “Bottom‐Up” Approach for Sovereign Risk Assessment
Having established the predictive power of our updated Z‐Score methodology, our next step was to use that model (which, again, was created using large publicly traded U.S. companies) to evaluate the default risk of European companies. And after assuring ourselves that the model was transferable in that sense, we then attempted to assess the overall creditworthiness of sovereign governments by aggregating our Z‐Metrics default probabilities for individual companies and then estimating both a median default probability and credit rating for different countries.
In conducting this experiment, we examined nine key European countries over three time periods, end of 2008, 2009, and 2010 (Figure 13.3) and again in 2015 (Figure 13.4), when the crisis was well known. People clearly recognized the crisis and concern for the viability of the European Union in June 2010, when Greece's debt was downgraded to noninvestment grade and both Spain and Portugal were also downgraded. Credit markets, particularly CDS markets, had already recognized the Greek and Irish problems before June 2010. Market prices during the first half of 2010 reflected high implied probabilities of default for Greece and Ireland, but were considerably less pessimistic in 2009. By contrast, we display the Z‐Metric median PD estimates alongside sovereign CDS spreads over both periods.19 Our PD estimates were uniformly higher (more risky) in 2009 than early in 2010, even if the world was more focused on Europe's problems in the latter year. In this sense, our Z‐metrics PD might be viewed as providing a leading indicator of possible distress. It should be noted that the statistics in Figures 13.3 and 13.4 report only on the nonfinancial private sector, while those in Figure 13.6, to be discussed, include results from our banking credit risk model, as well.
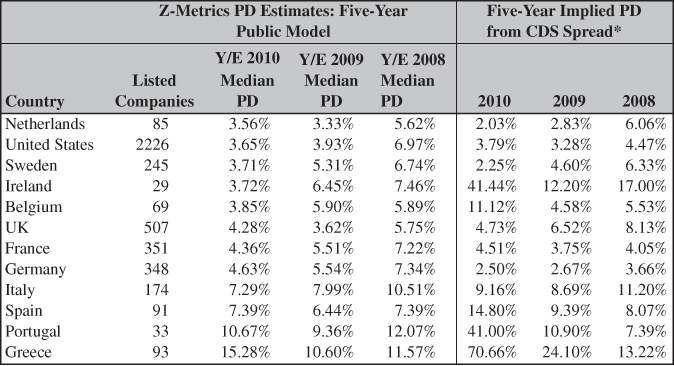
* Assuming a 40% recovery rate (R); based on the median CDS spread (s). PD computed as 1 – e(–5*s/(1–R)).
FIGURE 13.3 Financial Health of the Corporate, Nonfinancial Sector: Selected European Countries and United States in 2008–2010
Sources: RiskMetrics Group (MSCI), Markit, Compustat.
* Since the Z‐Metrics Model is not practically available for most analysts, we could substitute the Z″‐Score method (available from <altmanZscoreplus.com>).
** Sales > € 50mm.
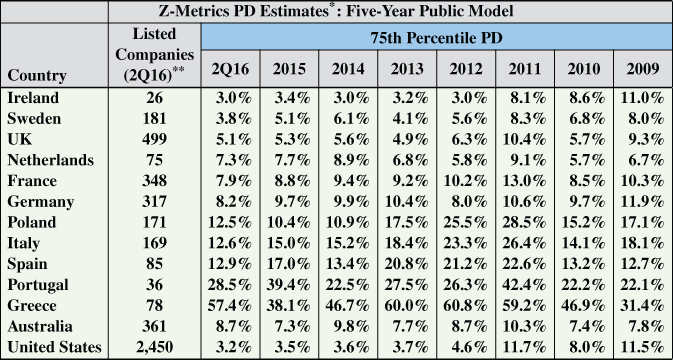
FIGURE 13.4 Financial Health of the Corporate, Nonfinancial Sector: Selected European Countries and Australia/United States in 2008–2Q16
Sources: RiskMetrics Group (MSCI), Markit, Compustat Global.
As of year‐end 2009, our Z‐Metrics' five‐year PDs for European corporate default risk placed Greece (10.60%) and Portugal (9.36%) in the highest risk categories (ZC‐ratings), followed by Italy (7.99%), Ireland (6.45%), and Spain (6.44%), all in the ZC category. Then came Germany and France (both about 5.5% – ZC+), with the UK (3.62%) and the Netherlands (3.33%) at the lowest risk levels (ZB– and ZB). The United States looked comparatively strong, at 3.93% (ZB–).
For the most part, these results are consistent with how traditional analysts ranked sovereign risks. Nevertheless, there were a few surprises. The UK had a fairly healthy private sector, and Germany and France were perhaps not as healthy as one might have thought. The UK's relatively strong showing might have resulted from the fact that our risk measure at this time did not include financial sector firms, which comprised about 35% of the market values of listed UK corporates and were in poor financial condition. And several very large, healthy multinational entities in the UK index might have skewed results a bit. The CDS/five‐year market's assessment of UK risk was harsher than that of our Z‐Metrics index in 2010, with the median of the daily CDS spreads during the first four months implying a 6.52% probability of default, about double our Z‐Metrics median level. Greece also had a much higher CDS implied PD at 24.10%, as compared to 10.60% for Z‐Metrics. (And, of course, our choice of the median Z‐Metrics PD is arbitrary, implying as it does that fully 50% of the listed companies have PDs higher than 10.60%.)
We also observed that several countries had relatively high standard deviations of Z‐Metrics PDs, indicating a longer tail of very risky companies. These countries included Ireland, Greece and, surprisingly, Germany, based on 2010 data. So, while almost everyone considers Germany to be the benchmark‐low risk country in Europe – for example, its five‐year CDS spread was just 2.67% in 2010, even lower than the Netherlands (2.83%), we are more cautious based on our broad measure of private sector corporate health.
2010 Results and the 75th Percentile Firm as a Measure of Sovereign Default Risk
Figure 13.3 shows the weighted‐average median PDs for 11 (including now Sweden and Belgium) European countries and the United States as of the end of 2010. The results show the large difference between Greece (15.28%) and all the rest, but also that the “big‐five PIIGS” stand out as the clear higher risk domains. Indeed, we felt that Italy could have been considered the “fulcrum” country to decide the ultimate fate of the Euro (see Altman's “Insight” article in the Financial Times, June 21, 2011).
Figure 13.4 shows our results through 2016 for the 75th percentile firm in each country. We find that the 75th percentile firm is our best estimate of the sovereign's risk of default and can be compared to the implied PD from the market, via the CDS premium (Figure 13.5).
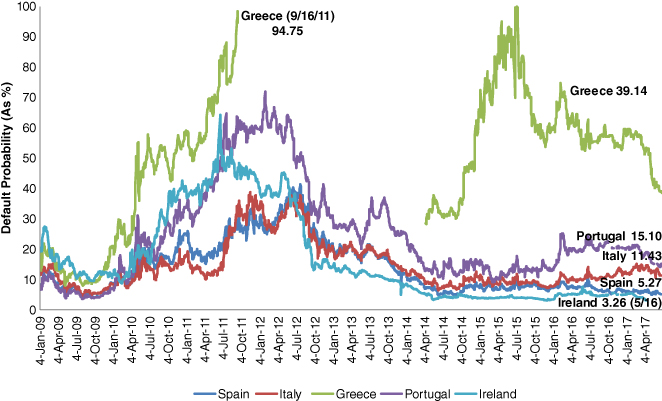
FIGURE 13.5 Five‐Year Implied Probabilities of Default (PD) from Capital Market CDS Spreads,* January 2009–June 2017
* Assuming a 40% recovery rate (R); based on the median CDS spread (s). PD computed as 1 – e(–5*s/(1–R)).
Source: Author's calculations.
CDS Implied PDs
Figure 13.5 shows the implied PDs for the “Big‐Five” European high‐risk countries from the start of 2009 to the end of 2017. Note that while the PDs, based on CDS spreads and assuming a 40% recovery rate, all came down from their highs, all still implied a considerable default risk until 2016. Indeed, as of mid‐January 2012, the Greek CDS implied probability of default increased to almost 95%, and Italy, the subject of our fulcrum risk country “Insight” piece, increased from 19% in July 2011 to 35% in January 2012. As noted, Greece actually did default later in 2012.
2010 versus 2009
As noted earlier from Figure 13.4, our PD estimates for early 2009 were uniformly higher (more risky) than those for early 2010. One important reason for the higher PDs in 2009 is the significant impact of the stock market, which is a powerful variable in the Z‐Metrics model – and in many other default probability models (notably, Moody's KMV, see Crosbie and Bohn, 2002). Recall that the stock markets were at very low levels at the end of 2008 and into the early months of 2009, while there was a major recovery later in 2009 and in early 2010.
A Model That Includes the Financial Sector
A valid question about a “micro‐bottom‐up” approach to sovereign risk assessment is the importance of the financial sector. We are hesitant to include early‐warning indicators of banks, for example, due to the relatively poor track record (in our opinion) of banking predictive models. Still, it is worth trying, and in Figure 13.6, we introduce the results of a preliminary model (Altman, Cziel, and Rijken 2016) based on a number of fundamental banking variables for defaulting and nondefaulting U.S. banks, then applied to European banking entities. This model is, admittedly, a work‐in‐process.
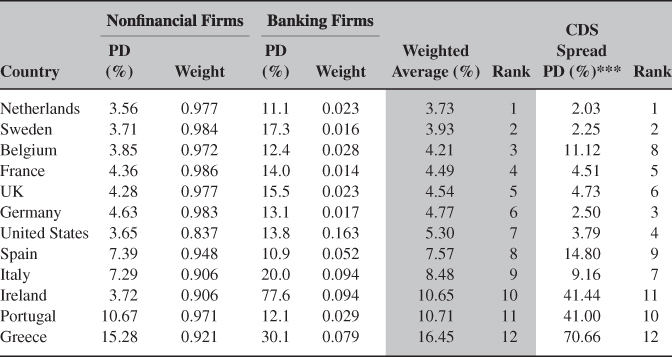
* Based on the Z‐Metrics Probability Model.
** Based on Altman‐Cziel‐Rijken Model (Preliminary).
*** PD based on the CDS Spread as of April 26, 2011.
FIGURE 13.6 Weighted Average Median Five‐Year (PD) for Listed Nonfinancial* and Banking Firms** (Europe and United States), 2010
Based on 2010 results, the weighted‐average median default probability for Greece increased to 16.45, from 15.28%, based only on the nonfinancial sector. At that time, the CDS spread indicated a 70.66% five‐year default probability.
Comparing PD Results Based on Privately Owned versus Publicly Owned Firm Models
As shown in Figures 13.3 and 13.4, the improvement (reduction) in Z‐Metrics PDs for most countries in 2010 – a period in which most EU sovereigns appeared to be getting riskier – looks attributable in large part to the stock market increases in almost all countries. But to the extent such increases could conceal a deterioration of a sovereign's credit condition, some credit analysts might prefer to have PD estimates that do not make use of stock market data.
With this in mind, we applied our private firm Z‐Metrics model to evaluate the same nine European countries and the United States. The private and public firm models are the same except for the substitution of equity book values (and volatility of book values) for market values. Note, we did the same adjustment for our original Z‐Score model. This adjustment is expected to remove the capital market influence from our credit risk measure.
Correlation of Sovereign PDs: Recent Evidence on Z‐Metrics versus Implied CDS PDs
As a final test of the predictive power of our approach, we compared our Z‐Metrics five‐year median PDs for our sample of nine European countries (both on a contemporary basis and for 2009) with the PDs implied by CDS spreads in 2010. The contemporary PD correlation during the first third of 2010 was remarkably high, with an R2 of 0.82. This was a period when it was becoming quite evident that certain European countries were in serious financial trouble and the likelihood of default was not trivial. But if we go back to the first half of 2009, the correlation drops to an R2 of 0.36 (although it would be considerably higher, at 0.62, if we excluded the case of Ireland). Ireland's CDS implied PD was considerably higher in 2009 than 2010 (17.0% versus 12.0%), while the Z‐Metrics PD was relatively stable in the two years (7.5% and 6.5% respectively).20 In 2010, whether we calculate the correlation with or without Ireland, the results are essentially the same (0.82 and 0.83). Incidentally, it is remarkable that the PDs for Ireland from our bottom‐up approach showed impressive strength, that is, low PDs, throughout the entire time series from 2009 to 2017, despite its need for a bailout solely due to the financial sector. Indeed, our results are consistent with a “buy” strategy once the financial sector's rescue was in place.
Given the predictive success of Z‐metrics in the tests already described, we were curious to find out whether it could be used to predict capital market (i.e., CDS) prices. So, we regressed our public firm model's 2008 Z‐Metrics median, nonfinancial sector PDs against implied CDS PDs one year later in 2009. Admittedly, this sample was quite small (10 countries) and the analysis is for only a single time‐series comparison (2008 vs. 2009). Nevertheless, these two years spanned a crucial and highly visible sovereign debt crisis, whereas the PDs implied by prior years' Z‐Metrics and CDS showed remarkably little volatility.21
Figure 13.7 summarizes the results of our public versus private firm Z‐Metrics models comparative PD (delta) results for 2010 and 2009. For eight of the 10 countries, use of the private firm model showed smaller reductions in PDs when moving from 2009 to 2010 than use of the public model. Whereas the overall average improvement in PDs for the public firm model was a drop of 1.91 percentage points, the drop was 0.79% for our private firm model. These results are largely the effect of the positive stock market performance in late 2009 and into 2010. But improvements in general macro conditions, along with their effects on traditional corporate performance measures, also helped improve (reduce) the PDs. Moreover, in two of these eight countries – the UK and France – not only did the public firm model show an improved (lower) PD, but the private firm model's PD actually got worse (increased) in 2010 (as indicated by the positive delta in the last column of Figure 13.7).
| Number Listed Companies | Public‐Firm Z‐Metrics Model | Private‐Firm Z‐Metrics Model | ||||||
| PDs | PDs | PDs | PDs | |||||
| Country | 2010 | 2009 | 2010 | 2009 | Delta* | 2010 | 2009 | Delta* |
| Netherlands | 61 | 60 | 3.33% | 5.62% | –2.29% | 5.25% | 6.00% | –0.75% |
| UK | 442 | 433 | 3.62% | 5.75% | –2.13% | 6.48% | 5.97% | +0.49% |
| United States | 2226 | 2171 | 3.93% | 6.97% | –3.04% | 4.28% | 4.80% | –0.52% |
| France | 297 | 294 | 5.51% | 7.22% | –1.71% | 7.33% | 7.19% | +0.14% |
| Germany | 289 | 286 | 5.54% | 7.34% | –1.80% | 6.29% | 7.56% | –1.27% |
| Spain | 82 | 78 | 6.44% | 7.39% | –0.95% | 8.06% | 9.32% | –1.26% |
| Ireland | 28 | 26 | 6.45% | 7.46% | –1.01% | 6.31% | 6.36% | –0.05% |
| Italy | 155 | 154 | 7.99% | 10.51% | –2.52% | 8.14% | 9.07% | –0.89% |
| Portugal | 30 | 30 | 9.36% | 12.07% | –2.71% | 8.73% | 9.62% | –0.89% |
| Greece | 79 | 77 | 10.60% | 11.57% | –0.97% | 11.03% | 13.93% | –2.90% |
| Average | 6.28% | 8.19% | –1.91% | 7.19% | 7.98% | –0.79% | ||
* Negative sign means improved credit risk.
FIGURE 13.7 Private versus Public Firm Model PDs in 2010 and 2099
The correlation between our Z‐Metrics PDs and those implied by the CDS one year later proved to be remarkably strong, with an r of 0.69 and an R2 of 0.48 (Figure 13.8). In sum, the corporate health index for our European countries (plus the United States) in 2008 explained roughly half of the variation in the CDS results one year later.22 More tests need to be run for us to be even more confident of the results.
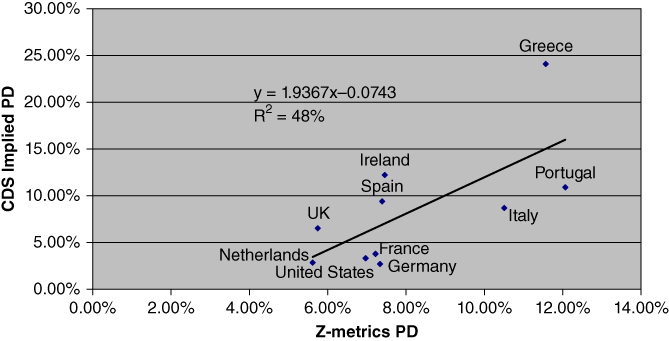
FIGURE 13.8 2008 Z‐Metrics PD vs 2009 CDS Implied PD
Source: Data from Figures 13.3 and 13.5.
A potential shortcoming of our approach is that we are limited in our private sector corporate health assessments to data from listed, publicly held firms. This is especially true for relatively small countries like Ireland (with just 28 listed companies), Portugal (with 30), Greece (79), Netherlands (61), and Spain (82). Since the private, nonlisted segment is much larger in all of the countries, we are not clearly assessing the health of the vast majority of its firms and our sovereign health index measure is incomplete.23
But if the size of the listed firm population is clearly a limitation in our calculations, there does not seem to be a systematic bias in our results. To be sure, the very small listings in Ireland, Portugal, and Greece appear heavily correlated with their high PDs, but the country with the lowest PD (the Netherlands) also has a very small listed population. Another potentially important factor is that the listed population in countries like the UK and the Netherlands is represented quite heavily by multinational corporations that derive most of their income from outside their borders.24
Conclusion and Implications
As the price for bailing out distressed sovereigns, foreign creditors, especially the stronger European nations, were demanding a heavy dose of austerity. Several governments, including those of Greece, Ireland, Spain, Portugal, Italy, and the UK, did enact some painful measures. Others, such as France and Hungary, either resisted austerity measures or faced significant social unrest when austerity measures were proposed. These measures typically involve substantial cuts in cash benefits paid to public workers, increases in retirement age, and other reduced infrastructure costs, as well as increased taxes for companies and individuals. The objective was to reduce deficits relative to GDP and enhance the sovereigns' ability to repay their foreign debt and balance their budgets.
While recognizing the necessity of requiring difficult changes for governments to qualify for bailouts and subsidies, we caution that such measures should be designed to inflict as little damage as possible on the health and productivity of the private enterprises that ultimately fund the sovereign. The goal should be to enable all private enterprises with clear going concern value to pay their bills, expand (or at least maintain) their workforces, and return value to their shareholders and creditors (while those businesses that show no promise of ever making a profit should be either reorganized or liquidated). For this reason, raising taxes and imposing other burdens on corporate entities is likely to weaken the long‐run financial condition of sovereigns.
To better estimate sovereigns' risk of default, we propose that traditional measures of macroeconomic performance be combined with more modern techniques. Along with the intuitive appeal of such an approach and our encouraging empirical results, the probabilities of sovereign default provided by aggregating our Z‐Scores across a national economy can be seen, at the very least, as a useful complement to existing methods and market indicators – one that is not subject to government manipulation of publicly released statistics. Using our approach, the credit and regulatory communities could track the performance of publicly held companies and the economies in which they reside – and by making some adjustments, unlisted entities as well. And if sovereigns were also willing to provide independently audited statistics on a regular basis, so much the better.
Appendix: Logit Model Estimation of Default Probabilities
We estimated our credit scoring model based on a standard logit‐regression functional form whereby:
- We compare Z‐Metrics results with issuer ratings. To ensure a fair comparison, credit scores are converted to agency equivalent (AE) ratings by ranking credit scores and by matching exactly the actual agency rating distribution with the AE rating distribution at any point in time.
- We also compare our Z‐Metrics results to the well‐established Altman Z″‐score (1995) model.25