18
ADVANCED ECG CONCEPTS
Carol Jacobson
KNOWLEDGE COMPETENCIES
1. Identify electrocardiogram (ECG) characteristics and treatment approaches for each of the following advanced arrhythmias:
• Supraventricular tachycardias
• Wide QRS beats and rhythms
2. Using the 12-lead ECG, determine the following:
• Bundle branch blocks
• QRS axis
• Patterns of myocardial ischemia, injury, and infarct
3. Identify ECG characteristics of single- and dual-chamber pacemakers during normal and abnormal functioning.
4. Identify ECG characteristics of Brugada syndrome and long QT syndromes.
THE 12-LEAD ELECTROCARDIOGRAM
The 12-lead ECG records electrical activity as it spreads through the heart from 12 different leads, which are in turn recorded by electrodes placed on the arms and legs, and in specific spots on the chest. Each lead represents a different “view” of the heart and consists of two electrodes. A bipolar lead has two poles—one positive and one negative. A unipolar lead has one positive pole and a reference pole that is a point in the center of the chest that is mathematically determined by the ECG machine. The standard 12-lead ECG consists of six frontal plane limb leads that record electrical activity traveling up/down and right/left in the heart, and six precordial leads that record electrical activity in the horizontal plane traveling anterior/posterior and right/left. Limb leads are recorded by electrodes placed on the arms and legs, and precordial leads are recorded by electrodes placed on the chest (Figure 18-1).
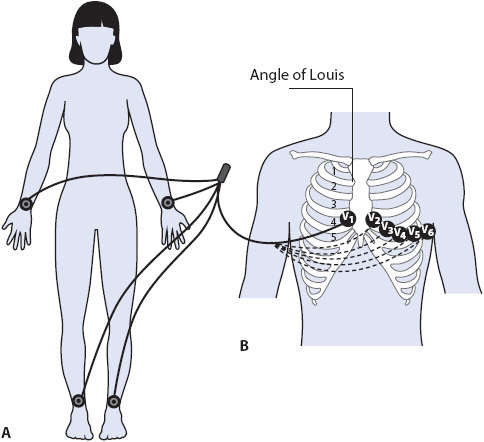
Figure 18-1. (A) Limb electrodes can be placed anywhere on arms and legs. Standard placement is shown here on wrists and ankles. (B) Chest electrode placement. V1 = fourth intercostal space to right of sternum; V2 = fourth intercostal space to left of sternum; V3 = halfway between V2 and V4 in a straight line; V4 = fifth intercostal space at mid clavicular line; V5 = same level as V4 at anterior axillary line; V6 = same level as V4 at midaxillary line.
A camera analogy makes the 12-lead ECG easier to understand. Each lead of the ECG represents a picture of the electrical activity in the heart taken by the camera. In any lead, the positive electrode is the recording electrode or the camera lens. The negative electrode tells the camera which way to “shoot” its picture and determines the direction in which the positive electrode records. When the positive electrode sees electrical activity traveling toward it, it records an upright deflection on the ECG. When the positive electrode sees electrical activity traveling away from it, it records a negative deflection (Figure 18-2). If the electrical activity travels perpendicular to a positive electrode, no activity is recorded. The standard 12-ECG records three bipolar frontal plane leads (leads I, II, and III) and three unipolar frontal plane leads (aVR, aVL, and aVF). In addition, there are six unipolar precordial leads: V1, V2, V3, V4, V5, and V6.
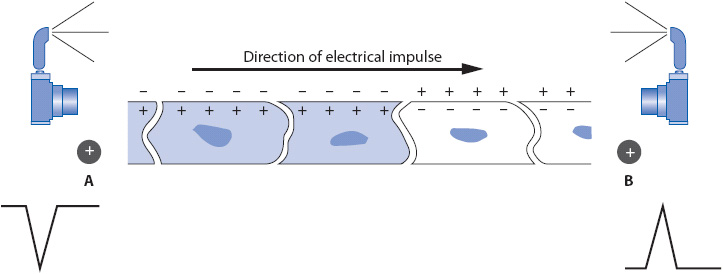
Figure 18-2. A strip of cardiac muscle depolarizing in the direction of the arrow. A positive electrode at B sees depolarization coming toward it and records an upright deflection. A positive electrode at A sees depolarization going away from it and records a negative deflection.
The three bipolar frontal plane leads are illustrated in Figure 18-3A. In each lead, the camera represents the positive pole of the lead. In lead I, the positive electrode is on the left arm and the negative electrode is on the right arm. Any electrical activity in the heart that travels toward the positive electrode (camera lens) on the left arm is recorded as an upright deflection and any activity traveling away from it is recorded as a negative deflection. In lead II, the positive electrode is on the left leg and the negative electrode is on the right arm. Any electrical activity traveling toward the left leg electrode (camera lens) is recorded as an upright deflection and any activity traveling away from it toward the right arm electrode is recorded as a negative deflection. In lead III, the positive electrode is on the left leg and the negative electrode is on the left arm. Any electrical activity coming toward the left leg electrode (camera lens) is recorded upright and any traveling away from it toward the left arm is recorded negative. The view of the heart by the bipolar leads can be compared to a wide-angle camera lens.
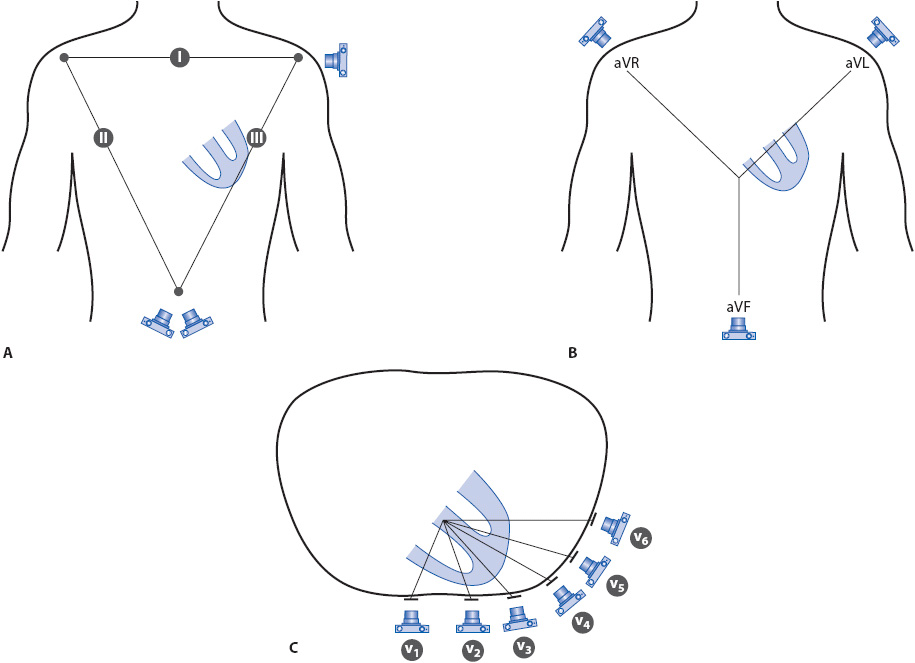
Figure 18-3. The 12 leads of the ECG. The camera represents the location of the positive, or recording, electrode in each lead. (A) Bipolar frontal plane leads I, II, and III. (B) Unipolar frontal plane leads aVR, aVL, and aVF. (C) Unipolar precordial leads V1 to V6.
The three unipolar frontal plane leads, aVR, aVL, and aVF, are illustrated in Figure 18-3B. The camera represents the location of the positive electrode: on the right shoulder for aVR, on the left shoulder for aVL, and at the foot (left leg) for aVF. The “negative end” of the unipolar lead is a reference spot in the center of the chest that is mathematically determined by the ECG machine. The same principles apply to unipolar leads: any electrical activity traveling toward the positive electrode is recorded as an upright deflection and any traveling away from it is recorded as a negative deflection. The six unipolar precordial leads are recorded from their locations on the chest as shown in Figure 18-3C. The view of the heart by unipolar leads can be compared to a telephoto lens on the camera, “zooming in” on the electrical activity in the heart.
The hexaxial reference system (or axis wheel) is formed when the six frontal plane leads are moved together in such a way that they bisect each other in the center (Figure 18-4A). Each lead is labeled at its positive end to make it easy to remember where the positive electrode is. In Figure 18-4B, the hexaxial reference system is superimposed over a drawing of the heart to illustrate how each lead views the heart.
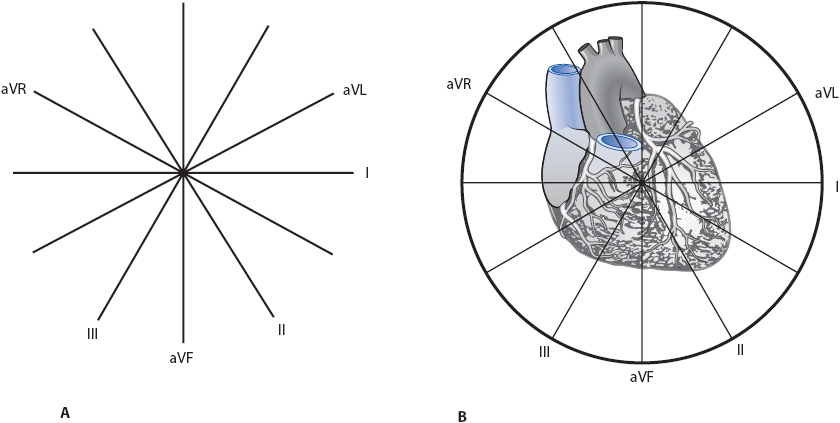
Figure 18-4. Hexaxial reference system (or axis wheel). (A) All six frontal plane leads bisecting each other. Each lead is labeled at its positive end. (B) The axis wheel superimposed on the heart to demonstrate each lead’s view of the heart. Leads I and aVL face the left lateral wall; leads II, III, and aVF face the inferior wall.
The normal sequence of depolarization through the heart begins with an electrical impulse originating in the sinus node, high in the right atrium, and spreading leftward through the left atrium and downward toward the AV node, low in the right atrium (Figure 18-5A). Leads I and aVL, with their positive electrodes (camera lens) on the left side of the body, record this leftward electrical activity as an upright P wave, and leads II, III, and aVF, with their positive electrodes at the bottom of the heart, record the downward spread of activity as upright P waves. Lead aVR, with its positive electrode on the right shoulder, sees the electrical activity moving away from it and records a negative P wave.
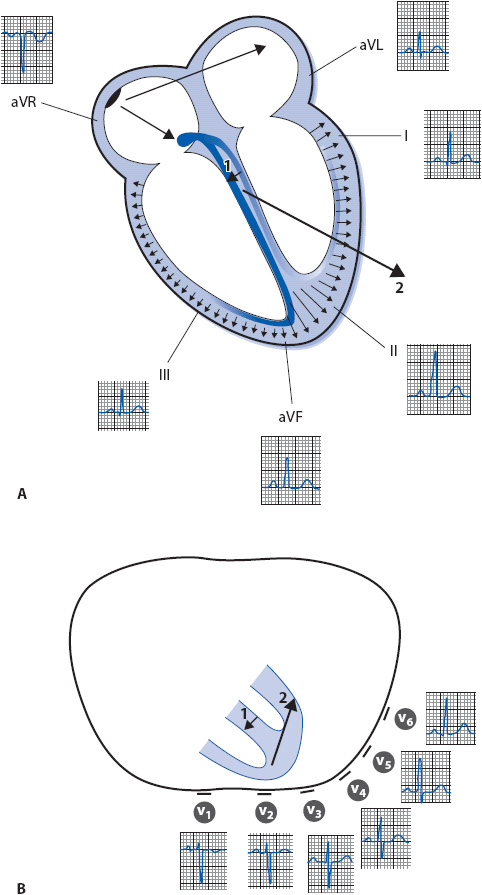
Figure 18-5. (A) Normal sequence of depolarization through the heart as recorded by each of the frontal plane leads. (B) Cross-section of the thorax illustrating how the six precordial leads record normal electrical activity in the ventricles. The small arrow (1) shows the initial direction of depolarization through the septum, followed by the direction of ventricular depolarization, indicated by the larger arrow (2).
As the impulse spreads through the AV node, no electrical activity is recorded because the AV node is too small to be recorded by surface leads. As the impulse exits the AV node, it moves through the bundle of His and enters the right and left bundle branches. The left bundle branch sprouts some Purkinje fibers high on the left side of the septum that carry the impulse into the septum and cause it to depolarize first in a left-to-right direction. The electrical impulse then enters the Purkinje system of both ventricular free walls simultaneously and depolarizes them from endocardium to epicardium, as shown by the small arrows through the ventricular wall in Figure 18-5A. The millions of electrical forces travel through the heart in three dimensions simultaneously, but if averaged together they move downward, leftward, and posteriorly toward the large left ventricle, as indicated by the large arrow in the same figure. This large arrow represents the mean axis, which is the net direction of electrical depolarization through the ventricles when all the smaller arrows are averaged together.
The QRS complex is recorded as the ventricles depolarize. Leads I and aVL, with their positive electrodes on the left side of the body, see the septum depolarizing away from them and record a small negative deflection (Q wave). These leads then see the large left ventricular free wall depolarizing toward them and record an upright deflection (R wave). Leads II, III, and aVF, with their positive electrodes at the bottom of the heart, may not see septal activity at all and record no deflections. However, if these leads see septal electrical activity coming slightly toward them, they record a positive deflection. As the forces continue moving downward toward leads II, III, and aVF, an upright deflection (R wave) is recorded. Lead aVR, positive on the right shoulder, sees all activity moving away from it and records a negative deflection (QS complex). Figure 18-5A illustrates how the six frontal plane leads record normal electrical activity as it spreads through the atria and ventricles.
The six precordial leads record electrical activity traveling in the horizontal plane. Figure 18-5B illustrates the position of the precordial leads and how they record electrical activity as it spreads through the ventricles. Lead V1 is located on the front of the chest and records a small R wave as the septum depolarizes toward it from left to right. It then records a deep S wave as depolarization spreads away from it through the thick left ventricle. As the positive electrode is moved across the precordium from the V1 to the V6 position, it records progressively more left ventricular forces and the R wave gets progressively larger. Lead V6 is located on the left side of the chest and may record a small Q wave as the septum depolarizes from left to right away from the positive electrode, and it records a large R wave as electrical activity spreads toward the positive electrode through the thick left ventricle.
In addition to P waves and QRS complexes, the ECG records T waves as the ventricles repolarize. Normal T waves are slightly asymmetrical with an ascending limb that is more gradual than the descending limb. T waves are usually upright in leads I, II, and V3-6, and negative in lead aVR. T waves can vary in other leads. A normal T wave is not taller than 5 mm in a limb lead or 10 mm in a chest lead. Tall T waves can indicate hyperkalemia or myocardial ischemia or infarction.
The ST segment begins at the end of the QRS complex (the J point) and ends at the beginning of the T wave. It is normally at the baseline (the isoelectric segment between the T wave and the next P wave), and should not stay on the baseline for longer than 0.12 second (Figure 18-6). The ST segment should gently curve upward into the T wave without forming a sharp angle. Normal ST-segment elevation and depression is discussed under “ST-Segment Monitoring” later in this chapter.
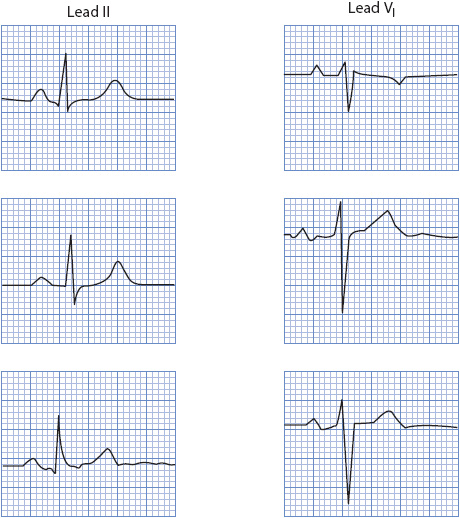
Figure 18-6. Normal ST segment and T waves.
The U wave is sometimes seen following the T wave, and when present it should be smaller than the T wave and point in the same direction as the T wave. U waves are thought to represent repolarization of the midmyocardial cells (M-cells) in the ventricles. Large U waves can be seen in hypokalemia and with certain drugs, like quinidine. Inverted U waves can indicate myocardial ischemia.
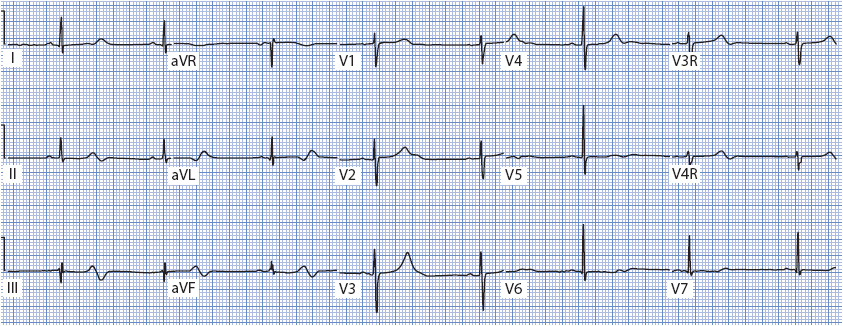
Figure 18-7 shows a normal 12-lead ECG. Normal sinus rhythm is present, and the QRS axis is +45°. P waves are normal (they are flat in V2, but this is not necessarily abnormal), and T waves are normal. The QRS complex is normal (0.08-second wide), there are no abnormal Q waves, and R-wave progression is normal across the precordium. The ST segment is at baseline in all leads. This ECG is used for comparison as abnormalities are discussed throughout this chapter.
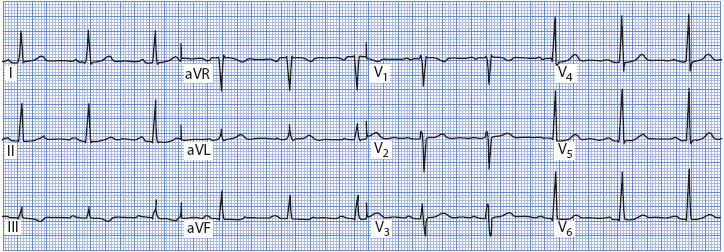
Figure 18-7. Normal 12-lead ECG.
Axis Determination
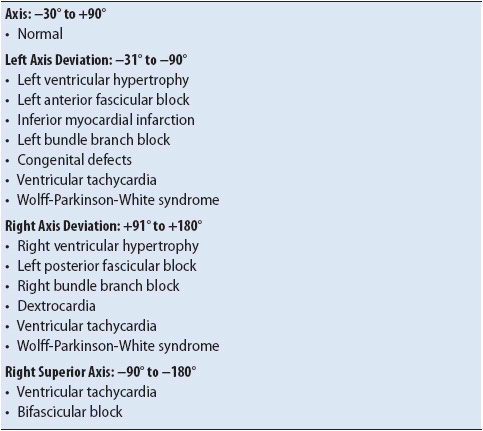
The hexaxial reference system (axis wheel) forms a 360° circle surrounding the heart that by convention is divided into 180 positive degrees (+180°) and 180 negative degrees (–180°) (Figure 18-8). The normal QRS axis is defined as –30° to +90° because most of the electrical forces in a normal heart are directed downward and leftward toward the large left ventricle. Left axis deviation is defined as an axis of –31° to –90° and occurs when most of the forces move in a leftward and superior direction, as can happen in a variety of conditions, such as left ventricular hypertrophy, left anterior fascicular block, inferior myocardial infarction (MI), or left bundle branch block (LBBB) (Table 18-1). Right axis deviation is defined as +91° to +180° and occurs when most of the forces move rightward, as can happen in conditions such as right ventricular hypertrophy, left posterior fascicular block, and right bundle branch block (RBBB) (see Table 18-1). When most of the forces are directed superior and rightward between –90° and –180°, the term right superior axis is used. This axis can occur with ventricular tachycardia and occasionally with bifascicular block.
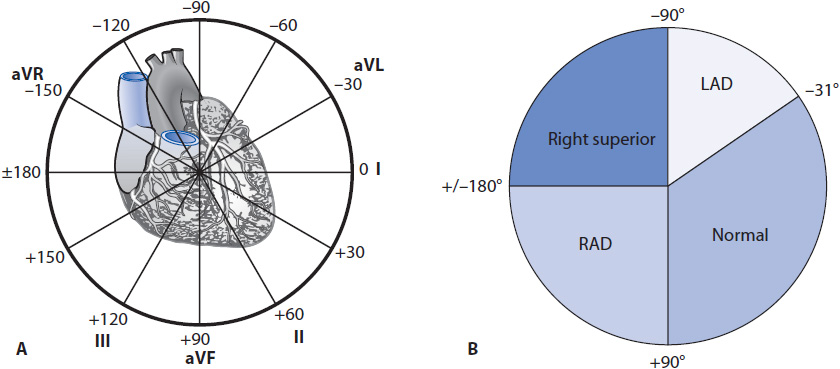
Figure 18-8. (A) Degrees of the axis wheel. (B) Normal axis = –30° to + 90°; left axis deviation = –31° to –90°; right axis deviation = +91° to +180°; right superior axis = –90° to –180°.
TABLE 18-1. SUMMARY OF CAUSES OF AXIS DEVIATIONS
The mean frontal plane QRS axis can be determined in a number of ways. The most accurate method is to average the forces moving right and left with those moving up and down because this represents the frontal plane, lead I is the “pure” right/left lead and lead aVF is the “pure” up/down lead; it is easiest to use these two perpendicular leads to calculate the mean axis. Figure 18-9A shows the frontal plane leads of a 12-lead ECG. Leads I and aVF are shown enlarged along with the axis wheel with small dash marks along the axes of lead I and lead aVF (Figure 18-9B). These dash marks represent the small, 1-mV boxes on the ECG paper. To determine the mean QRS axis, follow these steps:
1. Look at the QRS complex in lead I and count the number of positive and negative boxes. Mark the net vector along the appropriate end of lead I on the axis wheel. In Figure 18-9B, the QRS complex in lead I is five boxes positive and two boxes negative, resulting in a net three boxes positive, or + 3. Count three dash marks toward the positive end of lead I and put a mark on the axis wheel at that spot.
2. Look at the QRS complex in aVF and follow the same procedure as above. In this example, the QRS complex in aVF is eight boxes positive and has two very small negative deflections that equal approximately one box when combined, resulting in a net +7. Count seven dash marks along the positive end of aVF’s axis and place a mark at that spot.
3. Draw a perpendicular line down from the mark on lead I’s axis and a perpendicular line across from the mark on aVF’s axis.
4. Draw a line from the center of the axis wheel to the spot where the two perpendicular lines meet. This line represents the mean QRS axis. In the example in Figure 18-9B, the axis is about +65°.
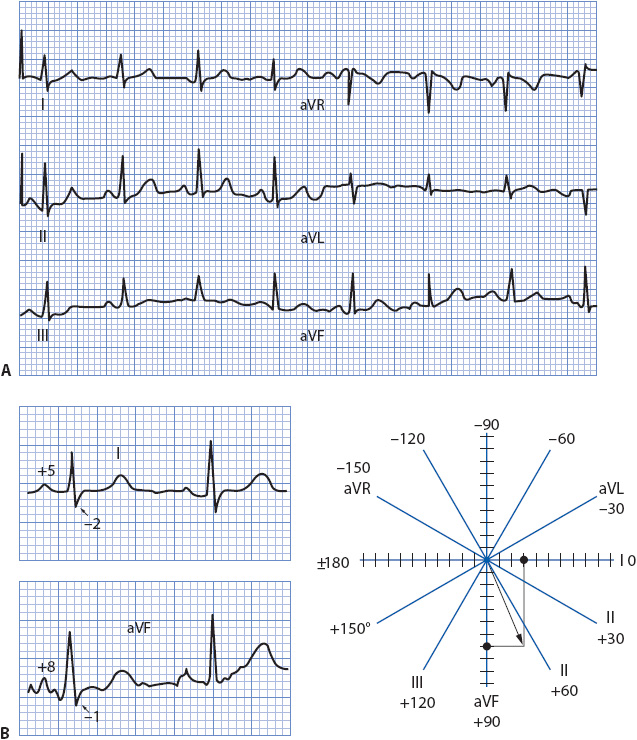
Figure 18-9. Calculating the mean QRS axis. (A) The six frontal plane leads of an ECG. (B) Leads I and aVF enlarged. See the text for instructions on calculating the axis using leads I and aVF on the axis wheel.
A quick but less precise method of axis determination is to place the axis in its proper quadrant of the axis wheel by looking at leads I and aVF, because these leads divide the wheel into four quadrants. As illustrated in Figure 18-10, if both of these leads are positive, the axis falls in the normal quadrant, 0° to +90°. If lead I is positive and aVF is negative, the axis falls in the left quadrant, 0° to –90°. If lead I is negative and aVF is positive, the axis falls in the right quadrant, +90° to +180°. If both leads are negative, the axis falls in the right superior quadrant or “no-man’s-land” –90° to –180°. Locating the correct quadrant is sometimes adequate, but because 30° of the left quadrant is considered normal, it is necessary to be more precise in describing the axis when it falls in the left quadrant. To “fine-tune” the axis when it is in the left quadrant, look at lead II. If lead II has a positive QRS, the axis is in the normal part of the left quadrant (0° to –30°); if it has a negative QRS, the axis is left deviated (–31° to –90°).
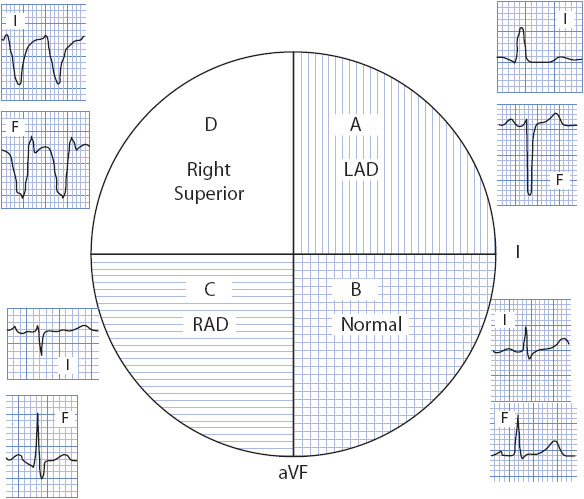
Figure 18-10. The four quadrants of the axis wheel. (A) Left axis deviation quadrant; lead I is positive and lead aVF is negative. (B) Normal axis quadrant; leads I and aVF are both positive. (C) Right axis deviation quadrant; lead I is negative and lead aVF is positive. (D) Right superior quadrant; leads I and aVF are both negative. (With permission from: Marriott HJL: Practical Electrocardiography. 8th ed. Baltimore, MD: Williams & Wilkins; 1988:35.)
Using the ECG in Figure 18-11A, first place the axis in the appropriate quadrant by using leads I and aVF. Lead I is upright and aVF is negative, placing the axis in the left quadrant. However, because 30° of the left quadrant is considered normal, we need to fine-tune the axis to determine where within the left quadrant it actually falls. Since lead II is mostly negative, the axis is deviated to the left. The axis wheel shows how to count boxes in this example. The axis is –60°.
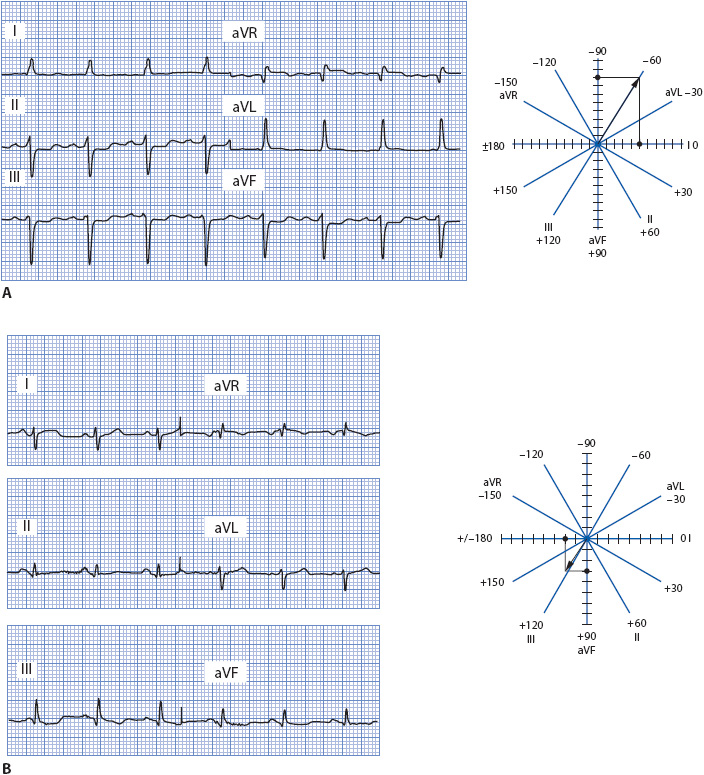
Figure 18-11. (A) Frontal plane leads demonstrating left axis deviation. Lead I is five boxes positive; aVF is two boxes positive and ten boxes negative for a net of –8. The axis is –60°. (B) Frontal plane leads demonstrating right axis deviation. Lead I is two boxes positive and four boxes negative for a net of –2; lead aVF is one box negative and four boxes positive for a net of +3. The axis is +120°.
Using the ECG in Figure 18-11B, place the axis in the appropriate quadrant. Because lead I is negative and aVF is positive, the axis is in the right quadrant. The axis wheel shows how boxes are counted in this example. The axis is +130°.
Bundle Branch Block
When one of the bundle branches is blocked, the ventricles depolarize asynchronously. Bundle branch block is characterized by a delay of excitation to one ventricle and an abnormal spread of electrical activity through the ventricle whose bundle is blocked. This delayed conduction results in widening of the QRS complex to 0.12 second or more and a characteristic pattern best recognized in precordial leads V1 and V6 and limb leads I and aVL.
Normal ventricular depolarization as recorded by leads V1 and V6 is illustrated in Figure 18-12. The positive electrode for V1 is located on the front of the chest at the fourth intercostal space to the right of the sternum, close to the right ventricle. The positive electrode for V6 is located in the left midaxillary line at the fifth intercostal space, close to the left ventricle. Lead V1 records a small R wave as the septum depolarizes from left to right toward the positive electrode. It then records a negative deflection (S wave) as the main forces travel away from the positive electrode toward the left ventricle, resulting in the normal rS complex in V1. Lead V6 may record a small Q wave as the septum depolarizes left to right away from the positive electrode. It then records a tall R wave as the main forces travel toward the left ventricle, resulting in the normal qR complex in V6. When both ventricles depolarize together, the QRS width is less than 0.12 second.
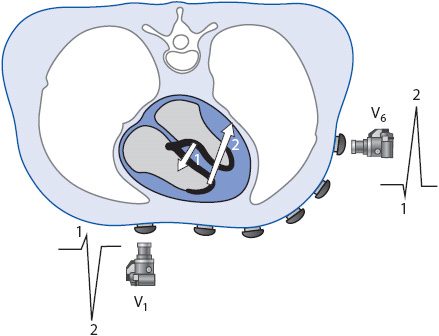
Figure 18-12. Normal ventricular depolarization as recorded by leads V1 and V6.
Right Bundle Branch Block
The presence of a block in the right bundle branch causes a different spread of electrical forces in the ventricles and thus a different pattern to the QRS complex. Three separate forces occur, as seen in Figure 18-13A.
1. Septal activation occurs first from left to right (arrow 1), resulting in the normal small R wave in V1 and small Q wave in V6.
2. The left ventricle is activated next through the normally functioning left bundle branch. Depolarization spreads normally through the Purkinje fibers in the left ventricle (arrow 2), causing an S wave in V1 as the impulse travels away from its positive electrode and an R wave in V6 as the impulse travels toward the positive electrode in V6.
3. The right ventricle depolarizes late and abnormally as the impulse spreads via cell-to-cell conduction through the right ventricle (arrow 3). This abnormal activation causes a wide second R wave (called R prime [R′]) in V1 as it travels toward the positive electrode in V1 and a wide S wave in V6 as it travels away from the positive electrode in V6 because muscle cell-to-cell conduction is much slower than conduction through the Purkinje system, the QRS complex widens to 0.12 second or greater.
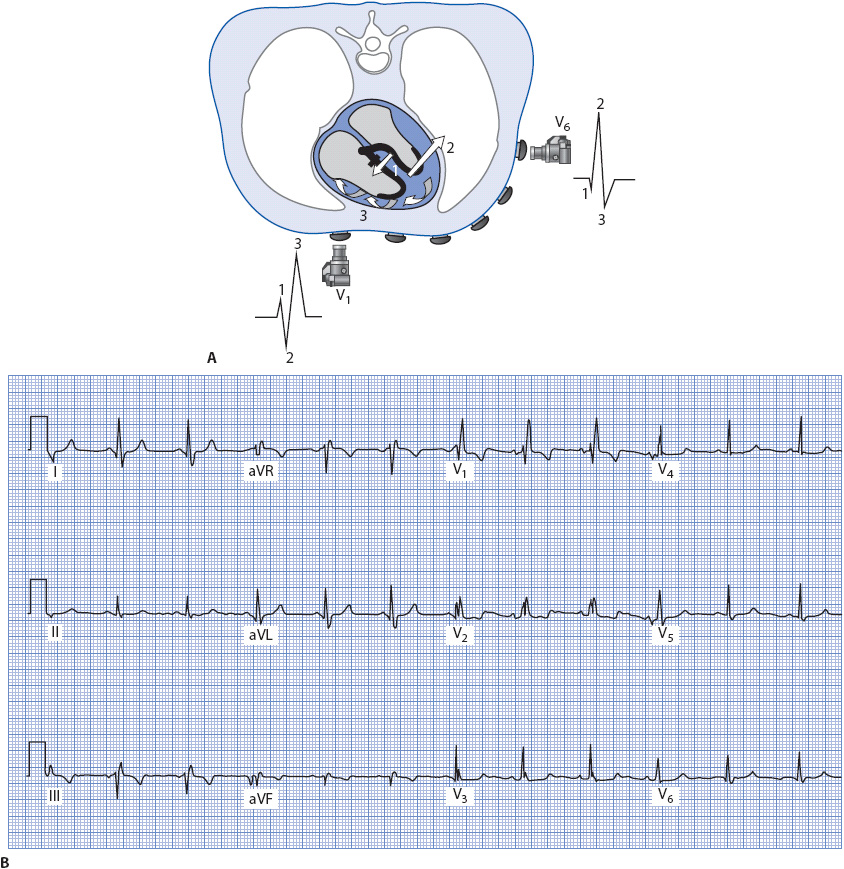
Figure 18-13. (A) Ventricular depolarization with RBBB as recorded by leads V1 and V6. (B) 12-lead ECG illustrating RBBB.
Right bundle branch block can be recognized by a wide rSR′ pattern in V1 and a wide qRs pattern in V6, I, and aVL, because the positive electrode in these two limb leads is located on the left side of the body. The ECG in Figure 18-13B illustrates RBBB.
Left Bundle Branch Block
Figure 18-14 illustrates the spread of electrical forces through the ventricles when the left bundle branch is blocked. In LBBB, the septum does not depolarize in its normal left-to-right direction because the block occurs above the Purkinje fibers that normally activate the left side of the septum. This results in the loss of the normal small R wave in V1 and loss of the Q wave in V6, I, and aVL. Two main forces occur in LBBB:
1. The right ventricle is activated first through the Purkinje fibers (arrow 1). Because the right ventricular free wall is so much thinner than that of the left ventricle, forces traveling through it are often not recorded in V1. Sometimes a small, narrow R wave is recorded in V1 during LBBB, and this wave is most likely the result of forces traveling through the right ventricular free wall.
2. The left ventricle depolarizes late and abnormally as the impulse spreads via cell-to-cell conduction through the thick left ventricle (arrow 2). This causes V1 to record a wide negative QS complex as the impulse travels away from its positive electrode. The lateral leads V6, I, and aVL record a wide R wave as the impulse travels through the large left ventricle toward their positive electrodes. The QRS widens to 0.12 second or greater due to the slow cell-to-cell conduction in the left ventricle.
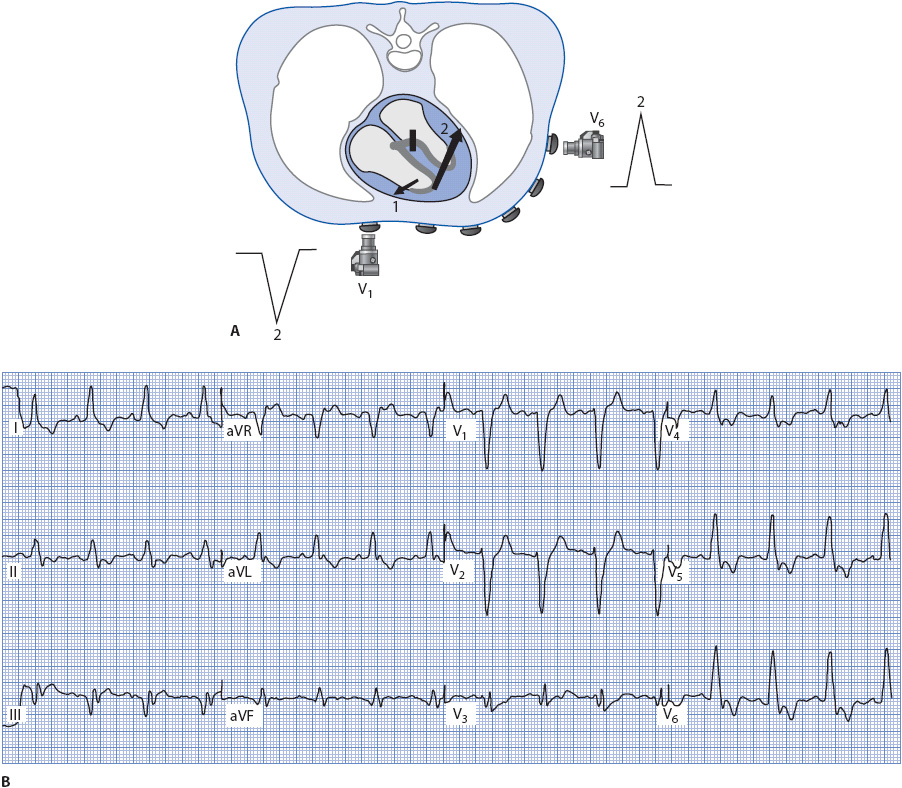
Figure 18-14. (A) Ventricular depolarization with LBBB as recorded by leads V1 and V6. (B) 12-lead ECG illustrating LBBB.
Left bundle branch block can be recognized by a wide QS complex in V1 and wide R waves with no Q waves in V6, I, and aVL. The ECG in Figure 18-14B illustrates LBBB.
Acute Coronary Syndrome
The term acute coronary syndrome (ACS) is used to refer to the pathophysiologic continuum that begins with plaque rupture in a coronary artery and ultimately results in cell necrosis (infarction) if the process is not arrested. ACS encompasses three distinct phases of this continuum: (1) unstable angina (UA), (2) non–ST-elevation MI (NSTEMI), and (3) ST-elevation MI (STEMI). The terms STEMI and NSTEMI refer to the presence or absence of ST elevation on the admission ECG in a patient who is having an MI as diagnosed by elevated biochemical markers in the blood. Once an infarction has occurred, the terms Q-wave or non–Q-wave MI indicate the ultimate presence or absence of Q waves on the ECG.
Myocardial infarction can occur because of blockage of a coronary artery with thrombus or from severe and prolonged ischemia due to coronary artery spasm or unrelieved obstruction of a coronary artery. When infarction does occur, there are three “zones” of tissue damage, each of which produces characteristic changes on the ECG (Figure 18-15).
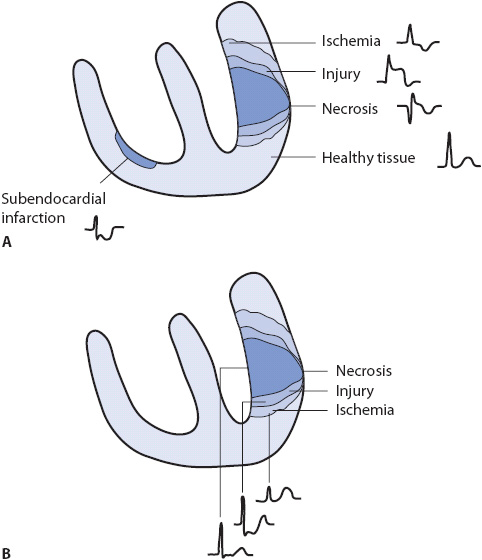
Figure 18-15. Zones of myocardial ischemia, injury, and infarction with associated ECG changes. (A) Indicative changes of ischemia, injury, and necrosis seen in leads facing the injured area. (B) Reciprocal changes often seen in leads not directly facing the involved area.
Myocardial ischemia can result in several changes on the ECG (Figure 18-16). The most familiar patterns of ischemia are horizontal or downsloping ST-segment depression of 0.5 mm or more, and T-wave inversion. Other indicators of ischemia include an ST segment that remains on the baseline longer than 0.12 second; an ST segment that forms a sharp angle with the upright T wave, tall, wide-based T waves; and inverted U waves.

Figure 18-16. ECG patterns associated with myocardial ischemia.
Myocardial injury is most often indicated by ST-segment elevation of 1 mm or more above the baseline in leads facing the infarcted area (Figure 18-17). Other signs of acute injury include a straightening of the ST segment that slopes up to the peak of the T wave without spending any time on the baseline, tall, peaked T waves, and symmetric T-wave inversion.
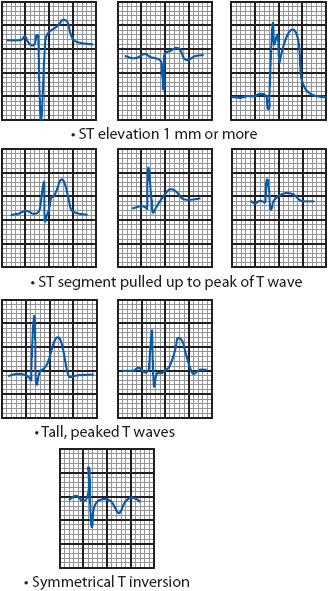
Figure 18-17. ECG patterns associated with acute myocardial injury.
Necrosis or death of myocardial tissue is indicated on the ECG by development of Q waves that are greater than 0.03 second wide or 25% of the ensuing R-wave amplitude (see Figures 18-5A and 18-9 for normal Q waves and Figures 18-18 and 18-19 for abnormal Q waves). Q waves can develop transiently with severe ischemia and with subendocardial MI, and transmural infarction can occur without the development of Q waves. Therefore, the newer terms Q-wave and non-Q-wave MI are preferred over the older terms transmural and subendocardial infarction. In any case, the presence of abnormal Q waves is still considered to be ECG evidence of myocardial necrosis.
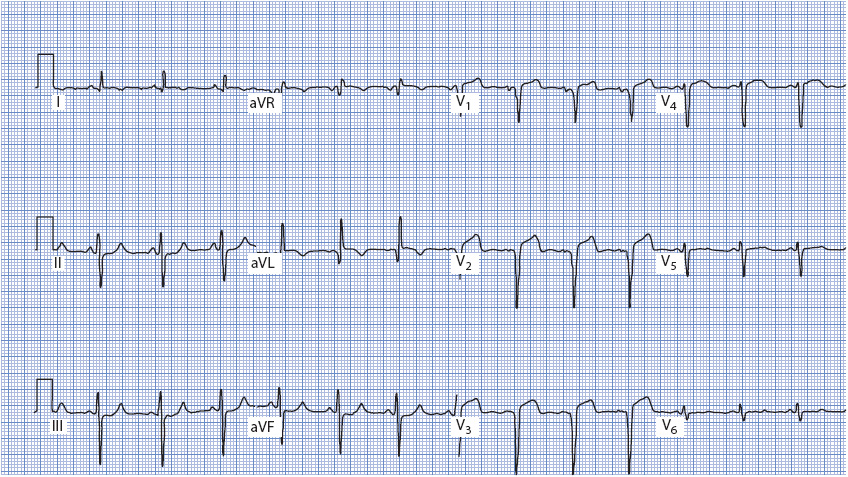
Figure 18-18. 12-lead ECG demonstrating acute anterior wall MI. Q waves are present in V1 to V3 and ST-segment elevation is present in V1 to V4. An abnormal Q wave is also present in aVL.
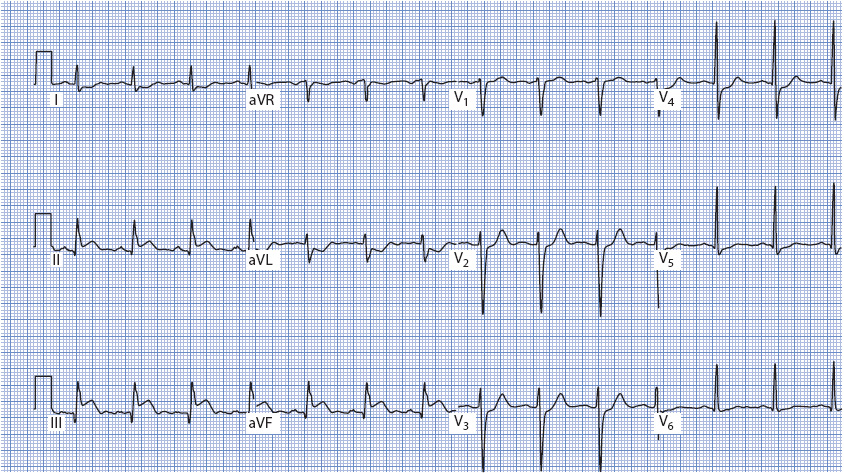
Figure 18-19. 12-lead ECG demonstrating acute inferior wall MI. ST elevation is present in II, III, and aVF; reciprocal ST depression is present in I, aVL, and V2 to V4. Q waves can be seen in III and aVF.
The ECG reflects the evolution of the infarction from the acute stage through the fully evolved stage. Very early MI often causes peaking and widening of the T waves followed within minutes by ST-segment elevation. ST-segment elevation can persist for hours to several days, but resolves more quickly with successful reperfusion. Once the ST segment has returned to baseline, ECG evidence of the acute infarction stage is lost. Q waves appear within hours of pain onset and usually remain forever, although sometimes Q waves disappear over the years after infarction. T-wave inversion occurs within hours after infarction and can last for months. T waves often return to their previous upright position within a few months after acute MI. Thus, an evolving infarct is one in which serial ECGs show ST segments returning toward baseline, the development of Q waves, and T-wave inversion. The term old infarction or infarct of undetermined age is used when the first ECG recorded shows Q waves, ST segment at baseline, and T waves either inverted or upright, indicating that an MI occurred at some point in the past.
Locating the Infarction From the ECG
ST-segment elevation, Q waves, and T-wave inversion are recorded in leads facing the damaged myocardium and are called the indicative changes of infarction. Leads not facing the involved tissue often show changes related to the loss of electrical forces (depolarization and repolarization) in the damaged tissue. These leads record mirror-image changes that are called reciprocal changes. Figure 18-15 illustrates indicative and reciprocal changes associated with MI, and Table 18-2 lists leads in which indicative and reciprocal changes are found in each of the major types of MI.
TABLE 18-2. ECG CHANGES ASSOCIATED WITH MYOCARDIAL INFARCTION
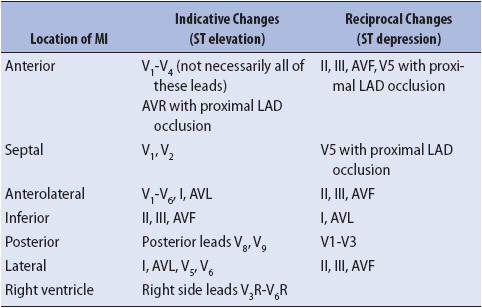
Anterior wall MI is recognized by indicative changes in leads facing the anterior wall precordial leads V1 to V4 (see Figure 18-18). Reciprocal changes are often recorded in the inferior leads II, III, and aVF, and sometimes in V5 with proximal left anterior descending (LAD) artery stenosis. Inferior wall MI is diagnosed by indicative changes in leads II, III, and aVF (see Figure 18-19), and reciprocal changes are often seen in leads I and aVL. Lateral wall MI presents with indicative changes in leads I, aVL, and/or V5 and V6, with reciprocal changes in leads II, III, and aVF (Figure 18-20). Posterior wall MI is less obvious because in the standard 12-lead ECG there are no leads that face the posterior wall, and therefore there are no indicative changes recorded (Figure 18-21). The diagnosis is suspected when ST segment depression is present in the anterior leads, especially V1 and V2 but often all the way to V4. Reciprocal changes seen in these leads include a taller R wave than normal (mirror image of the Q wave that would be recorded over the posterior wall), ST-segment depression (mirror image of the ST elevation from the posterior wall), and upright, tall T waves (mirror image of the T-wave inversion from the posterior wall). Posterior leads V7, V8, and V9 should be recorded whenever posterior wall MI is suspected (Figure 18-23B).
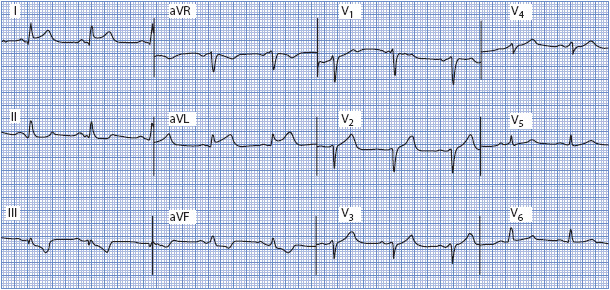
Figure 18-20. 12-lead ECG demonstrating acute lateral wall MI. ST elevation is present in leads I and aVL, and reciprocal ST depression is seen in leads II, III, and aVF.
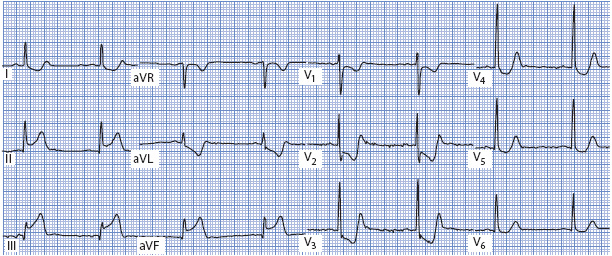
Figure 18-21. 12-lead ECG demonstrating acute inferior and posterior MI. ST elevation is present in leads II, III, and aVF (inferior leads), and ST depression is present in all of the V leads. ST depression in V1-V3 is indicative of posterior MI. The ST depression in V4-V6 is reciprocal to the inferior MI.
Right ventricular MI occurs in up to 45% of inferior MIs; therefore, it usually is associated with indicative changes in the inferior leads II, III, and aVF (Figure 18-22). In addition, it is not uncommon to see ST elevation in V1 as well, because V1 is the chest lead that is closest to the right ventricle. ST elevation in V1, together with ST elevation in the inferior leads, is suspicious for right ventricular MI. Another clue is discordance between the ST segment in V1 and the ST segment in V2. Normally, when the ST segment in V1 is elevated, it is related to anterior or septal MI, in which case the ST in V2 is also elevated. Discordance means that the ST segments do not point in the same direction—V1 shows ST elevation while V2 is either normal or shows ST depression. This finding is suspicious for right ventricular MI. The American Heart Association (AHA) and the American College of Cardiology (ACC) have recommended that right-sided chest leads V3R and V4R be recorded in all patients presenting with ECG evidence of acute inferior wall infarction. Leads V3R through V6R develop ST elevation when acute right ventricular MI is present. Lead V4R is the most sensitive and specific lead for recognition of right ventricular MI. Figure 18-23A shows location of right sided chest leads and Figure 18-23B shows location of posterior leads.
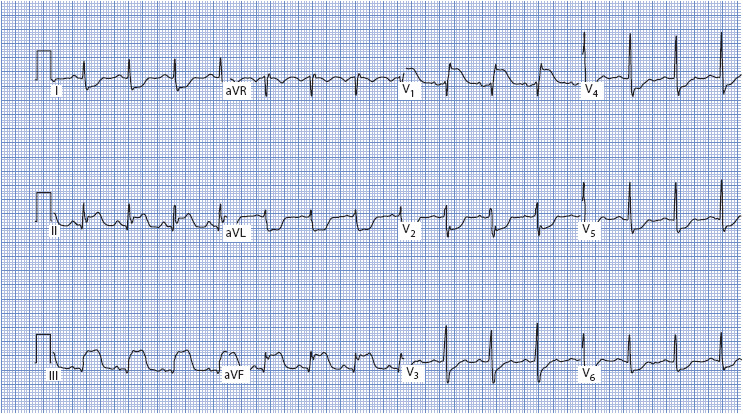
Figure 18-22. 12-lead ECG demonstrating acute right ventricular MI. ST elevation is present in II, III, aVF, and V1; reciprocal ST depression is present in all other leads. Note the discordant ST elevation in V1 and ST depression in V2.
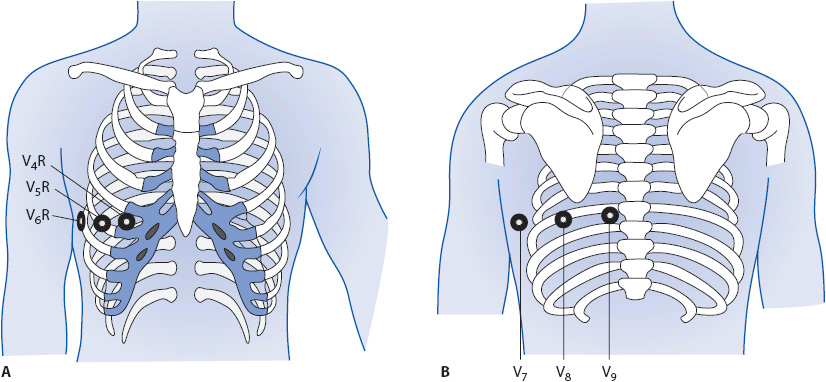
Figure 18-23. (A) Right side chest leads. V4R at right fifth intercostal space, mid clavicular line; V5R at right fifth intercostal space, anterior axillary line; V6R at right fifth intercostal space, midaxillary line. (B) Posterior leads: V7 at posterior axillary line; V8 at tip of scapula; V9 next to spine.
Preexcitation Syndromes
Preexcitation means early activation of the ventricle by supraventricular impulses that reach the ventricle through an accessory conduction pathway faster than they travel through the AV node. Many people have tracts of tissue, often referred to as “bypass tracts” or “accessory pathways,” that can carry electrical impulses directly from atria to ventricles, bypassing the delay in the AV node and causing early and abnormal depolarization of the ventricles. These accessory pathways can be found anywhere around the tricuspid or mitral valve rings. The most common type of preexcitation syndrome is the Wolff-Parkinson-White syndrome, in which the impulse travels down the accessory pathway from the atria directly into the ventricles, completely bypassing AV node delay. Other anatomic connections exist that can bypass the normal AV node delay or create connections between different parts of the conduction system and the ventricles and cause variations of the preexcitation pattern. Fibers originating in the atria and inserting into the bundle of His have been demonstrated anatomically and can result in a short PR interval and normal QRS complex (formerly called Lown-Ganong-Levine syndrome).
Wolff-Parkinson-White Syndrome
In Wolff-Parkinson-White syndrome, the ventricle is stimulated prematurely by an electrical impulse traveling through the accessory pathway while the impulse simultaneously descends normally through the AV node (Figure 18-24A). Impulses travel faster through the accessory pathway because they bypass the normal AV node delay. Part of the ventricle receives the impulse early via the accessory pathway and begins to depolarize before the rest of the ventricle is activated through the His-Purkinje system. Early stimulation of the ventricle results in a short PR interval and a widened QRS complex as the impulse begins to depolarize the ventricle via muscle cell-to-cell conduction. Premature stimulation of the ventricle causes a characteristic slurring of the initial part of the QRS complex, called a delta wave. The remainder of the QRS complex is normal because the rest of the ventricle is depolarized normally through the Purkinje system. This preexcitation results in ventricular fusion beats as the ventricles are depolarized simultaneously by the impulse coming through the accessory pathway and through the normal AV node. The degree of preexcitation varies, depending on the relative rates of conduction down the accessory pathway and through the AV node, and it determines the length of the PR interval and size of the delta wave (Figure 18-24A to 18-24C).
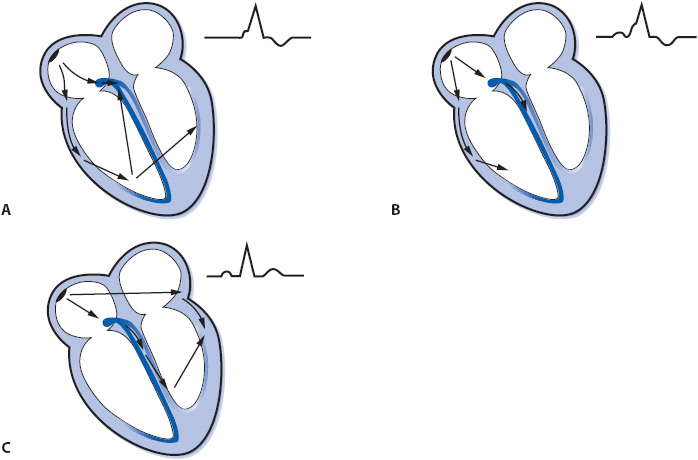
Figure 18-24. Varying degrees of preexcitation. (A) Maximal preexcitation when the ventricles are activated totally by the accessory pathway. (B) Less-than-maximal preexcitation when the ventricles are activated by the impulse traveling through both the accessory pathway and the normal AV conduction system. (C) Concealed accessory pathway. The ventricles are activated through the normal AV conduction system with no participation of the accessory pathway, resulting in a normal PR interval and normal QRS complex.
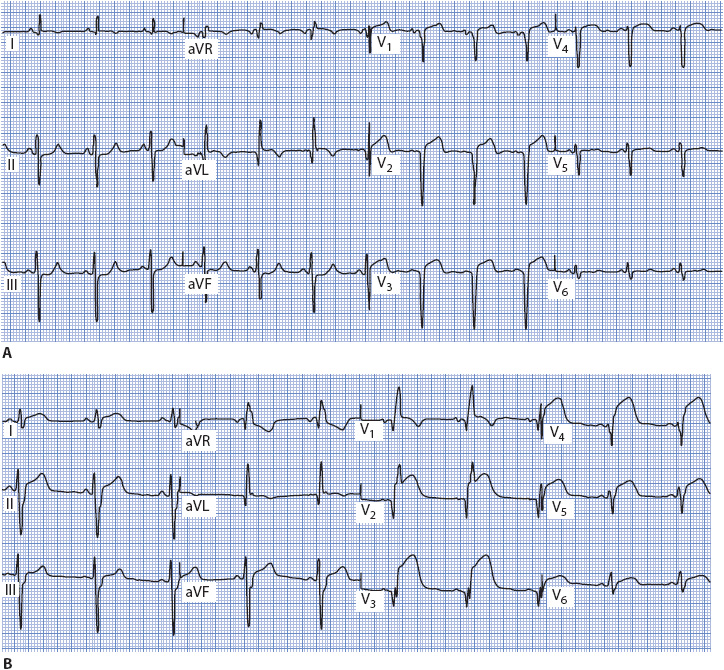
Wolff-Parkinson-White syndrome is recognized on the ECG by the presence of a short PR interval (< 0.12 second) and delta waves in many leads. Figure 18-25A, B show two examples of this type of pattern. Preexcitation syndromes are clinically significant because the presence of two pathways into the ventricle is a setup for reentrant tachycardias, which occur frequently in people with accessory pathways and are a part of the “syndrome” of Wolff-Parkinson-White. See the section Supraventricular Tachycardias later in this chapter for more information on arrhythmias associated with accessory pathways.

Figure 18-25. (A) 12-lead ECG demonstrating Wolff-Parkinson-White syndrome with short PR interval and delta waves. Lead V1 is positive, indicating a posterior accessory pathway. (B) Wolff-Parkinson-White syndrome with short PR and delta waves with a negative V1, indicating an anterior or right-sided accessory pathway.
Treatment
Wolff-Parkinson-White syndrome does not require treatment unless it is associated with symptomatic tachycardias. Specific therapy depends on the mechanism of the tachyarrhythmia, the effect of drugs on conduction through the AV node and the accessory pathway, and on the patient’s tolerance of the arrhythmia. The section on supraventricular tachycardias later in this chapter discusses drug treatment of tachycardias associated with accessory pathways.
Radio-frequency (RF) catheter ablation of the bypass tract provides a cure for the tachyarrhythmias associated with accessory pathways in many patients. RF ablation is an invasive procedure that requires the introduction of several catheters into the heart through the venous and sometimes arterial systems. An electrophysiology study is done first to record intracardiac signals and determine the mechanism of the tachycardia. The electrophysiology study confirms the presence and location of the accessory pathway, participation of the pathway in maintaining the tachycardia, and conduction characteristics of the accessory pathway. A special ablation catheter is then positioned next to the bypass tract and RF energy is delivered through the catheter to the tract, destroying the tissue and preventing it from being able to conduct. Permanent tissue damage in the accessory pathway is the goal of RF ablation, and when successful, it prevents further episodes of tachycardia.
Brugada Syndrome
Brugada syndrome (BS) is an inherited channelopathy involving mutations of the SCN5A gene that participates in regulation of cardiac sodium channels. It is associated with a high incidence of VT/VF and sudden cardiac death (SCD) in people with structurally normal hearts. BS is estimated to be responsible for at least 4% of all sudden deaths and at least 20% of sudden deaths in patients with structurally normal hearts. It is seen worldwide but is most prevalent in Southeast Asia, occurs most often in men (8:1 male to female ratio), and typically manifests in the third or fourth decade of life.
Brugada syndrome is characterized by ST-segment elevation and a RBBB-type QRS pattern in leads V1-V3, typically without the dominant S waves in the lateral leads that is seen with true RBBB. Three patterns of ST elevation have been identified (Figure 18-26): (1) type 1 ECG pattern with a coved ST segment elevation > 2 mm, followed by a negative T wave; (2) type 2 ECG pattern with a saddle-back shaped ST elevation followed by a positive or biphasic T wave; and (3) type 3 ECG pattern with ST elevation < 1 mm with coved or saddle-back pattern. All three patterns can be seen in BS but only the type 1 pattern is considered diagnostic (Figure 18-27). BS is diagnosed by the presence of a type 1 or coved-type ST-segment elevation in > 1 right precordial lead (V1-V3) plus one of the following conditions: documented VF or polymorphic VT, a family history of SCD at a young age (< 45 years), a type 1 ECG in family members, otherwise unexplained syncope, nocturnal agonal respiration, or inducibility of VT/VF with programmed electrical stimulation. The diagnosis is also considered positive when a type 2 or type 3 ECG pattern present at baseline converts to the diagnostic type 1 pattern after sodium channel blocker administration, along with one or more of the above clinical criteria.
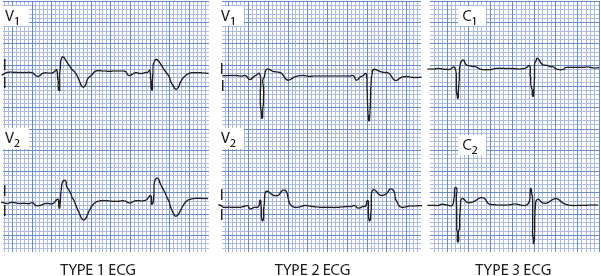
Figure 18-26. Three ECG patterns of Brugada syndrome. Type I shows the coved ST segment elevation and T wave inversion and is considered the diagnostic pattern. Type 2 shows the saddle-back type ST elevation with an inverted T wave in V1 and upright T wave in V2. Type 3 shows minimal ST elevation but an elevated J point creating a RBBB-type pattern in V1.

Figure 18-27. 12-lead ECG showing Type I Brugada pattern in a young man with syncope.
The mainstay of therapy for BS is an implantable cardioverter defibrillator (ICD). ICD implantation is a class I recommendation for survivors of cardiac arrest due to VF or hemodynamically unstable sustained VT not because of a reversible cause, and a class IIa recommendation for patients with BS who have had syncope or documented VT. Quinidine is the only drug that has been shown to be effective in preventing ventricular arrhythmias in patients with BS. The best way to manage asymptomatic BS patients is still debated.
The QT Interval and Long-QT Syndromes
The QT interval is measured from the beginning of the QRS complex to the end of the T wave and is used clinically as a reflection of ventricular repolarization time. The QT interval is heart rate dependent; it shortens at faster heart rates and lengthens at slower heart rates, therefore, the measured QT interval must be corrected for heart rate (QTc = QT corrected for heart rate). A normal QTc is < 0.46 second (460 msec) in women and < 0.45 second (450 msec) in men. A prolonged QTc indicates abnormally prolonged ventricular repolarization and is associated with torsades de pointes (TdP) and SCD. The most commonly used method of correcting the measured QT interval for heart rate is the Bazett formula:
QTc = measured QT interval divided by the square root of the preceding R-R interval (all measurements in seconds).
Figure 18-28 illustrates how to use the Bazett formula. A QTc > 500 msec increases the risk of developing TdP.
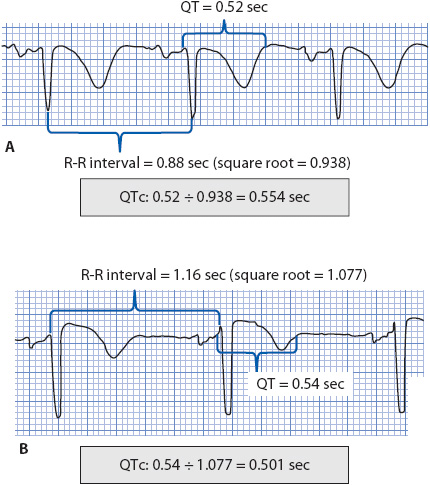
Figure 18-28. Two examples showing Bazett correction for measured QT intervals.
Long-QT syndrome (LQTS) can be acquired or congenital. The acquired type is usually due to drugs that prolong ventricular repolarization or to electrolyte abnormalities, especially hypokalemia or hypomagnesemia. The congenital type is owing to gene mutations that affect ion channels on the cardiac cell membrane and is hereditary. Both types of QT-interval prolongation increase the risk of TdP and can be a cause of sudden cardiac death.
The AHA’s practice standards for ECG monitoring in hospital settings lists the following indications for QT-interval monitoring:
1. Initiation of a drug known to cause TdP
2. Overdose from potentially proarrhythmic agents
3. New-onset bradyarrhythmias and
4. Severe hypokalemia or hypomagnesemia.
Each facility should develop a protocol that defines a single consistent method of QT-interval monitoring that is used by all practitioners responsible for cardiac monitoring. The protocol should define the equipment used (manual or electronic), the method for determining the end of the T wave, the formula for heart rate correction, criteria for lead selection, and require that whichever lead is chosen should be used for serial measurements in the same patient.
Acquired Long-QT Syndrome
The most common cause of acquired LQTS is drug therapy. Many drugs prolong the QT interval by inhibiting potassium channels that are responsible for repolarization of cardiac cells. The most common classes of drugs that prolong the QT interval and cause TdP include antiarrhythmics, antibiotics, antipsychotic and antidepressant drugs, antihistamines, and gastric motility agents. A list of drugs commonly associated with Tdp is available at www.qtdrugs.com. Episodes of TdP in the acquired form of LQTS are most commonly precipitated by short-long RR intervals, such as those caused by a ventricular premature beat (short cycle) followed by a compensatory pause (long cycle). Episodes of TdP are also associated with bradycardia or frequent pauses in the rhythm, thus, the acquired type is commonly referred to as pause-dependent LQTS.
The risk of developing TdP from drugs increases in the presence of hypokalemia or hypomagnesemia, high doses or rapid IV infusion of QT prolonging drugs, or consumption of other drugs that also prolong the QT interval or slow drug metabolism. Other risk factors for TdP include heart failure (HF) or myocardial ischemia, liquid protein weight-loss diets or starvation, bradycardia or sudden pauses in rhythm, acute neurological events (eg, subarachnoid hemorrhage), older age, female sex, and genetic predisposition to QT prolongation. Significant changes in QTc after initiation of a drug known to be associated with TdP include an increase in QTc of > 60 msec from the predrug baseline QTc, or a QTc > 500 msec. Other warning signs of TdP during drug administration include widening or distortion of the T wave, development of enlarged U waves or T-U waves, exaggerated T-U wave distortion on beats terminating pauses, T wave alternans (alternating T wave amplitude from beat to beat), and PVC couplets or short runs of polymorphic VT occurring on the T wave of the beat terminating a pause.
Treatment of TdP includes identifying and managing the cause, discontinuing any causative drugs, and correcting electrolyte imbalances. IV magnesium can be administered to control episodes of TdP until the cause is corrected. Overdrive atrial or ventricular pacing at a rate of 80 beats/min or faster can prevent the pauses that may precipitate episodes of TdP and cause the QT interval to shorten as the heart rate is increased. Pacing and magnesium are temporary management strategies until the cause is eliminated. If TdP becomes sustained or degenerates into VF, defibrillation with an unsynchronized shock is required to terminate the episode.
Congenital Long-QT Syndromes
Congenital LQTS involves mutations in several genes that control potassium or sodium channels on cardiac cells. Thirteen different genes causing genetic LQTS have been identified and are named LQT1 through LQT13. The three most common are LQT1, LQT2, and LQT3, which are responsible for up to 90% of genotyped cases of LQTS. LQT1 and LQT2 are due to mutations of genes that affect potassium channel function (KCNQ1 and KCNH2), and LQT3 is because of mutations of the SCN5A gene that affects sodium channel function. The three main types all present with long QT intervals but differ from each other in several ways. The ECG in LQT1 often has wide, broad-based T waves that cause the prolonged QT interval, and arrhythmia events often occur during physical activity, especially swimming or diving. In LQT2, the ECG often shows notched T waves in multiple leads, and arrhythmia events are typically triggered by emotional upset or loud noises, such as alarm clocks or telephones. LQT3 usually shows long-ST segments, which are responsible for the long-QT interval, and arrhythmia events commonly occur at rest or during sleep. T wave abnormalities are often present in all three types. There is overlap between these types in terms of ECG and clinical presentation. Figure 18-29 illustrates the three main types of congenital LQTS.

Figure 18-29. Representative V leads from the three major types of LQTS. The LQT1 patient is a 2-year-old girl who is in second-degree AV block with 2:1 conduction. The LQT2 patient is a 13-year-old girl who had a cardiac arrest at a slumber party. The LQT3 patient is a 17-year-old boy who had a “seizure.”
Patients with congenital LQTS often present in childhood or in their teens. They may be asymptomatic and their LQTS is incidentally discovered when they are screened after a syncopal episode or when a family member is diagnosed with LQTS. Symptoms can range from palpitations and dizziness to seizures to cardiac arrest. The diagnosis is made by family history and a careful review of symptoms, triggering events if they can be identified, and the ECG. Genetic testing can identify the genotype and help direct therapy.
Treatment depends on severity of symptoms and risk stratification. Lifestyle modifications include avoiding competitive sports and extreme exertion, especially swimming in LQT1 patients. Patients with LQT2 should avoid startling loud noises such as alarm clocks or telephones. Hypokalemia and hypomagnesemia must be avoided, and electrolyte loss due to vomiting, sweating, etc, should be replaced. All LQTS patients should avoid drugs known to prolong the QT interval. Beta-blockers are the mainstay of medical therapy for all patients with LQTS and are especially effective in decreasing the incidence of exercise-induced events and SCD in LQT1 and LQT2 patients. They are less effective in LQT3. ICD implantation is a class I recommendation for any patient who has had a cardiac arrest owing to VT or VF in which no reversible cause is identified. ICD is a class IIa recommendation for patients with long-QT syndrome who have syncope and/or VT while receiving beta-blockers.
ADVANCED ARRHYTHMIA INTERPRETATION
The study of cardiac rhythms provides a never-ending challenge to those interested in learning about arrhythmias. In most basic ECG classes the content presented is limited to basic rhythms originating in the sinus node, atria, AV junction, and ventricles, and to basic AV conduction abnormalities. Rarely does time permit the inclusion of more advanced concepts. This section discusses some of these more advanced concepts of arrhythmia interpretation and provides clues to aid in recognition of selected arrhythmias not usually covered in a basic course.
Supraventricular Tachycardias
Supraventricular tachycardia (SVT) describes a rapid rhythm that arises above the level of the ventricles (atria or AV junction) or utilizes the atria or AV node as part of the circuit that maintains the tachycardia but whose exact origin is not known. Usually, SVT is used to describe a narrow QRS tachycardia where atrial activity (P waves) cannot be identified, and therefore the origin of the tachycardia cannot be determined from the surface ECG. The presence of the narrow QRS indicates the supraventricular origin of the rhythm and conduction through the normal His-Purkinje system into the ventricles.
Sometimes SVT conducts with bundle branch block, which results in a wide QRS but does not change the fact that the rhythm is supraventricular in origin. Thus, SVT can be used for narrow QRS tachycardias whose mechanism is uncertain or for wide QRS tachycardias that are known to be coming from above the ventricles.
Supraventricular tachycardias can be classified into those that are AV nodal passive and those that are AV nodal active. AV nodal passive SVTs are those in which the AV node is not required for the maintenance of the tachycardia but serves only to passively conduct supraventricular impulses into the ventricles. Examples of AV nodal passive arrhythmias include atrial tachycardia, atrial flutter, and atrial fibrillation, all of which originate within the atria and do not need the AV node to sustain the atrial arrhythmia. In these rhythms, the AV node passively conducts the atrial impulses into the ventricles but does not participate in the maintenance of the arrhythmia itself. AV nodal active tachycardias require participation of the AV node in the maintenance of the tachycardia. The two most common causes of a regular, narrow QRS tachycardia are AV nodal reentry tachycardia and circus movement tachycardia using an accessory pathway, both of which require the active participation of the AV node in maintaining the tachycardia.
Atrial fibrillation is a supraventricular rhythm that is usually easily recognized because of its irregularity, but atrial tachycardia, atrial flutter, junctional tachycardia, AV nodal reentry tachycardia, and circus movement tachycardia can all present as regular, narrow QRS tachycardias whose mechanism often cannot be determined from the ECG. Because AV nodal reentry tachycardia and circus movement tachycardia are the most common causes of a regular, narrow QRS tachycardia, they are discussed in detail here.
Atrioventricular Nodal Reentry Tachycardia
In people with AV nodal reentry tachycardia (AVNRT), the AV node has two pathways that are capable of conducting the impulse into the ventricles. One pathway conducts more rapidly and has a longer refractory period than the other pathway (Figure 18-30A). In AVNRT, a reentry circuit is set, usually using a slowly conducting pathway just outside the body of the AV node as the antegrade limb into the ventricle and the faster conducting pathway in the AV node as the retrograde limb back into the atria (Figure 18-30C).
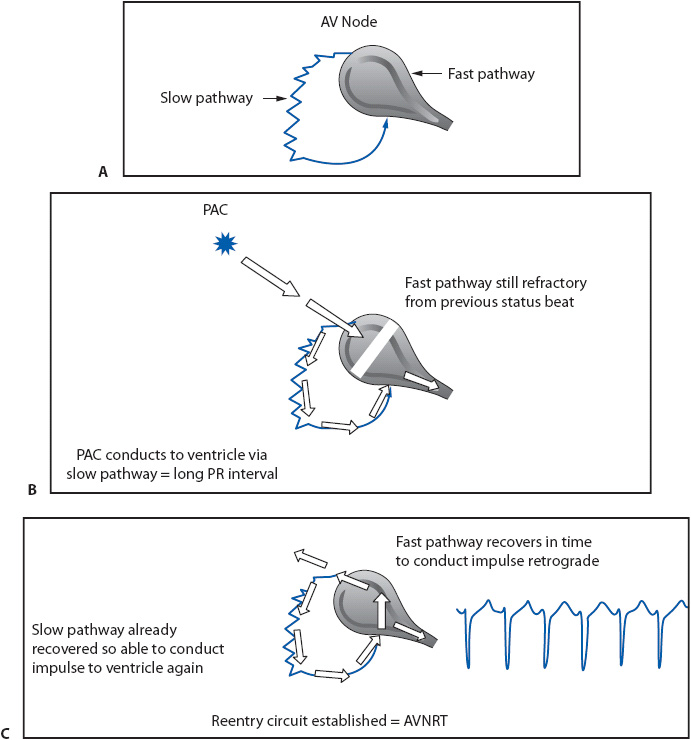
Figure 18-30. Mechanism of AVNRT. (A) Illustrates the dual AV nodal pathways responsible for AVNRT. The normal AV node is the fast-conducting pathway with a long refractory period; the slow-conducting pathway lies outside the AV node and has a shorter refractory period. (B) A PAC finds the fast pathway still refractory but is able to conduct through the slow pathway. (C) When the impulse arrives at the end of the slow pathway, it finds the AV node recovered and ready to conduct retrograde to the atria. The slow pathway has already recovered due to its short refractory period and is able to conduct the same impulse back into the ventricle. This sets up the reentry circuit and causes AVNRT.
The sinus impulse normally conducts down the fast pathway into the ventricles, resulting in a normal PR interval of 0.12 to 0.20 second. If a PAC occurs and enters the AV node before the fast pathway with its longer refractory period has recovered its ability to conduct, the impulse conducts down the slow pathway into the ventricle because of its shorter refractory period (Figure 18-30B). This slow conduction causes the PR interval of the PAC to be longer than the PR interval of sinus beats. The long conduction time through the slow pathway allows the fast pathway time to recover, making it possible for the impulse to conduct backward through the fast pathway into the atria. This returning impulse may then reenter the slow pathway, which is again ready to conduct antegrade because of its short refractory period, thus setting up a reentry circuit within the AV node and resulting in AVNRT. Figure 18-30C illustrates the mechanism of the most common type of AVNRT in which antegrade conduction occurs over the slow pathway and retrograde conduction over the fast pathway. The resulting rhythm is usually a narrow QRS tachycardia because the ventricles are activated through the normal His-Purkinje system. P waves are either not seen at all or are barely visible peeking out at the tail end of the QRS complex because the atria and ventricles depolarize almost simultaneously (Figure 18-31A and B). In the presence of preexisting bundle branch block or rate-dependent bundle branch block, the QRS in AVNRT is wide.
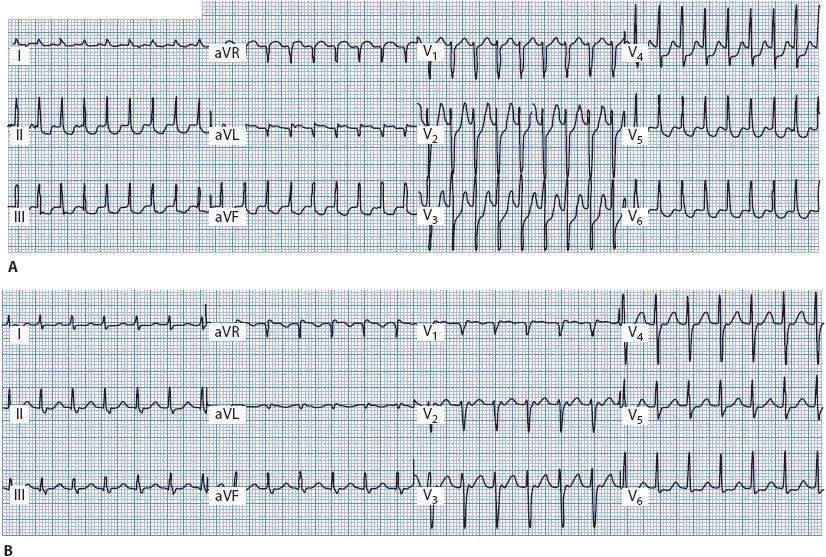
Figure 18-31. (A) AVNRT, rate 214. No P waves are visible. (B) AVNRT, rate 150. P waves distort the end of the QRS complex in leads II, III, aVF, and V1 to V3. (From: Jacobson C. Arrhythmias and conduction disturbances. In: Woods SL, Froelicher ES, Motzer SA, Bridges EJ, eds. Cardiac Nursing. 3rd ed. Philadelphia, PA: JB Lippincott; 1995:341.)
In about 4% of cases of AVNRT, the impulse conducts antegrade into the ventricle through the fast pathway and retrograde into the atria through the slow pathway, reversing the circuit within the AV node. This reversal of the circuit in the AV node results in P waves that appear immediately in front of the QRS because atrial activation is delayed because of slow conduction backward through the slow pathway. These P waves are inverted in inferior leads because the atria depolarize in a retrograde direction.
Treatment
AV nodal reentry tachycardia is an AV nodal active SVT because the AV node is required for the maintenance of the tachycardia. Therefore, anything that causes block in the AV node, such as vagal stimulation or drugs like adenosine, beta-blockers, or calcium channel blockers, can terminate the rhythm. AVNRT is usually well tolerated unless the rate is extremely rapid. Episodes can become frequent and, if not controlled with drugs, can interfere with lifestyle. Many people learn to stop the rhythm by coughing or breath holding, which stimulates the vagus nerve. Acute medical treatment involves administering any drug that blocks AV node conduction, but adenosine is usually used first because of its rapid effect, short duration of action, and lack of significant side effects. RF ablation can destroy the slow pathway and prevent recurrence of the arrhythmia. Refer to Table 3-4 in Chapter 3 for recommendations on management of AVNRT.
Circus Movement Tachycardia
Circus movement tachycardia is an SVT that occurs in people who have accessory pathways (see the section Preexcitation Syndromes earlier). AV reentrant tachycardia (AVRT) is also used to describe this arrhythmia, but to avoid confusion between AVRT and AVNRT, circus movement tachycardia is used here.
In circus movement tachycardia, an impulse travels a reentry circuit that involves the atria, AV node, ventricles, and accessory pathway. Orthodromic is used to describe the most common type of circus movement tachycardia, in which the impulse travels antegrade through the AV node into the ventricles and retrograde back into the atria through the accessory pathway (Figure 18-32A). The result is a regular, narrow QRS tachycardia because the ventricles are activated through the normal His–Purkinje system. In the presence of bundle branch block, a wide QRS pattern is present. Because the atria and ventricles depolarize separately, P waves, if visible at all, are seen following the QRS complex in the ST segment or between two QRS complexes, usually closest to the first QRS.
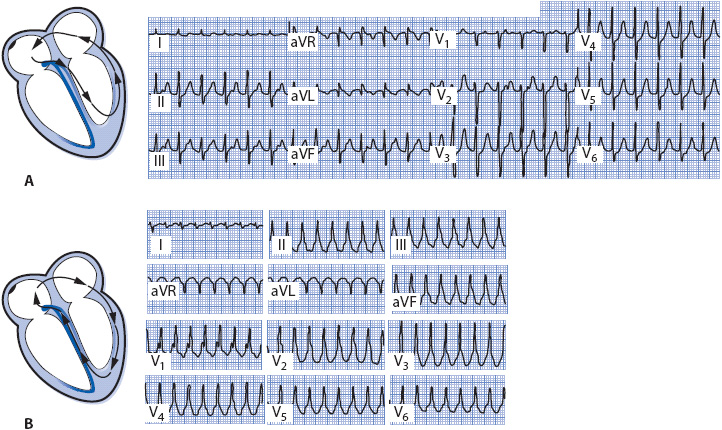
Figure 18-32. (A) Orthodromic circus movement tachycardia. P waves are visible on the upstroke of the T wave in leads II, III, aVF, and V1 to V3. (From: Jacobson C. Arrhythmias and conduction disturbances. In: Woods SL, Froelicher ES, Motzer SA, Bridges EJ, eds. Cardiac Nursing. 3rd ed. Philadelphia, PA: JB Lippincott; 1995:342.) (B) Antidromic circus movement tachycardia.
Antidromic describes the rare form of circus movement tachycardia in which the accessory pathway conducts the impulse from atria to ventricles and the AV node conducts it retrograde back to the atria (Figure 18-32B). Antidromic circus movement tachycardia is a regular wide QRS tachycardia because the ventricles depolarize abnormally through the accessory pathway. This form of SVT is often indistinguishable from ventricular tachycardia on the ECG.
Treatment
Circus movement tachycardia is an AV nodal active tachycardia because the AV node is necessary for maintenance of the arrhythmia. Vagal maneuvers and drugs that block AV conduction can be used to terminate an episode of tachycardia. Acute treatment is aimed at slowing conduction through the AV node with a vagal maneuver or drugs such as adenosine, beta-blockers, or calcium channel blockers, or at slowing accessory pathway conduction with drugs like procainamide or amiodarone. Catheter ablation of the accessory pathway is the only class I recommendation for long-term management of CMT. Class IIa recommendations include flecainide, propafenone, sotalol, amiodarone, and beta-blockers.
Atrial Fibrillation in Wolff-Parkinson-White Syndrome
Atrial fibrillation occurs more frequently in people with accessory pathways than in the general population and can be life threatening. Atrial flutter and fibrillation are especially dangerous in the presence of an accessory pathway because the pathway can conduct impulses rapidly and without delay into the ventricles, resulting in dangerously fast ventricular rates (Figure 18-33). These rapid ventricular rates can degenerate into ventricular fibrillation and result in sudden death. When atrial fibrillation is the mechanism of the tachycardia in Wolff-Parkinson-White syndrome, the QRS complex is wide and bizarre due to conduction of the impulses into the ventricle through the bypass tract. The ventricular response to the atrial fibrillation is irregular and very rapid, often approaching rates of 300 beats/min or more because of lack of delay in conduction through the accessory pathway. Atrial fibrillation with accessory pathway conduction must be recognized and differentiated from atrial fibrillation conducting through the AV node because treatment is different for the two situations. When accessory pathway conduction is known or suspected, flecainide, ibutilide, or procainamide are recommended because they prolong the refractory period of the accessory pathway and slow ventricular rate, and they may convert the atrial fibrillation to sinus rhythm.
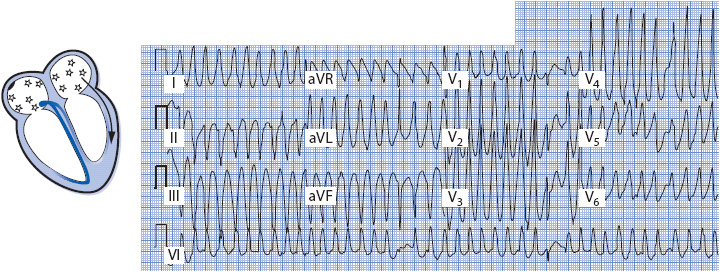
Figure 18-33. Atrial fibrillation conducting into the ventricle through an accessory pathway. Note the extremely short RR intervals in the V leads. QRS is fast, wide, and irregular.
Verapamil often is used to slow AV conduction in atrial fibrillation conducting into the ventricles through the AV node, but can be very dangerous and even lethal when used in the presence of an accessory pathway. Digitalis, verapamil, and diltiazem can shorten the refractory period in the accessory pathway, resulting in even faster ventricular rates and degeneration into ventricular fibrillation. In addition, the hypotensive effects of these agents may intensify the hypotension related to the arrhythmia’s rapid ventricular rate.
Polymorphic Ventricular Tachycardias
Polymorphic ventricular tachycardia (PVT) refers to VT with unstable, continuously varying QRS morphology often occurring at rates of approximately 200 beats/min. It can occur in short repetitive runs, longer sustained runs, or can degenerate into VF and cause sudden cardiac death. PVT can be classified based on whether it is associated with a normal or prolonged QT interval.
Polymorphic VT with a normal QT interval can occur in the presence of ventricular ischemia during acute coronary syndrome or following MI, although it is not a common arrhythmia. Figure 18-34 shows PVT in a patient during acute anterior-wall MI. Therapy of PVT associated with ischemia should be directed toward relieving the ischemia by either surgery or angioplasty. Beta-blockers are recommended for PVT if ischemia is suspected. For recurrent PVT in the absence of a long-QT interval, IV amiodarone is useful and lidocaine may be helpful. If PVT becomes sustained or degenerates to VF, defibrillation with an unsynchronized shock is necessary. Table 3-6 in Chapter 3 summarizes recommendations for managing PVT.

Figure 18-34. Polymorphic VT with a normal QT interval. This patient was having an acute MI (note ST elevation in lead V1).
Torsades de pointes means “twisting of the points” and describes polymorphic VT that occurs with abnormal ventricular repolarization. This abnormal repolarization presents on the ECG as an abnormally prolonged QT or QTU interval. See the section on long-QT syndromes in this chapter for more information on long-QT syndromes.
Characteristic ECG findings of TdP include: (1) markedly prolonged QT intervals with wide TU waves; (2) initiation of the arrhythmia by an R-on-T PVC with a long coupling interval; and (3) wide, bizarre, multiform QRS complexes that change direction frequently, appearing to twist around the isoelectric line (Figure 18-35). Ventricular rate during TdP is commonly 200 to 250 beats/min. TdP is usually self-terminating and occurs in repeated episodes, but it can deteriorate into ventricular fibrillation.
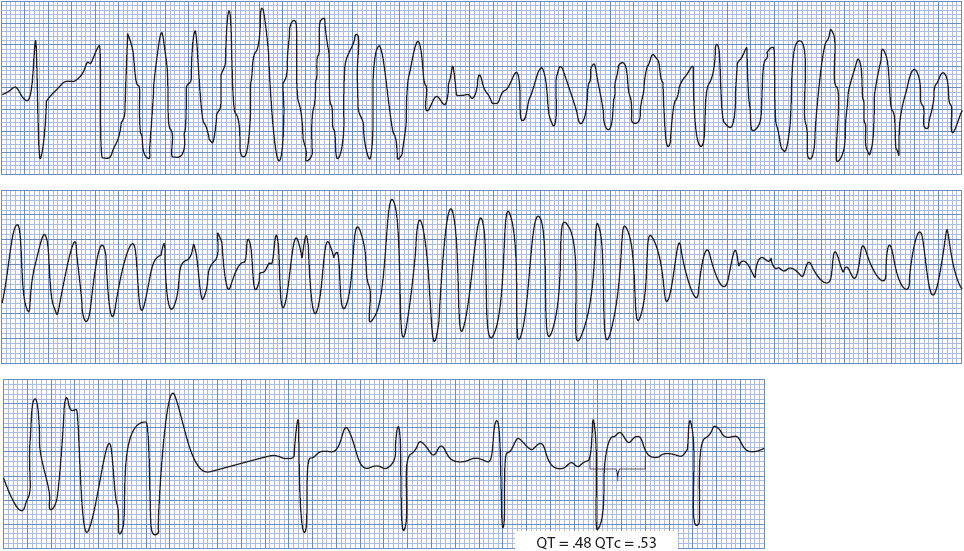
Figure 18-35. Torsades de pointes. Note characteristic “twisting” appearance during VT and the long-QT interval during sinus rhythm.
Differentiating Wide QRS Beats and Rhythms
Determining the origin of a wide QRS beat or a wide QRS tachycardia is one of the most common problems encountered when caring for monitored patients. A supraventricular beat with abnormal, or aberrant, conduction through the ventricles, can look almost identical to a beat that originates in the ventricle. The problem with aberration is that it can mimic ventricular arrhythmias, which require different therapy and carry a different prognosis than aberrancy. Aberrancy is always secondary to some other primary disturbance and does not itself require treatment. Nurses must be able to identify accurately which mechanism is responsible for the wide QRS rhythm being observed whenever possible, initiate appropriate treatment when needed, and avoid inappropriate treatment.
Mechanisms of Aberration
Aberrancy is the temporary abnormal intraventricular conduction of supraventricular impulses. Aberration occurs whenever the His-Purkinje system or ventricle is still partly refractory when a supraventricular impulse attempts to travel through it. The refractory period of the conduction system is directly proportional to preceding cycle length. Long cycles are followed by long refractory periods, and short cycles are followed by short refractory periods. An early supraventricular beat, such as a PAC, may enter the conduction system during a portion of its refractory period, forcing conduction through the ventricles to occur in an abnormal manner. Beats that follow a sudden lengthening of the cycle may conduct aberrantly because of the increased length of the refractory period that occurs when the cycle lengthens (Figure 18-36). The right bundle branch has a longer refractory period than the left; therefore, aberrant beats tend to conduct most often with an RBBB pattern, although LBBB aberration is common in people with cardiac disease.
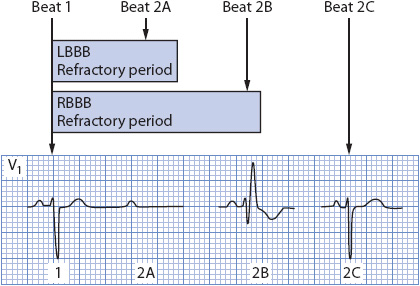
Figure 18-36. Diagram of refractory periods in the bundle branches and the effect of cycle length on conduction. The right bundle has a longer refractory period than the left. Beat 2A occurs so early that it cannot conduct through either bundle branch. Beat 2B encounters a refractory right bundle and conducts with RBBB. Beat 2C falls outside the refractory period of both bundles and is able to conduct normally.
Electrocardiographic Clues to the Origin of Wide QRS Beats and Rhythms P Waves
If P waves can be seen during a wide QRS tachycardia, they are very helpful in making the differential diagnosis of aberration vs ventricular ectopy. Atrial activity, represented by the P wave on the ECG and preceding a wide QRS beat or run of tachycardia, strongly favors a supraventricular origin of the arrhythmia. Figure 18-37 shows three wide QRS beats that could easily be mistaken for PVCs if not for the obvious presence of the early P wave initiating the run.

Figure 18-37. Sinus rhythm with PACs and three wide QRS beats that could be mistaken for ventricular tachycardia. Note the P waves preceding the wide QRS complexes, indicating aberrant conduction. (From: Jacobson C. Arrhythmias and conduction disturbances. In: Woods SL, Froelicher ES, Motzer, SA, Bridges EJ, eds. Cardiac Nursing. 3rd ed. Philadelphia, PA: JB Lippincott; 1995:346.)
An exception to the preceding P-wave rule occurs with end-diastolic PVCs. End-diastolic PVCs occur at the end of diastole, after the sinus P wave has been recorded but before it has a chance to conduct through the AV node into the ventricle. Figure 18-38 shows sinus rhythm with an end-diastolic PVC occurring immediately after the sinus P wave. Here, the P wave preceding the wide QRS is merely a coincidence and does not indicate aberrant conduction. The PR interval is much too short to have conducted that QRS complex. In addition, the P wave preceding the wide QRS is not early; it is the regularly scheduled sinus beat coming on time. Thus, early P waves that precede early wide QRS complexes are usually “married to” those QRSs and indicate aberrant conduction, while “on-time” P waves in front of end-diastolic PVCs are not early and do not cause the wide QRS.

Figure 18-38. Sinus rhythm with an end-diastolic PVC. The P wave preceding the PVC is the sinus P wave that coincidentally occurs just before the PVC. (From: Jacobson C. Arrhythmias and conduction disturbances. In: Woods SL, Froelicher ES, Motzer SA, Bridges EJ, eds. Cardiac Nursing. 3rd ed. Philadelphia, PA: JB Lippincott; 1995:347.)
P waves seen during a wide QRS tachycardia also can be very helpful in making the differential diagnosis between SVTs with aberration and ventricular tachycardia. If P waves are seen associated with every QRS, the rhythm is supraventricular in origin (Figure 18-39A). P waves that occur independently of the QRS and have no consistent relationship to QRS complexes indicate the presence of AV dissociation, which means that the atria and the ventricles are under the control of separate pacemakers and strongly favors ventricular tachycardia (Figure 18-39B).
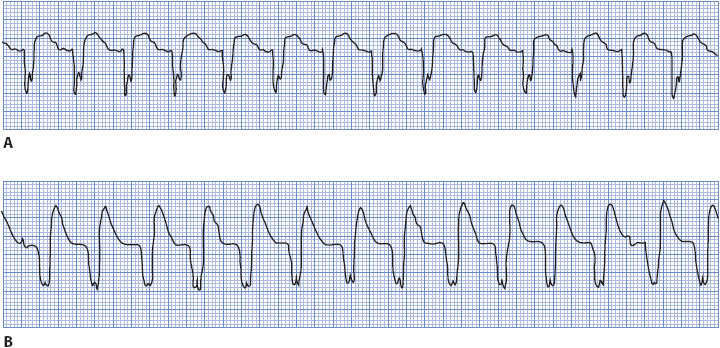
Figure 18-39. Two very similar, wide QRS tachycardias. (A) Sinus tachycardia, rate 115. P waves can be seen on the downslope of the T wave preceding each QRS, indicating a supraventricular origin of the tachycardia. (B) P waves are independent of QRS complexes, indicating AV dissociation, which favors ventricular tachycardia. (From: Jacobson C. Arrhythmias and conduction disturbances. In: Woods SL, Froelicher ES, Motzer SA, Bridges EJ, eds. Cardiac Nursing. 3rd ed. Philadelphia, PA: JB Lippincott; 1995:347.)
QRS Morphology
The shape of the QRS complex is very helpful in determining the origin of a wide QRS rhythm. When using QRS morphology clues, it is extremely important to examine the correct leads and apply the criteria only to leads that have been proven helpful. Many practitioners prefer to monitor with lead II because usually it shows an upright QRS complex and clear P wave. Lead II, however, has no value in determining the origin of a wide QRS rhythm. The single best arrhythmia monitoring lead is V1, followed by V6 and V2 in certain situations.
When applying QRS morphology criteria for wide QRS rhythms, it is helpful to first decide whether the QRS complexes have an RBBB morphology or an LBBB morphology. RBBB morphology rhythms have an upright QRS in lead V1, while LBBB morphology rhythms have a negative QRS complex in V1.
When dealing with a wide QRS rhythm of RBBB morphology (upright in V1), follow these steps to evaluate QRS morphology (Figures 18-40 and 18-41A):
1. Look at V1 and determine if the upright QRS complex is monophasic (R wave), diphasic (qR), or triphasic (rsR′). Monophasic and diphasic complexes favor a ventricular origin, if the left peak (“rabbit ear”) is taller. A taller right rabbit ear does not favor either diagnosis. A triphasic rsR′ is typical of RBBB aberration in V1.
2. Look at V6 and determine whether the QRS is monophasic (all negative QS), diphasic (rS), or triphasic (qRs). A monophasic or diphasic complex in V6 favors a ventricular origin, and the triphasic qRs complex is typical of RBBB aberration in V6.
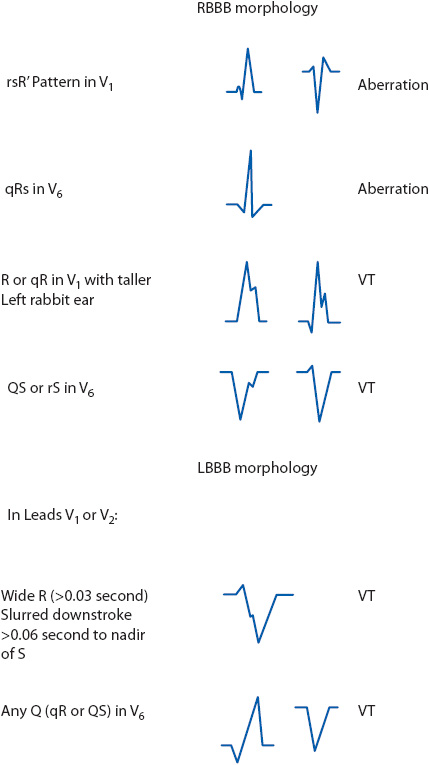
Figure 18-40. Morphology clues for wide QRS beats and rhythms with RBBB and LBBB patterns. (From: Jacobson C. Arrhythmias and conduction disturbances. In: Woods SL, Froelicher ES, Motzer SA, Bridges EJ, eds. Cardiac Nursing. 3rd ed. Philadelphia, PA: JB Lippincott; 1995:348.)
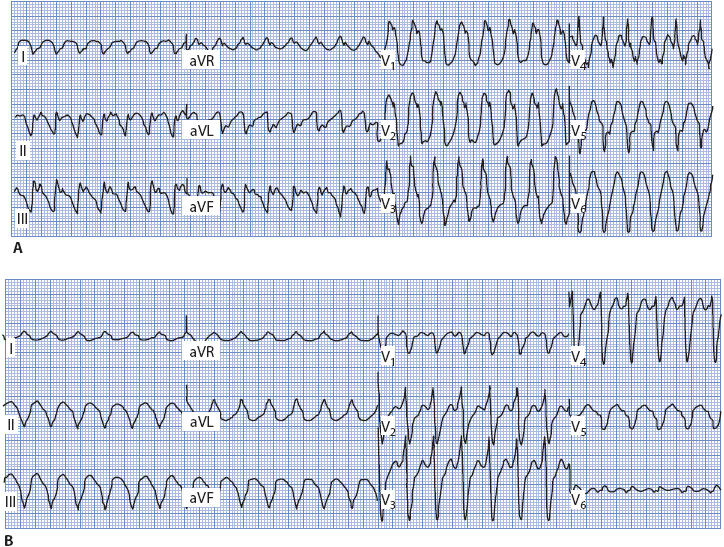
Figure 18-41. 12-lead ECG of ventricular tachycardia. (A) With RBBB morphology. Note monophasic R wave with taller left rabbit ear in V1 and QS complex in V6. (B) With LBBB morphology. Note wide R wave in V1 and V2, and qR pattern in V6.
If the QRS has an LBBB morphology (negative in V1), follow these steps to evaluate morphology (Figures 18-40 and 18-41B):
1. Look at V1 or V2 (both are helpful in this case) and determine if the R wave (if present) is wide or narrow. A wide R wave of more than 0.03 second favors a ventricular rhythm, and a narrow R wave favors a supraventricular origin with LBBB aberration.
2. Next look at the downstroke of the S wave in V1 or V2. Slurring or notching on the downstroke favors a ventricular origin. LBBB aberration typically slurs on the upstroke if it slurs at all.
3. Measure from the onset of the QRS complex to the deepest part of the S wave in V1 or V2. A measurement of more than 0.06 second favors a ventricular rhythm and a narrower measurement favors LBBB aberration. Note that this measurement can be prolonged due to either a wide R wave or slurring on the downstroke of the S wave, either one of which favors the ventricular origin of the rhythm.
4. Look at V6 and determine whether a Q wave is present. Any Q wave (either a QS or qR complex) favors a ventricular origin.
Concordance
Concordance means that all the QRS complexes across the precordium from V1 through V6 point in the same direction; positive concordance means they are all upright, and negative concordance means they are all negative (Figure 18-42A). Negative concordance favors a diagnosis of ventricular tachycardia when it occurs in a wide QRS tachycardia, and positive concordance favors ventricular tachycardia as long as Wolff-Parkinson-White syndrome can be ruled out.
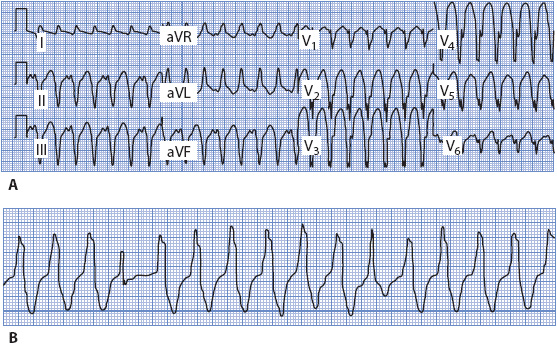
Figure 18-42. (A) 12-lead ECG of ventricular tachycardia with negative concordance. (B) Rhythm strip of ventricular tachycardia with fusion beats.
Fusion and Capture Beats
Ventricular fusion beats occur when the ventricles are depolarized by two different wavefronts of electrical activity at the same time. Fusion often results when a supraventricular impulse travels through the AV node and begins to depolarize the ventricles at the same time that an impulse from a ventricular focus depolarizes the ventricles. When two different impulses contribute to ventricular depolarization, the resulting QRS shape and width are determined by the relative contributions of both the supraventricular and the ventricular impulses. In the presence of a wide QRS tachycardia, the presence of fusion beats indicates AV dissociation, which means that the atria and ventricles are under the control of separate pacemakers. Capture beats occur when the supraventricular impulse manages to conduct all the way into and through the ventricle, depolarizing (“capturing”) the ventricle and resulting in a normal QRS in the midst of the wide QRS tachycardia. The presence of fusion and capture beats in a wide QRS tachycardia is strong evidence supporting the diagnosis of ventricular tachycardia, but they occur rarely and cannot be counted on to make the diagnosis. Figure 18-42B shows fusion beats in a wide QRS tachycardia. Helpful ECG clues for differentiating aberrancy from ventricular ectopy are summarized in Table 18-3.
TABLE 18-3. ECG CLUES FOR DIFFERENTIATING ABERRATION FROM VENTRICULAR ECTOPY

ST-SEGMENT MONITORING
Many bedside monitors have software programs that allow for continuous monitoring of the ST segment in addition to routine arrhythmia monitoring. Continuous ST-segment monitoring can detect ischemia related to reocclusion of the involved artery in patients with acute MI who have received thrombolytic therapy, angioplasty, or other interventional cardiologic procedures aimed at opening occluded coronary arteries. ST-segment monitoring is also useful in detecting silent ischemia (ischemic episodes that occur in the absence of chest pain or other symptoms) that would otherwise go unnoticed with symptom and arrhythmia monitoring alone. Early detection of ischemic changes is critical in identifying patients who need interventions to reestablish blood flow to myocardium before permanent damage occurs.
ST elevation in leads facing damaged myocardium is the ECG sign of myocardial injury. ST depression is often recorded as a reciprocal change in leads that do not directly face involved myocardium (see Table 18-2). In addition, ST depression can be recorded in leads facing ischemic tissue. Therefore, either ST elevation or ST depression indicates myocardium at risk for infarction and a patient potentially at risk for complications related to infarction. The sooner the artery is opened and blood flow reestablished to ischemic or injured tissue, the more myocardium is salvaged and the fewer complications and deaths occur.
Measuring the ST Segment
Clinically significant ST-segment deviation is defined as ST elevation or depression 1 mm or more from the baseline, or isoelectric line, measured 60 msec (0.06 second) after the J point. The J point is the point at which the QRS ends and the ST segment begins. Figure 18-43A illustrates a normal ST segment, and Figure 18-43B illustrates ST-segment elevation and depression.
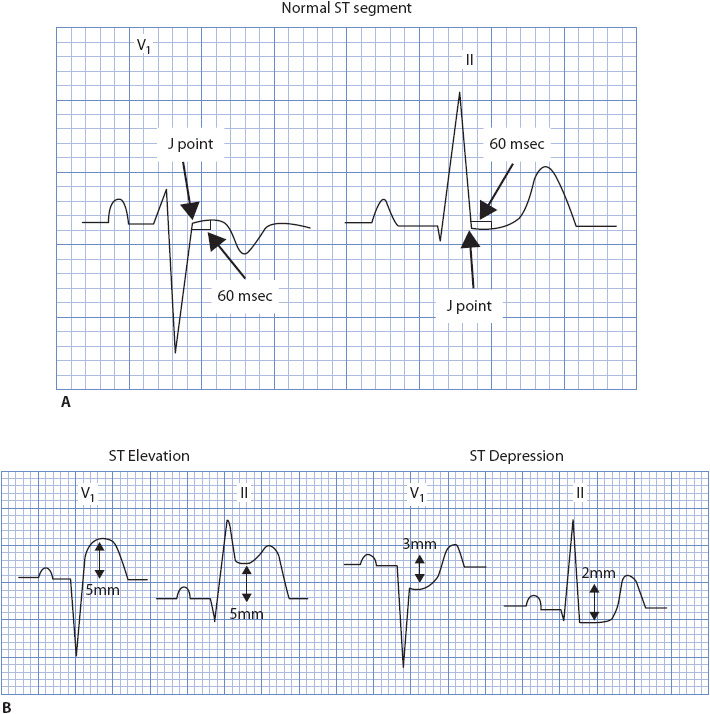
Figure 18-43. (A) Normal ST segment on the baseline in leads V1 and II. (B) ST-segment elevation and ST-segment depression.
ST-segment monitoring software in newer bedside monitors defines the baseline and the ST-segment measuring point. It also sets default alarm parameters so the equipment can audibly notify the nurse when the patient’s ST segment falls outside the defined parameters. Most monitors allow the user to redefine the baseline, reset the J point, choose where the ST segment is measured, and change the alarm parameters to account for individual patient variations. The monitor then displays the ST-segment measurement in millimeters on the screen, and most monitors also allow for trending of the ST segment over specified time intervals.
Choosing the Best Leads for ST-Segment Monitoring
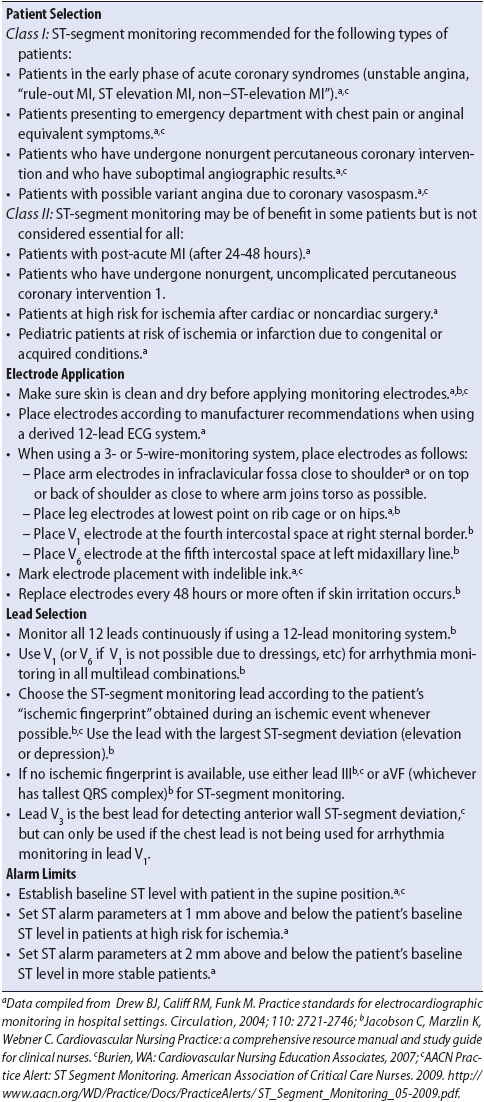
Some monitoring systems offer continuous 12-lead ECG monitoring, which eliminates the need to select the “best” leads to monitor for a given clinical situation. Most younger generation bedside monitors offer at least two leads for simultaneous ECG monitoring and some offer three leads. The single best lead for arrhythmia monitoring is V1, with V6 being next best. Using two or three leads for ST-segment monitoring is optimal because a single lead may miss significant ST-segment deviations. Since current bedside monitors allow for the use of only one V lead at a time, using V1 as the arrhythmia monitoring lead (or V6 if V1 is not available because of dressings, etc) means that limb leads must be used for ST-segment monitoring. The best limb leads are discussed below.
The best way to choose leads for ST-segment monitoring is to know the patient’s “ischemic fingerprint.” To determine the patient’s ischemic fingerprint, obtain a 12-lead ECG during a pain episode or with inflation of the balloon during angioplasty and note which leads show the most ST-segment displacement (either elevation or depression) during the acute ischemic event. Choose the lead or leads with the most ST-segment displacement as the bedside ST-segment monitoring leads.
If no ischemic fingerprint is available, use a lead or leads that have been determined through research to be best for the artery involved (Table 18-4). The limb leads that have been shown to best detect ischemia related to all three major coronary arteries (right coronary, left anterior descending, and circumflex) are leads III and aVF. In the case of the right coronary artery (RCA), leads III and aVF directly face the inferior wall supplied by this artery and record ST elevation with inferior wall injury. The left anterior descending and circumflex artery supply the anterior and lateral walls, respectively. Because these walls are not directly faced by leads III and aVF, ST-segment depression is recorded as a reciprocal change when anterior or lateral wall injury occurs. Table 18-5 summarizes critical elements of ST-segment monitoring.
TABLE 18-4. RECOMMENDED LEADS FOR CONTINUOUS ECG MONITORING
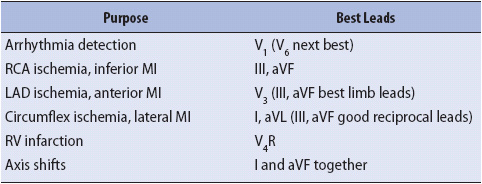
TABLE 18-5. EVIDENCE-BASED PRACTICE: ST-SEGMENT MONITORING
CARDIAC PACEMAKERS
Chapter 3, Interpretation and Management of Basic Cardiac Rhythms, describes the components of a temporary pacing system and basic pacemaker operation. This section discusses single-chamber and dual-chamber pacemaker function and evaluation of pacemaker rhythm strips for appropriate capture and sensing.
Cardiac pacemakers are classified by a standardized five-letter pacemaker code that describes the location of the pacing wire(s) and the expected function of the pacemaker. Table 18-6 illustrates the five-letter code. The first letter in the pacemaker code describes the chamber that is paced (A = atrium, V = ventricle, D = dual [atrium and ventricle], 0 = none). The letter in the second position describes the chamber where intrinsic electrical activity is sensed (A = atrium, V = ventricle, D = dual, 0 = none). The letter in the third position describes the pacemaker’s response to sensing of intrinsic electrical activity (I = inhibited, T = triggered, D = dual [inhibited or triggered], 0 = none). The fourth letter indicates the presence or absence of rate modulation, and the fifth letter describes multisite pacing functions. To know how a pacemaker should function, it is necessary to know at a minimum the first three letters of the code, which describe where the pacemaker is supposed to pace, where it is supposed to sense, and what it should do when it senses. The last two letters representing advanced pacemaker function are not covered in this text; see the recommended references at the end of the chapter.
TABLE 18-6. PACEMAKER CODES

Three types of temporary pacing are commonly used in critical care or telemetry settings. The first is transvenous pacing through a wire introduced into the apex of the right ventricle via a peripheral or central vein and set in the demand mode (sensitive to intrinsic ventricular activity). Ventricular pacing is always done in the demand mode to avoid the delivery of pacing stimuli into the vulnerable period of the cardiac cycle, which could induce ventricular tachycardia or fibrillation (see Chapter 3, Interpretation and Management of Basic Cardiac Rhythms). This type of pacing is described by the pacemaker code as a VVI pacemaker—it paces the ventricle, senses intrinsic ventricular electrical activity, and inhibits its output when sensing occurs.
The second type of pacing done in critical care or telemetry is temporary epicardial pacing (either atrial, ventricular, or dual chamber) via pacing wires attached to the atria and/or ventricles during cardiac surgery. If atrial pacing is done with no sensing of atrial electrical activity, also called asynchronous mode, the pacemaker operates as an A00 pacemaker—it paces the atria, does not sense, and therefore does not respond to intrinsic atrial activity. If atrial pacing is done with sensing of atrial electrical activity, also called the demand mode, the pacemaker operates as an AAI pacemaker—it paces the atria, senses atrial activity, and inhibits its output when it senses. Dual-chamber pacing can be done in several modes involving pacing and sensing functions in one or both chambers and described by the pacemaker code according to the mode chosen. The two most common dual-chamber modes used with temporary epicardial pacing (and occasionally with temporary transvenous pacing) are DVI (paces atria and ventricles, senses only in the ventricle, and inhibits pacing output when sensing occurs) and DDD (paces both chambers, senses both chambers, and either triggers or inhibits pacing output in response to sensing). The common dual-chamber pacing modes are listed in Table 18-7.
TABLE 18-7. DUAL-CHAMBER PACING MODES

The third type of temporary pacing is external (transcutaneous) pacing. External pacing is done in emergency situations requiring immediate pacing when placement of a temporary transvenous pacing wire is not feasible. External pacing is not as reliable as transvenous or epicardial pacing and is used as a temporary measure until transvenous pacing can be instituted. External pacing is briefly described in Chapter 3, Interpretation and Management of Basic Cardiac Rhythms.
Evaluating Pacemaker Function
Evaluating pacemaker function requires knowledge of the mode of pacing expected (VVI, AAI, etc); the minimum rate of the pacemaker, or pacing interval; and any other programmed parameters in the pacemaker. The basic functions of a pacemaker include stimulus release, capture, and sensing. Stimulus release refers to pacemaker output, or the ability of the pacemaker to generate and release a pacing impulse. Capture is the ability of the pacing stimulus to result in depolarization of the chamber being paced. Sensing is the ability of the pacemaker to recognize and respond to intrinsic electrical activity in the heart. Pacemaker operation is evaluated according to these three functions. Single-chamber pacemaker evaluation is much less complicated than dual-chamber evaluation. Because singlechamber ventricular pacing is a very common type of temporary pacing in critical care and telemetry units, VVI pacemaker evaluation is discussed here.
VVI Pacemaker Evaluation
Stimulus release, capture, and sensing must all be assessed when evaluating VVI pacemakers. A VVI pacemaker is expected to pace the ventricle at the set rate unless spontaneous ventricular activity occurs to inhibit pacing. The set rate of the pacemaker, or pacing interval, is measured from one pacing stimulus to the next consecutive stimulus. Pacemakers have a refractory period, which is a period following either pacing or sensing in the chamber, during which the pacemaker is unable to respond to intrinsic activity. During the refractory period, the pacemaker in effect has its eyes closed and is not able to see spontaneous activity. In a normally functioning VVI pacemaker, pacing spikes occur at the set pacing interval and each spike results in a ventricular depolarization (capture). If spontaneous ventricular activity occurs (either a normally conducted QRS or a PVC), that activity is sensed and the next pacing stimulus is inhibited. Figure 18-44A and B shows normal VVI pacemaker function.
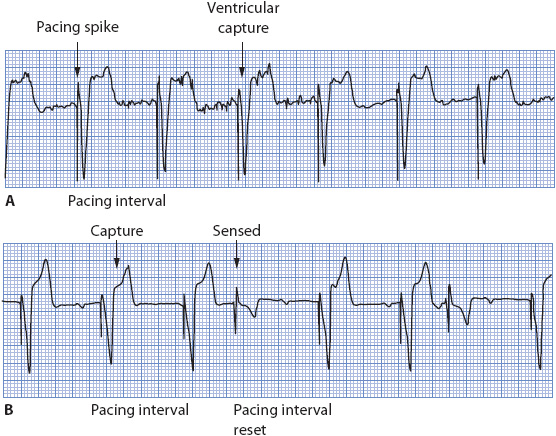
Figure 18-44. Normal VVI pacemaker function. (A) Pacing electrical activity (“pacer spike”) followed by a wide QRS complex indicating ventricular capture. Pacemaker sensing cannot be evaluated because no intrinsic QRS complexes are present. (B) Pacemaker capture and sensing both normal. Intrinsic QRS complexes are sensed, inhibiting ventricular pacing output, and resetting the pacing interval. Absence of intrinsic ventricular electrical activity causes pacing to occur with capture.
Stimulus Release
Stimulus release depends on a pacemaker with enough battery power to generate the electrical impulse, and on an intact pacemaker lead system to deliver the electrical stimulus to the heart. The presence of a pacer spike on the rhythm strip or monitor indicates that the stimulus was released from the generator and entered the body. The presence of the spike does not indicate where the stimulus was delivered (eg, atria or ventricles), only that it entered the body somewhere. Total absence of pacing stimuli, when they should be present, can indicate a faulty pulse generator or battery, or a break or disconnection in the lead system. Pacing stimuli also can be absent when pacing is inhibited by the sensing of intrinsic electrical activity. Figure 18-45 illustrates total loss of stimulus release in a patient whose pacemaker battery was depleted.

Figure 18-45. Absence of stimulus release in a patient with a permanent pacemaker. Underlying rhythm is atrial fibrillation with complete AV block and a very slow ventricular rate. The battery in the pacemaker generator was depleted.
Capture
Capture is indicated by a wide QRS complex immediately following the pacemaker spike and represents the ability of the pacing stimulus to depolarize the ventricle. Loss of capture is recognized by the presence of pacer spikes that are not followed by paced ventricular complexes (Figure 18-46). Causes of loss of capture include:
• Inadequate stimulus strength, which can be corrected by increasing the electrical output of the pacemaker (turning up the milliampere level).
• Pacing wire out of position and not in contact with myocardium, which can be corrected by repositioning the wire and sometimes the patient.
• Pacing lead positioned in infarcted tissue, which can be corrected by repositioning the wire to a place where the myocardium is not injured and is capable of responding to the stimulus.
• Electrolyte imbalances or drugs that alter the ability of the heart to respond to the pacing stimulus.
• Delivery of a pacing stimulus during the ventricles refractory period when the heart is physiologically unable to respond to the stimulus. This problem occurs with loss of sensing (undersensing) and can be corrected by correcting the sensing problem (Figure 18-47A).
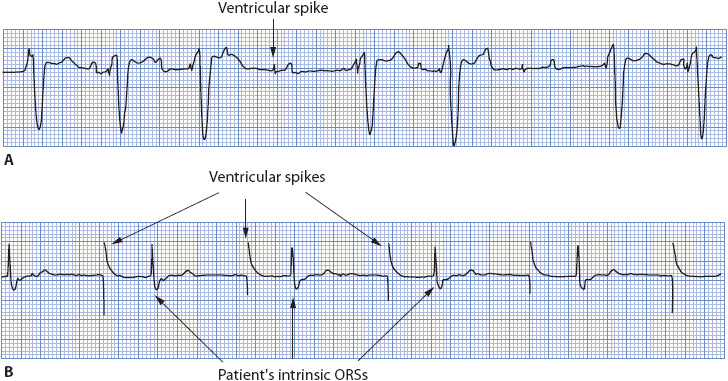
Figure 18-46. (A) VVI pacemaker with intermittent loss of capture. (B) VVI pacemaker with total loss of capture.
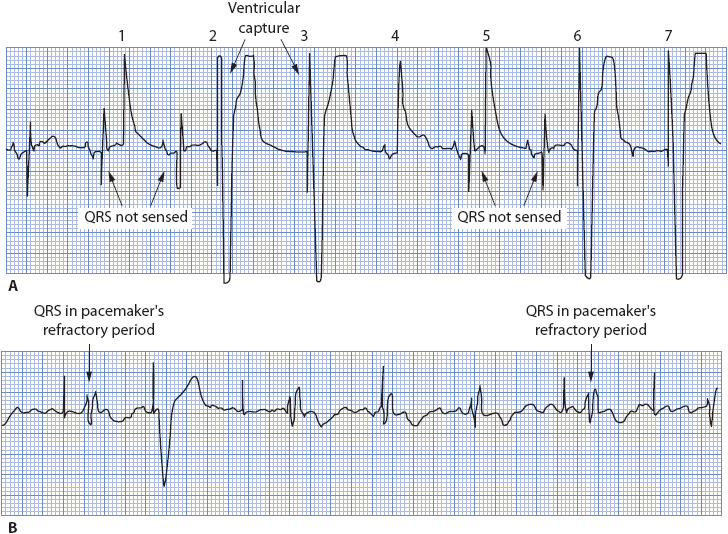
Figure 18-47. (A) Intermittent loss of sensing in a VVI pacemaker. Delivery of the pacing stimulus during the heart’s refractory period makes it appear that capture is lost as well. Because the heart is physiologically unable to respond to the pacing stimulus when it falls in the refractory period, this is not a capture problem. Pacer spikes 1, 2, 5, and 6 should not have occurred; their presence is due to loss of sensing. Pacer spike 4 occurred coincident with the normal QRS complex, resulting in a “pseudofusion” beat, and does not represent loss of sensing. (B) Loss of capture in a VVI pacemaker. Only one pacer spike captures the ventricle. Two QRS complexes occur during the pacemaker’s refractory period and thus are not sensed. This does not represent loss of sensing because the pacemaker has its “eyes closed” during the time intrinsic ventricular activity occurred.
Sensing
Sensing of intrinsic ventricular electrical activity inhibits the next pacing stimulus and resets the pacing interval. Sensing cannot occur unless the pacemaker is given the opportunity to sense. It must be in the demand mode and there must be intrinsic ventricular activity that occurs for the pacemaker to have an opportunity to sense. In Figure 18-44A, sensing cannot be evaluated because there is no intrinsic ventricular activity that occurs, and therefore the pacemaker is not given an opportunity to sense. In Figure 18-44B, the occurrence of two spontaneous QRS complexes provides the pacemaker with an opportunity to sense. In this example, sensing occurred normally, as indicated by the absence of the next expected pacing stimulus and resetting of the pacing interval by the intrinsic QRS complex.
Two sensing problems can occur: undersensing (Figure 18-47A and 18-48A) and oversensing (Figure 18-48B). Undersensing, also called “failure to sense” or “loss of sensing,” can be caused by:
• Asynchronous (fixed rate) mode in which the sensing circuit is off. This problem can be corrected by turning the sensitivity control to the demand mode.
• Pacing catheter out of position or lying in infarcted tissue, which can be corrected by repositioning the wire. Pacing wire repositioning must be done by a physician; however, turning the patient onto his or her side sometimes temporarily works when the pacing wire loses contact with the ventricle.
• Intrinsic QRS voltage too low to be sensed by the pacemaker. Turning the sensitivity control clockwise or decreasing the sensitivity number increases the sensitivity of the pacemaker and makes it able to “see” smaller intrinsic electrical signals. Repositioning the wire sometimes helps.
• Break in connections, battery failure, or faulty pulse generator. Check and tighten all connections along the pacing system, and replace the battery if it is low. A chest x-ray may detect wire fracture. Change the pulse generator if problems cannot be corrected any other way.
• Intrinsic ventricular activity falling in the pacemaker’s refractory period. If a spontaneous QRS complex occurs during the time the pacemaker has its eyes closed, the pacemaker cannot see it. This event occurs when the pacemaker fails to capture, which can allow an intrinsic QRS to occur during the pacemaker’s refractory period. This problem is due to loss of capture and does not reflect a sensing malfunction (see Figure 18-47B).
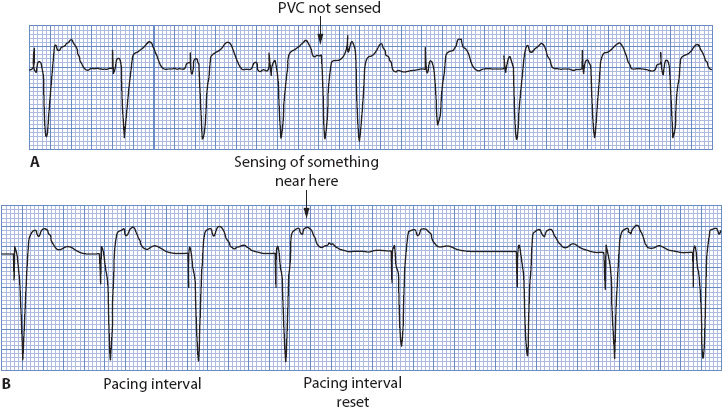
Figure 18-48. (A) Undersensing in a VVI pacemaker. The PVC is not sensed and pacing occurs at the programmed pacing interval, resulting in a pacemaker spike on the T wave of the PVC. (B) Oversensing in a VVI pacemaker. The pacing rate slows for two intervals, presumably due to sensing of something near the T wave, which resets the pacing interval from the point where sensing occurred.
Oversensing means that the pacemaker is so sensitive that it inappropriately senses internal or outside signals as QRS complexes and inhibits its output. Common sources of outside signals that can interfere with pacemaker function include electromagnetic or RF signals, or electronic equipment in use near the pacemaker. Internal sources of interference can include large P waves, large T-wave voltage, local myopotentials in the heart, or skeletal muscle potentials (see Figure 18-48B). Because a VVI pacemaker is programmed to inhibit its output when it senses, oversensing can be a dangerous situation in a pacemaker-dependent patient, resulting in ventricular asystole. Oversensing is usually due to the sensitivity control being set too high, which can be corrected by turning the sensitivity dial counterclockwise and reducing the pacemaker’s sensitivity. It is recommended that the sensitivity control be set between the 1 and 3 o’clock positions on the dial (about 2 mV) rather than all the way to the right, unless a higher sensitivity is required to make the pacemaker sense QRS complexes.
Stimulation Threshold Testing
The stimulation threshold is the minimum output of the pacemaker necessary to capture the heart consistently. The stimulation threshold changes over time; when the pacing lead is first placed, the stimulation threshold is usually very low. Over time, the threshold increases and it takes more output to result in capture. When caring for a patient with a temporary pacemaker, stimulation threshold testing should be done every shift until a stable threshold is reached. Once the threshold has been determined, set the output 2 to 3 times higher than threshold to ensure an adequate safety margin for capture. To determine the stimulation threshold, follow these steps:
• Verify that the patient is in a paced rhythm. The pacing rate may need to be temporarily increased to override an intrinsic rhythm.
• Watch the monitor continuously while slowly decreasing output by turning the output control counterclockwise.
• Note when the pacing stimulus no longer captures the heart (a pacing spike not followed by a paced beat).
• Slowly increase the output until 1:1 capture resumes. This is the stimulation threshold.
• Set the output 2 to 3 times higher than threshold (ie, if threshold is 2 mA, set output between 4 and 6 mA).
DDD Pacemaker Evaluation
Dual-chamber pacemakers have become very complicated, with multiple programmable parameters and varying functions depending on the manufacturer. It is impossible to present dual-chamber pacemaker function in detail in a single chapter. To understand dual-chamber pacemaker function, it is necessary to understand the timing cycles involved in dual-chamber pacing. More detailed information on dual chamber pacemaker function is available in the references at the end of this chapter. In this section, the major timing cycles are defined and basic DDD pacemaker evaluation is covered in a very generic manner, because each pacemaker is different depending on the manufacturer. Dual-chamber pacemakers can function in a variety of modes (see Table 18-7). Because the DDD mode is most commonly used, basic DDD function is described here.
According to the pacemaker code, DDD means that both chambers (atria and ventricles) are paced, both chambers are sensed, and the mode of response to sensed events is either inhibited or triggered, depending on which chamber is sensed. When atrial activity is sensed, pacing is triggered in the ventricle after the programmed AV delay. When ventricular activity is sensed, all pacemaker output is inhibited.
The following timing cycles determine dual-chamber pacemaker function:
• Pacing interval (or lower rate limit): The base rate of the pacemaker, measured between two consecutive atrial pacing stimuli. The pacing interval is a programmed parameter.
• AV delay (or AV interval): The amount of time between atrial and ventricular pacing, or the “electronic PR interval.” This is measured from the atrial pacing spike to the ventricular pacing spike and is a programmed parameter.
• Atrial escape interval (or VA interval): The interval from a sensed or paced ventricular event to the next atrial pacing output. The VA interval represents the amount of time the pacemaker waits after it paces in the ventricle or senses ventricular activity before pacing the atrium. The atrial escape interval is not a programmed parameter, but is derived by subtracting the AV delay from the pacing interval. Its length can be estimated by measuring from a ventricular spike to the next atrial pacing spike.
• Total atrial refractory period (TARP): The period of time following a sensed P wave or a paced atrial event during which the atrial channel will not respond to sensed events (ie, “has its eyes closed”). The TARP consists of the AV delay and the PVARP (see below).
• Postventricular atrial refractory period (PVARP): The period of time following an intrinsic QRS or a paced ventricular beat during which the atrial channel is refractory and will not respond to sensed atrial activity. PVARP is a programmable parameter but is not evident on a rhythm strip.
• Blanking period: The very short ventricular refractory period (VRP) that occurs with every atrial pacemaker output. The ventricular channel “blinks its eyes” so it does not sense the atrial output and inappropriately inhibits ventricular pacing. The blanking period is a programmable parameter but is not evident on a rhythm strip.
• Ventricular refractory period: The period of time following a paced ventricular beat or a sensed QRS during which the ventricular channel ignores intrinsic ventricular activity (ie, “has its eyes closed”). VRP is a programmable parameter but is not evident on a rhythm strip.
• Maximum tracking interval (or upper rate limit): The maximum rate at which the ventricular channel will track atrial activity. The upper rate limit prevents rapid ventricular pacing in response to very rapid atrial activity, such as atrial tachycardia or atrial flutter. The maximum tracking interval is a programmable parameter and usually is set according to how active a patient is expected to be and how fast a ventricular rate is likely to be tolerated.
Because a dual-chamber pacemaker has both atrial and ventricular pacing and sensing functions, evaluation includes assessing atrial capture, atrial sensing, ventricular capture, and ventricular sensing. To evaluate dual-chamber pacemaker function accurately, it is necessary to know the following information: mode of function (DDD, DVI, etc), minimum rate, upper rate limit, AV delay, PVARP, and VRPs. In the real world of bedside nursing, this information is not always available, so we do the best we can with what we have. The following sections briefly discuss the issues of assessing atrial and ventricular capture and sensing in a dual-chamber pacing system.
Atrial Capture
Atrial capture, unlike ventricular capture, is not always easy to see. Often, the atrial response to pacing is so small that it cannot be seen in many monitoring leads, so we cannot rely on the presence of a P wave following every atrial pacer spike as evidence of atrial capture. If a clear P wave is present after every atrial pacemaker spike, atrial capture can be assumed. In the absence of a clear P wave, atrial capture can only be assumed when an atrial pacer spike is followed by a normally conducted QRS complex within the programmed AV delay. If the atrial spike captures the atrium and there is intact AV conduction, the presence of the normal QRS indicates that the atrium must have been captured for conduction to have occurred into the ventricles before the ventricular pacing stimulus was delivered. Because a DDD pacemaker paces the ventricle at a preset AV interval following atrial pacing, the presence of a ventricular paced beat following an atrial paced beat does not verify capture, because the ventricle paces at the end of the AV delay whether atrial capture occurs or not. Therefore, atrial capture can only be assumed when there is an obvious P wave after every atrial pacing spike or when an atrial pacing spike is followed by a normal QRS within the programmed AV delay.
Atrial Sensing
Atrial sensing is verified by the presence of a spontaneous P wave that is followed by a paced ventricular beat at the end of the programmed AV delay. If a P wave is sensed, it starts the AV delay and ventricular pacing is triggered at the end of the AV delay unless AV conduction is intact and results in a normal QRS. The presence of a normal P wave followed by a normal QRS only proves that AV conduction is intact, not that the P wave was sensed by the pacemaker. Therefore, atrial sensing is verified by a spontaneous P wave followed by a paced QRS.
Ventricular Capture
Ventricular capture is recognized by a wide QRS immediately following a ventricular pacing spike. Ventricular capture is much easier to recognize than atrial capture and is no different than with single-chamber ventricular pacing.
Ventricular Sensing
Ventricular sensing can only be verified if there is spontaneous ventricular activity present for the pacemaker to sense. Ventricular sensing is verified by an atrial pacer spike followed by a normal QRS that inhibits the ventricular pacing spike, which is the same event that proves atrial capture. If a QRS is sensed before the next atrial pacing spike is due, both the atrial and ventricular pacing stimuli are inhibited and the VA interval (atrial escape interval) is reset.
Dual-chamber pacemakers are capable of operating in four states of pacing: atrial and ventricular pacing, atrial pacing with ventricular sensing, atrial sensing with ventricular pacing, and atrial and ventricular sensing. All four states of pacing can occur within a short period of time, and the timing cycles determine which state of pacing is done. Figure 18-49 shows the four states of dual-chamber pacing, and Figure 18-50 illustrates the basic principles of dual-chamber pacemaker evaluation.
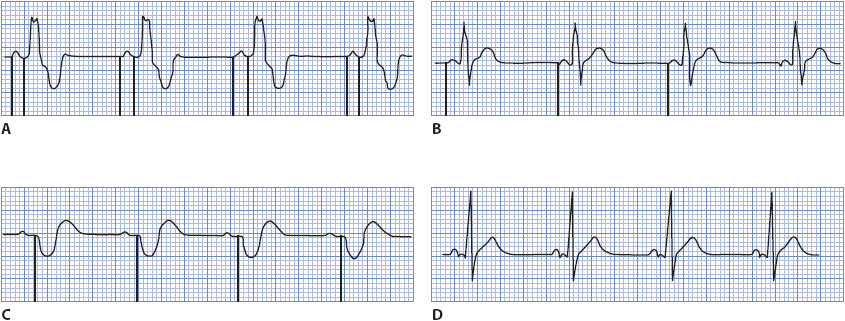
Figure 18-49. Four states of DDD pacing. (A) Atrial and ventricular pacing (AV sequential pacing state). (B) Atrial pacing, ventricular sensing. (C) Atrial sensing, ventricular pacing (atrial tracking state). (D) Atrial and ventricular sensing (inhibited pacing state).

Figure 18-50. DDD pacemaker operating in all four states of pacing. Beats 1, 6, 7, and 8 illustrate AV sequential pacing (A pace and V pace); beats 2 and 3 illustrate atrial pacing and ventricular sensing; beats 4, 5, and 10 illustrate atrial sensing and ventricular pacing; beat 9 is an intrinsic beat with normal P wave and normal conduction to the ventricle. Atrial capture is proven evident in beats 1, 2, 3, 6, 7, and 8; atrial sensing is verified by beats 4, 5, and 10; ventricular capture is evident in beats 1, 4, 5, 6, 7, 8, and 10; ventricular sensing is verified by beats 2, 3, and 9.
Cardiac Resynchronization Therapy (CRT) With Biventricular Pacing
Patients with chronic HF often have intraventricular conduction delays (especially LBBB) that result in ventricular dyssynchrony and impair cardiac function. This intraventricular conduction delay causes electrical and mechanical abnormalities in ventricular function that interfere with ventricular filling, impair cardiac output, worsen mitral regurgitation, and contribute to mortality in patients with HF. LBBB causes both electrical and mechanical abnormalities that result in ventricular dyssynchrony. Interventricular dyssynchrony refers to the time delay between right and left ventricular contraction, where the RV depolarizes and contracts before the LV. Intraventricular dyssynchrony refers to the abnormal segmental contraction within the LV as it depolarizes late and abnormally in LBBB.
When the RV contracts before the LV, the septum depolarizes and contracts with the RV instead of with the LV. Since the septum normally contributes to LV ejection by contracting with the LV, normal septal function is lost in LBBB. Since the septum contracts with the RV, it is relaxed by the time the LV begins contracting, and increasing pressure in the LV causes paradoxical septal motion by pushing the septum into the RV. In LBBB the papillary muscles that are responsible for holding the mitral valve leaflets tight depolarize late and fail to keep valve leaflets from everting into the atria during LV systole, resulting in mitral regurgitation. The combination of paradoxical septal wall motion and mitral regurgitation contribute to the already reduced LV stroke volume that occurs in HF. Portions of the LV that are activated first contract before those portions that are activated late, creating mechanical dyssynchrony that reduces systolic function by about 20%, reduces stroke volume, increases wall stress, and delays relaxation.
Cardiac resynchronization therapy (CRT) is biventricular pacing aimed at improving electromechanical activity in the failing heart. The goals of CRT are to improve hemodynamics by restoring ventricular synchrony, and improve quality of life via symptom relief. CRT devices can be stand-alone pacemakers or combination ICD and biventricular pacemakers (CRT-D). Class I recommendations for CRT include patients with the following characteristics: heart failure with NYHA class II, III, or ambulatory IV symptoms; left ventricular ejection fraction < 35%; presence of significant intraventricular conduction delay (QRS duration > 150 msec); sinus rhythm; symptomatic in spite of optimal goal directed medical therapy for heart failure. Class IIa indications include patients with LVEF < 35% and NYHA class II, III, or ambulatory IV symptoms with QRS duration between 120 and 149 msec; those with non-LBBB pattern wide QRS of > 150 msec; those with atrial fibrillation who are likely to be near 100% ventricular paced; and those undergoing new or replacement device implantation with anticipated requirement for > 40% ventricular pacing.
Cardiac resynchronization therapy is accomplished by placing standard pacing leads in the right atrium and into the right ventricular apex as is done for normal dual chamber pacing. A third lead is advanced through the coronary sinus and into a lateral or posterior left ventricular vein for pacing of the LV (Figure 18-51).
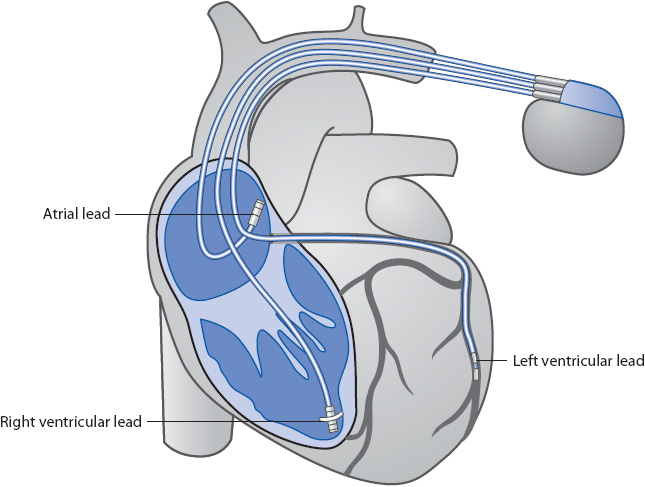
Figure 18-51. Lead placement for biventricular pacing.
The goal in biventricular pacing is to cause both ventricles to depolarize and contract simultaneously, thus eliminating the interventricular and intraventricular dyssynchrony that occurs during LBBB. The AV interval is often programmed shorter than intrinsic AV conduction in order to force the ventricles to pace rather than allowing intrinsic conduction to occur. Biventricular pacing causes both ventricles to contract simultaneously and allows the septum to contract with the LV. Controlling the AV delay restores the normal timing between left atrial and left ventricular contraction, allowing the LV papillary muscles to contract earlier and put tension on the mitral valve leaflets to reduce or prevent mitral regurgitation. Biventricular pacing allows the LV to complete contraction and begin relaxation earlier, which increases filling time and improves “atrial kick.”
Electrocardiographic evaluation of biventricular pacemaker function is more complicated than single ventricle pacing from the right ventricular apex. Pacing from the RV apex creates a LBBB pattern with a wide negative QRS complex in lead V1. Left ventricular pacing is more complicated due to the fact that the LV lead can be placed in either a lateral or posterior LV vein and can be located in an apical or a basal site within the vein. The resulting QRS varies in morphology, depending on the location of the LV lead, but, in general, LV pacing produces a RBBB pattern with a wide upright QRS complex in lead V1. It makes logical sense that pacing both ventricles simultaneously would result in a narrow QRS complex preceded by a pacemaker spike, but this narrowing is not always obvious with biventricular pacing. Loss of capture in one or the other ventricle should cause a change in the morphology of the paced QRS that would indicate single chamber pacing from the ventricle that is still being captured. A shift in the frontal plane axis may also occur with loss of capture in one ventricle.
Some experts recommend recording four 12-lead ECGs at the time of implant: during intrinsic conduction, in the course of RV pacing with capture, in LV pacing with capture, and during biventricular pacing with capture in both ventricles. These ECGs should be examined to determine which lead best demonstrates an obvious difference between the four pacing states recorded, then the best lead should be used as the monitoring lead for pacemaker evaluation. Figure 18-52 shows leads V1 and II recorded during intrinsic conduction, RV pacing, LV pacing, and bi-ventricular pacing. Note the similarity between the intrinsic QRS with LBBB and the RV paced QRS which produces an “iatrogenic” LBBB pattern. The ventricular pacing spike is not visible in lead V1 in the course of LV pacing, and the QRS is negative during LV pacing in this patient as opposed to the more common upright QRS during LV pacing. The QRS during Bi-V pacing is narrower than the intrinsic beats and the single chamber paced beats. Lead V1 would be a good monitoring lead for this patient due to the differences in QRS morphology among these four examples.
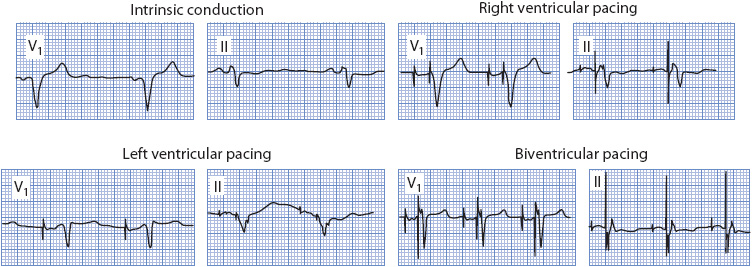
Figure 18-52. ECG in biventricular pacing.
SELECTED BIBLIOGRAPHY
Abraham WT, Fisher WG, Smith AL, et al. Cardiac resynchronization in chronic heart failure. N Eng J Med. 2002;346(24): 1845-1853.
Antzelevitch C, Brugada P, Borggrefe M. Brugada syndrome: report of the Second Consensus Conference. Circulation. 2005;111:659-670.
Antzelevitch C, Nof E. Brugada syndrome: recent advances and controversies. Curr Cardiol Rep. 2008;10(5):376-383.
Barold SS, Herweg B, Giudici M. Electrocardiographic follow-up of biventricular pacemakers. Ann Noninvasive Electrocardiol. 2005;10(2):231-255.
Brenyo AJ, Huang DT, Aktas MK. Congenital long and short QT syndromes. Cardiology. 2012;122:237-247.
Castellanos A, Interian I, Myerburg RJ. The resting electrocardiogram. In: V Fuster, RAO’ Rourke, RA Walsh, P Poole-Wilson (eds.), Hurst’s The Heart (12th ed). New York, NY: McGraw-Hill, 2008.
Elizari M, Acunzo RS, Ferreiro M. Hemiblocks revisited. Circulation. 2006;115:1154-1163.
Fowler SJ, Priori SG. Clinical spectrum of patients with a Brugada ECG. Curr Opin Cardiol. 2008;24:74-81.
Goldberger AL. Clinical electrocardiography: a simplified approach. Philadelphia, PA: Mosby Elsevier, 2006.
Haji SA, Movahed A. Right ventricular infarction–diagnosis and treatment. Clin Cardiol. 2000;23:473-482.
Jacobson C, Marzlin K, Webner C. Cardiovascular Nursing Practice: a comprehensive resource manual and study guide for clinical nurses. Burien, WA: Cardiovascular Nursing Education Associates, 2007.
Kenny T. The Nuts and Bolts of Cardiac Pacing. Malden, MA: Blackwell Futura, 2005.
Leclercq C, Kass DA. Retiming the failing heart: principles and current clinical status of cardiac resynchronization. J Am Coll Cardiol. 2002;39:194-201.
Mirvis DM, Goldberger AL. Electrocardiography. In: RO Bonow, DL Mann, DP Zipes, P Libby, eds., Braunwald’s Heart Disease—A Textbook of Cardiovascular Medicine. 9th ed. pp. 126-167. Philadelphia, PA: Elsevier. 2011.
Pugazhendhi V, Ellenbogen KA. Bradyarrhythmias and pacemakers. In: V Fuster, RA Walsh, RA Harrington, eds., Hurst’s The Heart. 13th ed. pp. 1025-1057. New York, NY: McGraw Hill, 2011.
Seslar SP, Zimetbaum PJ, Berul CI, Josephson ME. (2012). Diagnosis of congenital long QT syndrome. In: DS Basow, ed., Uptodate. Waltham, MA: Uptodate.
Sgarbossa EB, Pinski SL, Barbagelata A, et al. Electrocardiographic diagnosis of evolving acute myocardial infarction in the presence of left bundle-branch block. N Engl J Med. 1996;334:481-487.
Wilde AM, Antzelevitch C, Borggrefe M. Proposed diagnostic criteria for the Brugada syndrome. Circulation. 2002;106:2514-2519.
Evidence Based Practice
AACN Practice Alert: ST Segment Monitoring. American Association of Critical Care Nurses. 2009. http://www.aacn.org/WD/Practice/Docs/PracticeAlerts/ST_Segment_Monitoring_05-2009.pdf.
Drew BJ, Ackerman MJ, Funk M. Prevention of Torsade de Pointes in hospital settings. J Am Coll Cardiol. 2010;55:934-947.
Drew BJ, Califf RM, Funk M. Practice standards for electrocardiographic monitoring in hospital settings. Circulation, 2004;110:2721-2746.
Epstein AE, DiMarco JP, Ellenbogen KA. ACC/AHA/HRS 2008 guidelines for device-based therapy of cardiac rhythm abnormalities: a report of the American College of Cardiology/American Heart Association Task Force on Practice Guidelines. Circulation. 2008;117:e350-e408.
Hancock EW, Deal BJ, Mirvis DM. AHA/ACCF/HRS recommendations for the standardization and interpretation of the electrocardiogram part V: electrocardiogram changes associated with cardiac chamber hypertrophy. A scientific statement from the American Heart Association Electrocardiography and Arrhythmias Committee, Council on Clinical Cardiology; the American College of Cardiology Foundation; and the Heart Rhythm Society. Circulation. 2009;119:e251-e261.
Jacobson C. Bedside cardiac monitoring. In: Burns S, ed. AACN Protocols for Practice: Noninvasive Monitoring. 2nd ed. Boston: Jones and Bartlett; 2006.
Rautaharju PM, Surawicz B, Gettes LS. AHA/ACCF/HRS recommendations for the standardization and interpretation of the electrocardiogram part IV: the ST segment, T and U waves, and the QT interval. A scientific statement from the American Heart Association Electrocardiography and Arrhythmias Committee, Council on Clinical Cardiology; the American College of Cardiology Foundation; and the Heart Rhythm Society. Circulation. 2009;119:e241-e250.
Surawicz B, Childers R, Deal BJ, Gettes LS. AHA/ACCF/HRS recommendations for the standardization and interpretation of the electrocardiogram part III: intraventricular conduction disturbances: a scientific statement from the American Heart Association Electrocardiography and Arrhythmias Committee, Council on Clinical Cardiology; the American College of Cardiology Foundation; and the Heart Rhythm Society. Circulation. 2009;119:e235-e240.
Tracy CM, Epstein AE, Darbar D. 2012 ACCF/AHA/HRS focused update of the 2008 guidelines for device-based therapy of cardiac rhythm abnormalities: a report of the American College of Cardiology Foundation/American Heart Association Task Force on Practice Guidelines. Circulation. 2012;126:1784-1800.
Wagner GS, Macfarlane P, Wellens H, et al. AHA/ACCF/HRS recommendations for the standardization and interpretation of the electrocardiogram: part VI: acute ischemia/infarction: a scientific statement from the American Heart Association Electrocardiography and Arrhythmias Committee, Council on Clinical Cardiology; the American College of Cardiology Foundation; and the Heart Rhythm Society. Circulation. 2009;119:e262-e270.


