We’ve discussed several important concepts so far. You’ve seen that most investors lose to the market. You’ve discovered that automatically selling higher prices and buying lower prices, whether along a coin toss line or a real price line, nudges your performance up. Then you found 3Sig as a way to know how much to buy and sell each quarter, and saw in the last chapter that 3Sig beat the S&P 500 during the very volatile period from 2001 to 2013.
Now it’s time to refine the plan further by exploring what investment provides the best opportunity to beat the S&P 500. There’s no rule that says we need to use the index itself when striving to beat it. What if a different market segment works better?
Small Companies for Growth
Along with the rest of the investment industry, we’ll continue using the S&P 500 as the benchmark we want to beat. Our 3 percent signal provides us with a way to do so, but we can improve upon its outperformance by running it against not the S&P 500 we’re trying to beat, but a different index that beats the S&P 500 over time. This advantage, combined with our 3 percent signal, gives us a double advantage.
We can gain an edge over the large-company S&P 500 by using indexes that track small companies instead. The word capitalization and its abbreviation cap refer to the size of companies as measured by multiplying their shares of stock outstanding by their market price. When stock investors talk about company size, this is what they mean (as opposed to number of employees or factories or something else). Company size means market cap, and you’ll sometimes see it referred to as large cap, medium cap, and small cap. What constitutes large, medium, and small companies changes over time due to earnings growth and stock price fluctuation, but here’s the rough breakdown currently: an average large company has a market cap of $60 billion, an average medium company has a market cap of $5 billion, and an average small company has a market cap of $1 billion.
The following table compares the performance of different indexes as achieved in ETFs that follow them. The S&P 500 tracks large-cap stocks; other indexes track other company sizes. Notice the disparity in the average annual returns of these six indexes through October 31, 2013:
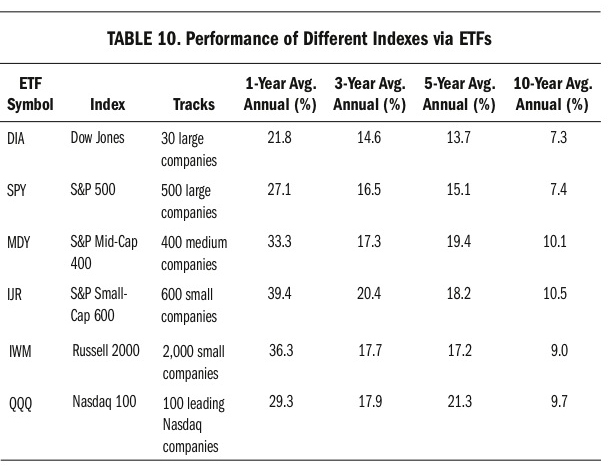
Visit (http://bit.ly/1ySWKra) for a larger version of this table.
The medium- and small-company indexes have performed better than their larger-company brethren, and are where we should focus our attention. The simplest way to beat the S&P 500 is to just own the S&P Small-Cap 600 or Russell 2000 or a different small-cap index, but we’ll go one better and move our capital into and out of small caps using 3Sig. This puts a base-improvement system to work on a base that’s already better than the one we’re aiming to beat. Small-company indexes outpace the S&P 500 on their own, and we’ll improve their performance even more with 3Sig.
There’s another reason that small-cap indexes work well with our plan. They are more volatile than larger-company indexes, which means their prices fluctuate more, and fluctuation is what makes our system work. It’s the movement between higher and lower prices that enables us to buy low and sell high by comparing the index to our 3 percent signal line and responding accordingly.
There are several ETFs and mutual funds that target small-company indexes. Most 401(k) plans and other retirement accounts offer securities in each of the large-, medium-, and small-company varieties, making it easy to implement 3Sig just about anywhere you keep your retirement funds.
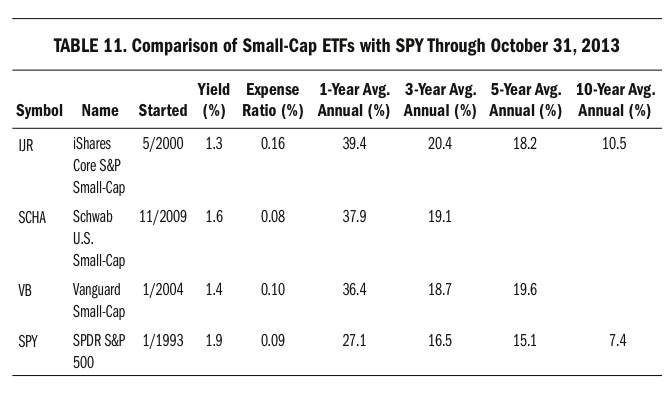
Three excellent ETFs for targeting small caps are iShares Core S&P Small-Cap, Schwab U.S. Small-Cap, and Vanguard Small-Cap. Respectively, they track the S&P Small-Cap 600 Index, the Dow Jones U.S. Small-Cap Total Stock Market Index, and the CRSP U.S. Small-Cap Index. Each ETF is cheap to own, with an expense ratio of 0.20 percent or less and a portfolio turnover rate of 20 percent or less. The turnover rate of less than 20 percent means that in most years, the funds leave 80 percent of their portfolios untouched. This is good because it minimizes trading costs. Here are their profiles as of October 31, 2013, with the SPDR S&P 500 ETF shown for comparison:
Visit (http://bit.ly/1JinJ4b) for a larger version of this table.
As you can see, all three small caps have handily outpaced their large-cap cousin, which happens to be the market measure we’re aiming to beat with our 3 percent signal plan.
Index mutual funds are also an option, available against the same indexes at comparable expenses and performances. For example, Vanguard Small-Cap (NAESX) tracks the same CRSP U.S. Small-Cap Index as its ETF equivalent, Vanguard Small-Cap (VB), just shown.
For our plan, we’ll use IJR because it’s old enough for historical research, is one of the most widely available ETFs targeting small companies and thus makes for a good general example, and is fairly cheap.
However, if you have access to a cheaper alternative, then by all means use it. For example, both SCHA and VB charge lower expense ratios and some retirement plans do, too. These are tiny differences, however, and IJR is very cheap compared with most ETFs. The decision to use a small-cap ETF in the plan is far more important than choosing which small-cap ETF, because they’ll all get the job done at a reasonable cost. Wherever you manage your 3 percent signal plan, use the lowest-cost small-company index fund available for your stock account.
Bonds for Safety
Remember that the plan divides its capital between stocks and bonds. The target allocation between the two for most of your working life is 80/20 stocks/bonds, and you’ll rebalance back to this periodically when your bond balance becomes too big a part of your portfolio. The rebalance trigger is 30 percent for most of your life.
When you contribute new cash to your account, put it immediately into the bond fund, where it will wait until being deployed later into the stock fund with the plan’s quarterly signals.
The reason the plan keeps part of its capital in bonds is for safety. Bonds fluctuate much less than stocks, and they sometimes go up when stocks go down. Plus, bonds pay steady dividends. Constant cash flow from dividends is comforting in addition to providing a big part of investment performance. By keeping a portion of your capital in bonds, you’ll preserve purchasing power for the plan’s stock market buy signals and you’ll earn a decent return on that capital while it waits to buy stocks. If you kept the safe portion of your account in cash, by contrast, it would earn nothing and your overall performance would trail the market over long, rising periods.
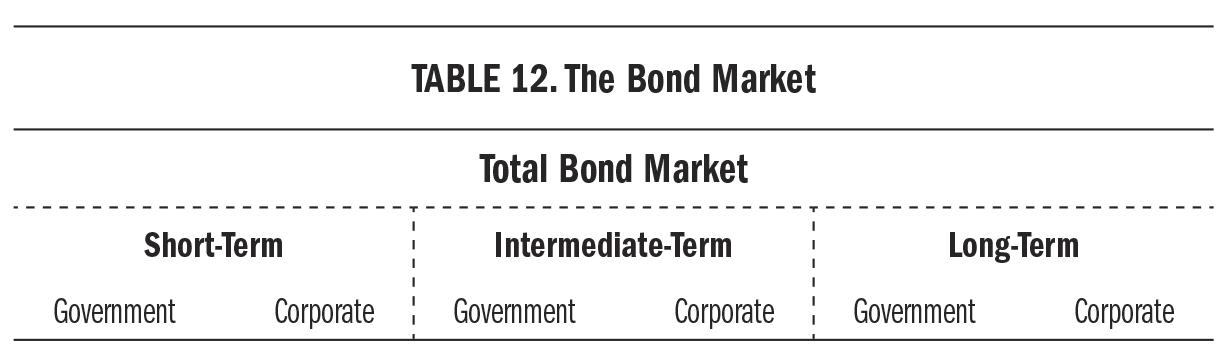
Thus, you’ll keep a target 20 percent of your account in a bond fund. There are many bond funds to choose from, and a lot are available as ETFs with low expense ratios. This is good news. Your goal wherever you run the plan will be to keep roughly 80 percent of your money in the cheapest small-cap stock index fund available and 20 percent in the cheapest bond index fund available.
The main bond market consists of short-term, intermediate-term, and long-term bonds of the government and corporate variety, as shown here:
Visit (http://bit.ly/1BlhMQg) for a larger version of this table.
Beside this core structure of the market are agency bonds issued by the Government National Mortgage Association (GNMA, or Ginnie Mae), and high-yield bonds that are often referred to as junk bonds. The risk in junk bonds is too high, so we can dispose of them out of hand—not hard to do, given their name. GNMAs, on the other hand, are suitable for our purposes. Like U.S. Treasuries, GNMAs present the highest level of safety because they’re backed by the full faith and credit of the U.S. government.
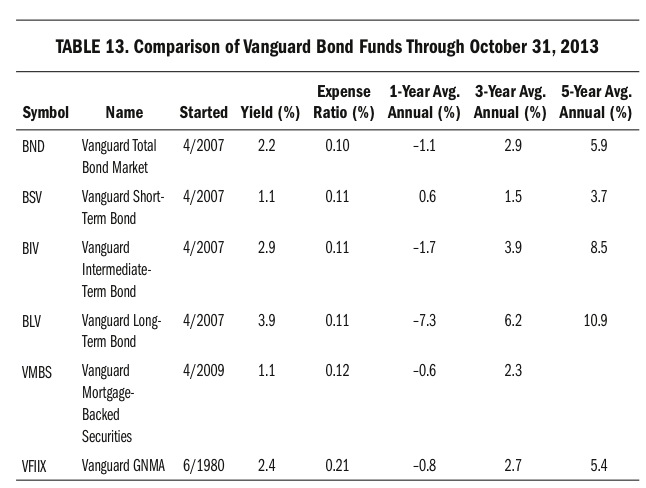
Let’s compare Vanguard bond ETFs in each of the main bond market categories, its mortgage-backed bond market ETF, and the Vanguard GNMA mutual fund that was launched in June 1980. The reason we’ll include Vanguard GNMA is that it has been around long enough to have been used in 3Sig when our fifty-quarter time frame began at the end of 2000. For you, starting the plan now, one of the cheaper ETF alternatives makes more sense and is available in more accounts. Here they are, with data through October 31, 2013:

Visit (http://bit.ly/1JuwuXa) for a larger version of this table.
Vanguard isn’t the only company providing low-cost bond index funds, but it dominates the category. Other low-cost alternatives appear regularly and may emerge as worthy considerations as they build track records. For example, Schwab U.S. Aggregate Bond (SCHZ), launched in July 2011, charges just a 0.05 percent expense ratio.
The rough one-year returns reflect the worries of bond investors in 2013 that interest rates would rise. This fear revealed key tradeoffs in the bond market. Long-term bonds offer higher yields and strong long-term performances but are more sensitive to interest rate fluctuation. Our goal in 3Sig is not to become bond trading aficionados, but just to use a reliable, low-cost bond index fund to store the safe allocation of our account. For this purpose, a total bond market fund such as BND or an intermediate-term bond fund such as BIV is best. These are as evergreen as they come, usually near the middle of the pack, very cheap, and do exactly what we expect bond funds to do.
Even in the time frame shown in the table, BND lost just 1.1 percent, which barely qualifies as a sniffle in the stock market. Plus, bond fund price losses are offset by the steady dividends they pay. For instance, in the six months ended in early November 2013, BND lost 2.1 percent in price but paid out more than $1.00 in dividends at a monthly rate of about $0.17 per share. The dividends reduced the six-month loss in BND by 57 percent, to 0.9 percent. Over long periods, the importance of dividends is even clearer. Some 90 percent of the total return of a broad mix of bonds since 1976 came from dividend payments, not price change.
Remember, this book’s historical examples use Vanguard GNMA as the bond fund because it was in business back in 2000, when our fifty-quarter time frame began, and I want to use historical data rather than theoretical to show you that 3Sig works regardless of the economic environment. Since April 2007, however, cheaper alternatives to Vanguard GNMA have existed, and you should take advantage of them. You want the cheapest total bond market index fund or intermediate-term bond index fund you can get your hands on, or at least your money in.
The Performance Advantage
It’s time to see how much better we can do by using IJR as our stock fund instead of SPY, which we used in the last chapter. We know that IJR’s higher volatility and better long-term performance should provide an advantage, but we need to check. We’ll run the exact same time frame, the fifty calendar quarters from the beginning of 2001 to the middle of 2013. We’ll start with the same amount of money and allocations as before, with 80 percent of our $10,000 beginning in IJR and the other $2,000 in Vanguard GNMA. The only change is that we’re going to run 3Sig with IJR instead of SPY to see if using small caps instead of large caps will put us even farther ahead of the S&P 500.
Here are IJR’s fifty quarterly closing prices:
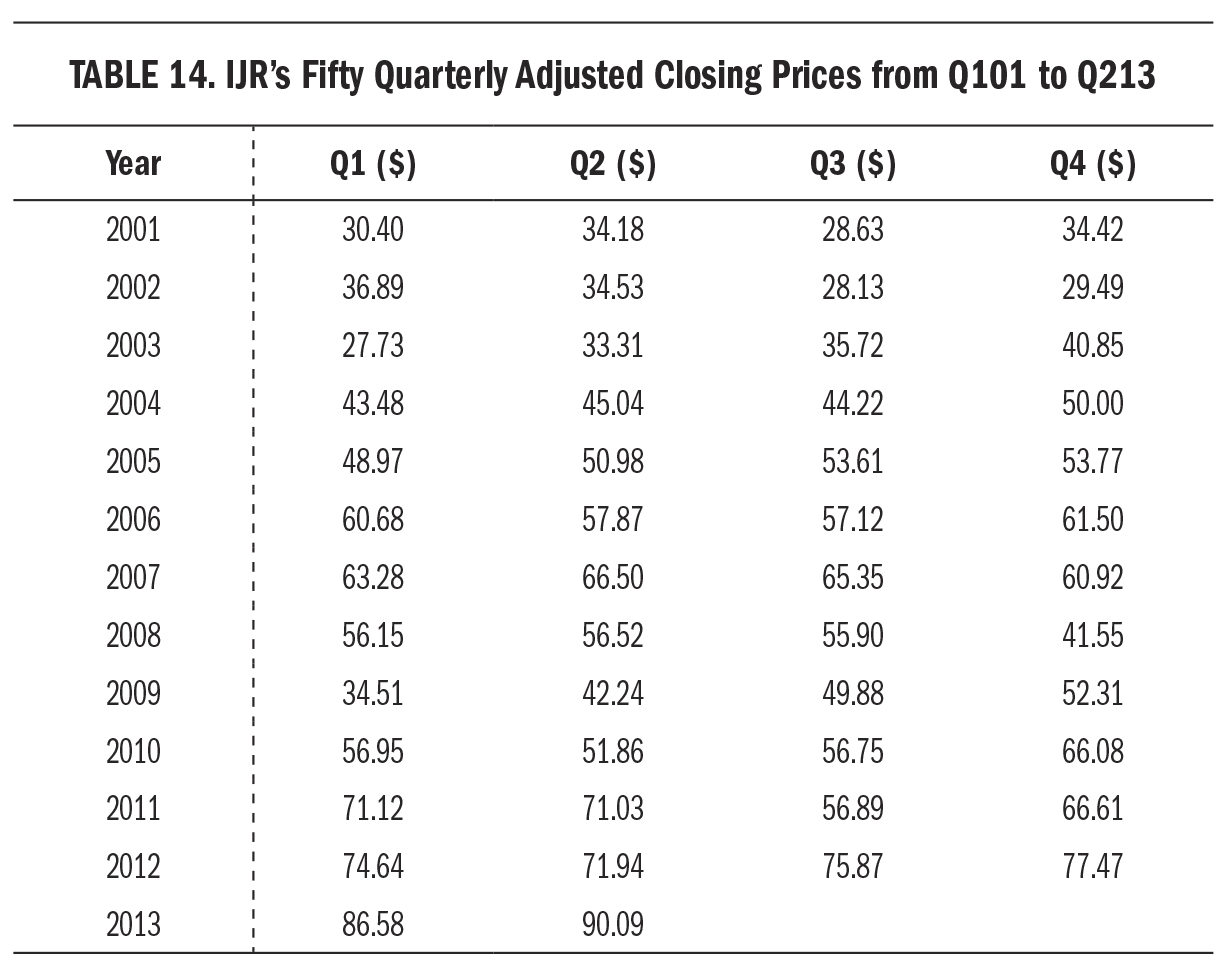
Visit (http://bit.ly/1wsKtpl) for a larger version of this table.
IJR closed the fourth quarter of 2000 at $32.34. Our $8,000 allocated to it bought 247 shares. It paid a $0.04 dividend in the first quarter of 2001 and finished the quarter at $30.40. Our 3 percent signal line from our $8,000 stock balance was the same $8,240 as before. We didn’t make it that quarter. Our balance of $7,520 was $720 short, so we needed to buy 23.68 shares. Our bond balance rose from its initial $2,000 to $2,126, thanks to dividends from IJR and itself, plus its own modest price appreciation, but then fell to $1,407 when we bought our new shares of IJR. The end result was that our IJR balance rose to 271.05 shares worth $8,239.92—on the money again.
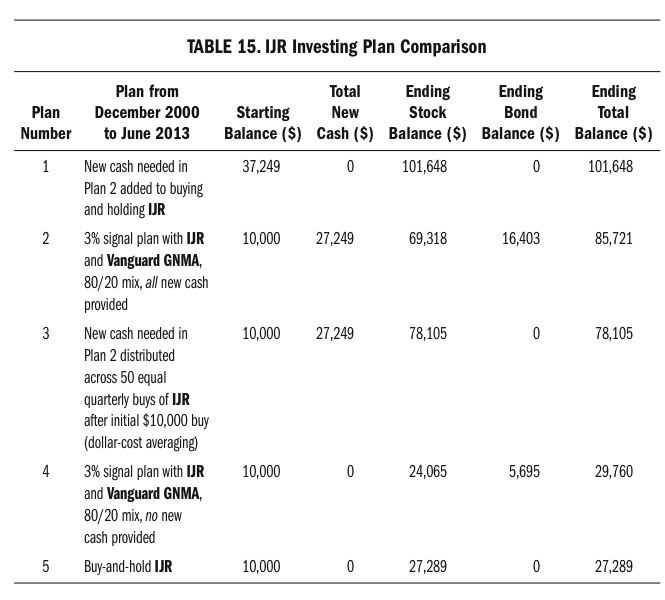
Here are the same plans we ran with SPY in Table 6 on page 68, but run with IJR instead, in descending order by ending total balance:
Visit (http://bit.ly/1JuwxCc) for a larger version of this table.
One difference you’ll notice right up front is that putting all the new cash required by our plan into an initial giant buy-and-hold of IJR produced the highest ending balance. This did not happen with SPY. It’s not a useful discovery, though, for three reasons: First, most people don’t have all the money they’re ever going to invest over a long time frame available at the beginning of the time frame. Second, nobody knows in advance which investments will best perform with a buy-and-hold approach in the time frame. Third, most people buy and bail rather than buy and hold. For these reasons, the ranking of the other plans is of most interest to us.
Among the other plans, Plan 2, which is the base 3Sig version, produced the highest ending total balance. It used new cash more effectively than the other two plans receiving new cash, even the dollar-cost averaging of Plan 3. In Plans 4 and 5, which did not receive new cash, 3Sig outpaced buying and holding IJR, delivering an ending total balance of $29,760 compared with $27,289.
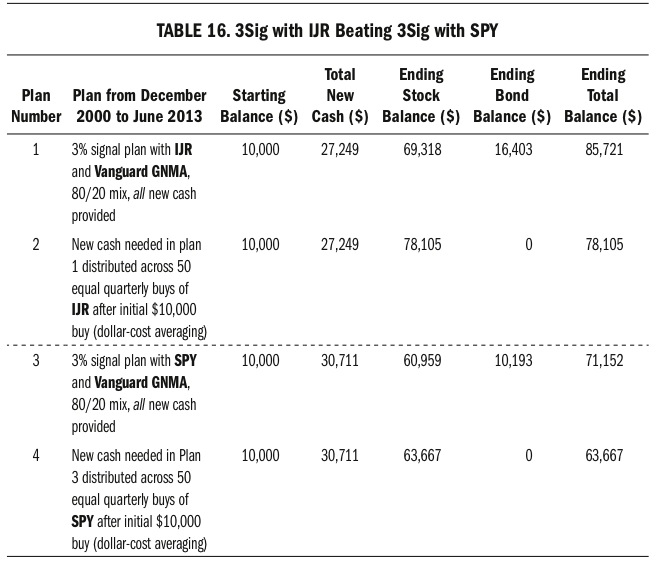
The 3Sig plan’s strong performance against the small-cap index both with additional cash and without is good news, but our real goal is beating the S&P 500 as represented by SPY. We accomplished this, too, and by a lot. The following table compares IJR and SPY in two important plan permutations, 3Sig and dollar-cost averaging the amount of new cash needed by the signal:

Visit (http://bit.ly/1CKE2md) for a larger version of this table.
Using IJR produced a better performance in each permutation when compared with SPY. In Plan 1 versus Plan 3, 3Sig delivered an ending balance of $85,721 using IJR but only $71,152 using SPY, a 20.5 percent improvement. Small-cap stocks are the way to go.
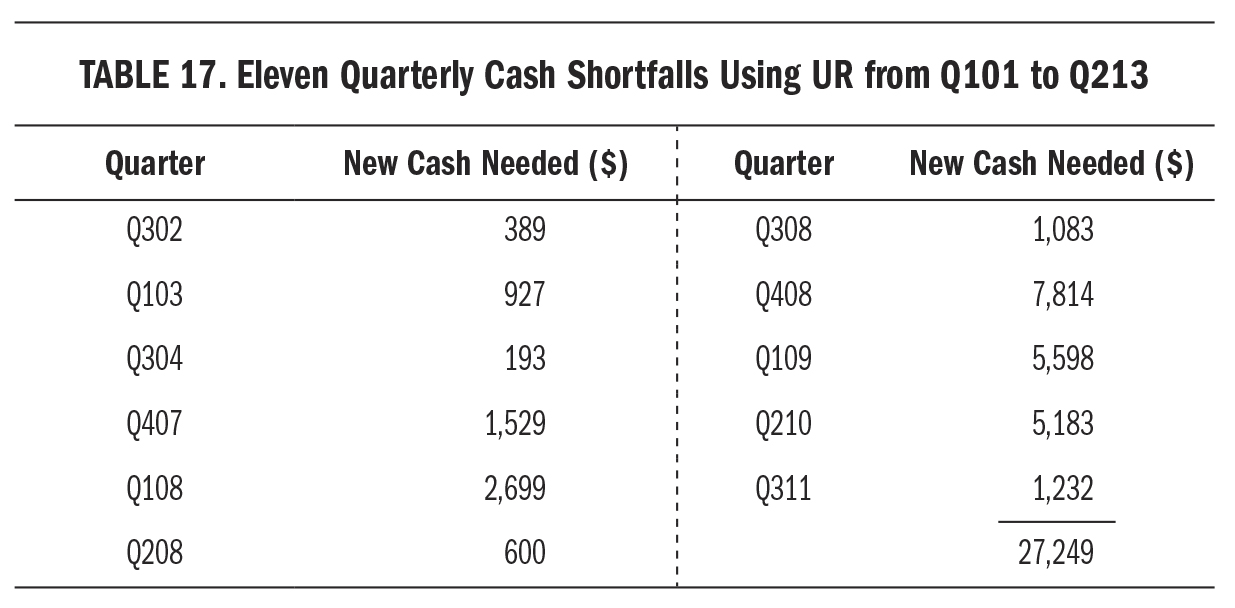
We did need new cash again, but less than when we ran the plan with SPY. Using IJR, only eleven quarters ran into a shortfall as compared with nineteen quarters using SPY. Here are the eleven IJR shortfall quarters, rounded but with a correct total sum:
Visit (http://bit.ly/1t7Kkwh) for a larger version of this table.
Not only did IJR come out ahead of SPY in 3Sig, but it did so with a smaller cash shortage.
In both cases, 3Sig ended the time frame with a good chunk of its capital in safe bonds. This is important. It’s beating the market with less risk, delivering both a higher raw performance and a higher risk-adjusted performance.
Look at how Plans 2 and 4, the dollar-cost averaging plans, produced lower ending balances with all their capital in stocks via either IJR or SPY, and zero in bonds. Meanwhile, Plans 1 and 3, the 3Sig plans, produced higher ending balances with hefty bond reserves. In IJR the $16,403 bond reserve was 19 percent of the $85,721 total balance. In SPY the $10,193 bond reserve was 14 percent of the $71,152 total balance.
To see why this helps, watch what would happen if the market dropped 20 percent the next quarter, as it did in the fourth quarter of 2008. For simplicity, assume that both IJR and SPY fell this amount and that bonds held steady. Here’s how the four plans would look before and after the damage:
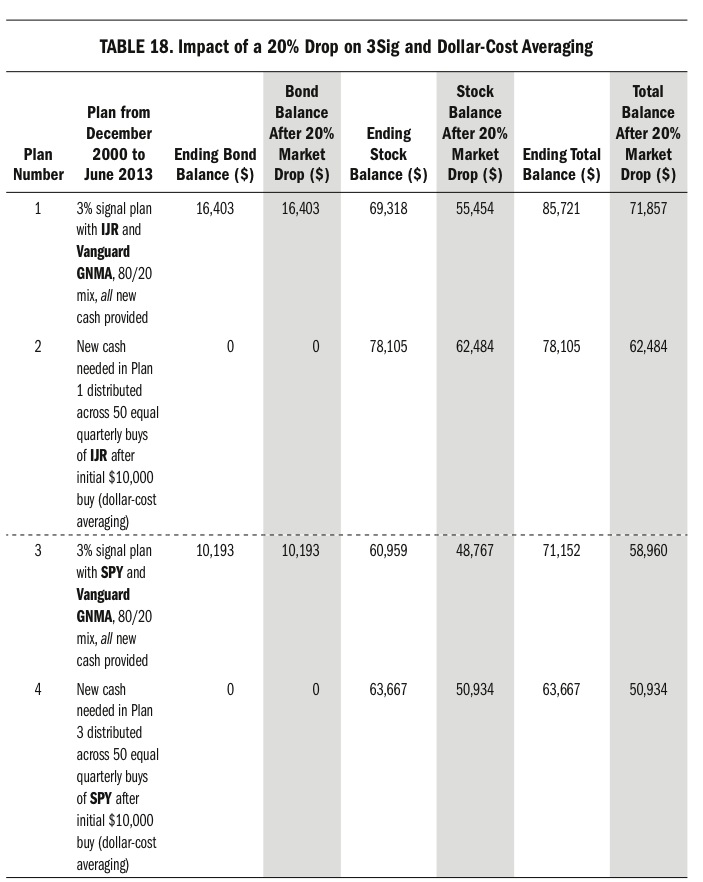
Visit (http://bit.ly/1uDqV7D) for a larger version of this table.
In one fell swoop of precisely the type that derails most investors, the balances changed dramatically. The dollar-cost averaging plans, with all of their balance in the stock market, suffered the entire 20 percent drop. Plan 2 fell 20 percent, to $62,484 from $78,105, while Plan 4 fell 20 percent, to $50,934 from $63,667. The 3Sig plans, with a good chunk of their capital in bonds, muted the impact of the drop. Plan 1 fell just 16.2 percent, to $71,857 from $85,721, while Plan 3 fell only 17.1 percent, to $58,960 from $71,152.
The bond balance maintained by our signal plan delivers four benefits in bad quarters: First, it lessens the damage of the falling market. Second, it supplies buying power to take advantage of the bargain prices that follow. Third, it provides comfort. Fourth, and perhaps most important, it instills confidence in us to make the right move. What is the right move after prices have fallen hard? To buy, of course, which is what the plan would signal. In these two cases, the plan would have been able to fully fund the IJR buy signal with its bond balance, and 71 percent of it with SPY.
All this is impressive enough, but remember that we’re actually understating the performance advantage of the plan over the way most people invest. In the real world, our 3 percent signal plan using IJR outperforms most investment approaches by a much bigger margin than the one shown in these tables. Few investors run their portfolios with the mechanical precision and emotionless rigor assumed in the dollar-cost averaging examples here. Most people second-guess what moves they should make, and they frequently guess wrong. Part of the advantage you gain with 3Sig is the confidence to do what it says and the satisfaction of having taken action as the market moves, which guards you against the perils of personal judgment.
Finally, even if a person never deviates from his dollar-cost averaging plan, he’s almost always running it with a diversified group of funds that together underperform the pure stock index allocation used in these examples. If he runs it in a single stock fund only, the high volatility is likely to buck him off the bull. If he runs it in a diversified portfolio, he’ll experience less volatility but on the way to lower returns. The 3Sig plan strikes a powerful balance. It beats these higher-performing examples with less risk and more emotional support by offering clear guidance every quarter.
With this in mind, let’s compare 3Sig to the messiness of the real world, where Peter Perfect and the z-vals wreak havoc on investors.
Beating the Heroic Holding
The first rebuttal Peter would offer here is that many investments bought and held during the time period we examined would have done better than 3Sig. Just as there’s always a bigger fish, always a tougher guy, and always a greener field of grass, so, too, there’s always an investment that would have done better.
The problem is that you didn’t own it, and neither did Peter. For practical purposes, nobody owned the very best investments at the right times. People talk about them only after the fact, usually with the same wistfulness they reserve for the possibility of having bought a winning lottery ticket. Peter, however, talks about such infinitesimally low-odd possibilities as if they happened every day and will be as easy in the future as he presents them to have been in his what-if fictional version of the past. We’ll humor him for a moment.
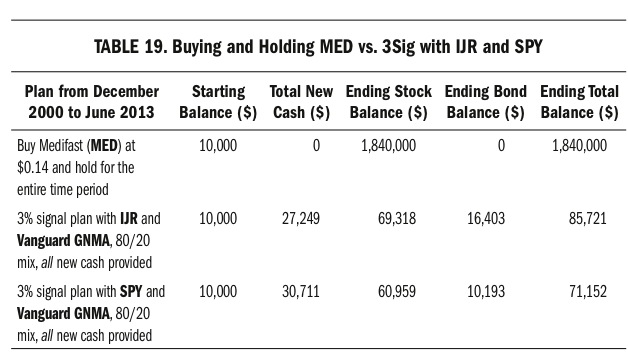
I like to call these super stocks that got away “heroic holdings.” Anybody who held them was a stock market hero, and Peter certainly presents himself that way. In the time frame we’ve been looking at, the fifty quarters from December 2000 to June 2013, one of the most amazing performers from the list of heroic holdings was Medifast (MED), a nutrition and weight loss company. It ended the fourth quarter of 2000 at just $0.14, and closed the second quarter of 2013 at $25.76, for a gain of 18,300 percent. You’ll find few portfolio holdings more heroic than this. Look how much better you would have done putting $10,000 into MED, with no additional purchases along the way, than into these other plans we’ve been considering:

Visit (http://bit.ly/1BS3qJP) for a larger version of this table.
Case closed! Go out and find the next Medifast. Buy it, hold on for dear life, and sell it at exactly the right moment. You know you can do it. At least we know Peter can.
Suddenly, we see that looking ahead is not as much fun as it is looking back. For every Medifast, there are once-promising stocks that end up like Bear Stearns and Enron, each of which collapsed and disappeared. It’s easy to chuckle at investors who owned them, but they weren’t acting as recklessly as you might think. A year after achieving second place in its industry on Fortune’s Most Admired list, and less than a week after prominent z-val Jim Cramer told viewers of his Mad Money television program that “Bear Stearns is fine. . . . Bear Stearns is not in trouble,” the company needed an emergency loan from the Federal Reserve Bank of New York, but failed anyway and was sold to JPMorgan Chase for a pittance on March 16, 2008. As for Enron, at the beginning of the fourth quarter of 2001, when it went kaput, thirteen out of sixteen z-val analysts ranked its stock a buy, and two months after it filed for bankruptcy, The New York Times thought it “may yet serve as a model for other companies,” though presumably without the niggling bankruptcy aspect.
These are just two examples from a list of failed investment ideas long enough to fill the rest of this book, and each one of them was bought and owned because the research around it said it would one day sell for more than it sold for at the time. Peter Perfect won’t ever mention this, of course, and it’s Peter’s objection to our 3 percent signal we’re exploring here, so we’ll leave aside how easily people are tricked into buying losers and refocus instead on one glorious winner, Medifast, and its 18,300 percent gain from 2001 to 2013. What happens in the real world when a lucky z-val finds himself in possession of a heroic holding such as MED? Let’s find out.
Here are MED’s fifty quarterly closing prices during the time period we’ve been examining, plus its $0.14 price at the end of 2000:
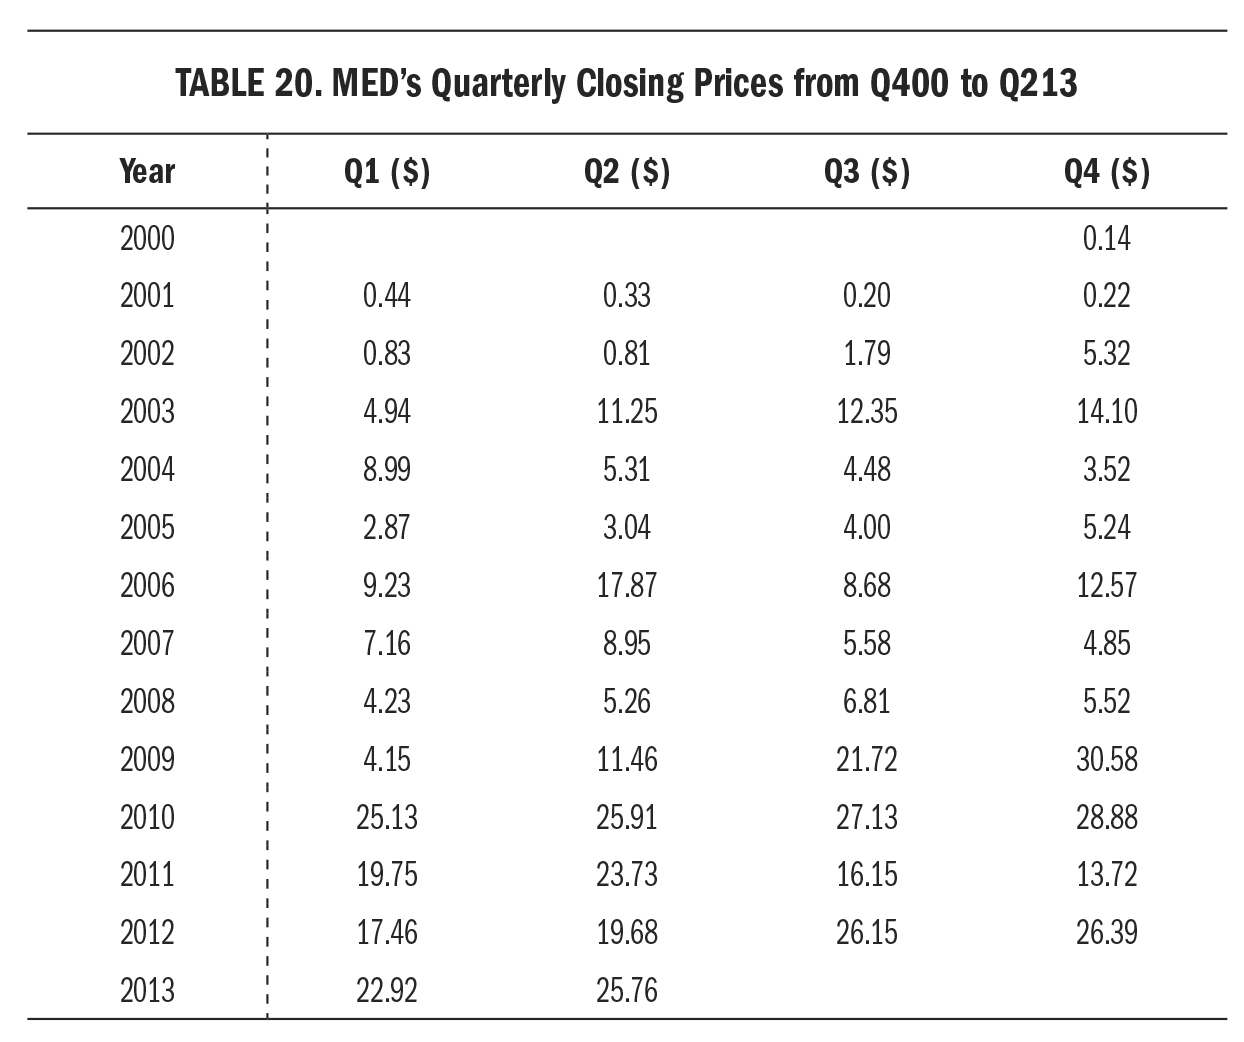
Visit (http://bit.ly/1CZYi3s) for a larger version of this table.
There was a lot more drama on the path from $0.14 at the end of 2000 to $25.76 in mid-2013 than Peter Perfect would mention. A straight line of profits producing no doubts along the way, this was not.
The z-vals had a field day with MED and its firecracker stock over these years, issuing upgrades and downgrades amid its wide fluctuations. Some were right and some were wrong, which makes sense in a 50 percent environment. Medifast made it into daily market reports when its stock topped the lists of biggest gainers or decliners, such as when it fell 16 percent on September 5, 2006, due to a weak profit outlook after a report showed that the cost of acquiring new clients might be rising.
There were good days, too. On February 16, 2010, Reuters reported, “Shares of Medifast, a maker of diet drinks and weight management products, shot up 17 percent on Tuesday, after Barry Minkow’s Fraud Discovery Institute (FDI) ended its investigation of the company saying it wants ‘to dedicate its resources to other ongoing investigations.’ Medifast’s stock had been battered over the past year by the FDI’s allegation that the company’s Take Shape for Life direct selling subsidiary operated a ‘pyramid scheme.’” Between January 8, when the FDI published its report of allegations against Medifast, and February 12, the last trading session before the FDI called off its investigation, shares of MED crashed 38 percent, from $30.91 to $19.04.
Holding through such a plunge, against a backdrop of fraud accusations and the company’s being likened to a pyramid scheme, would not have been easy. Peter Perfect leaves out such inconvenient details when telling his heroic stories. We won’t.
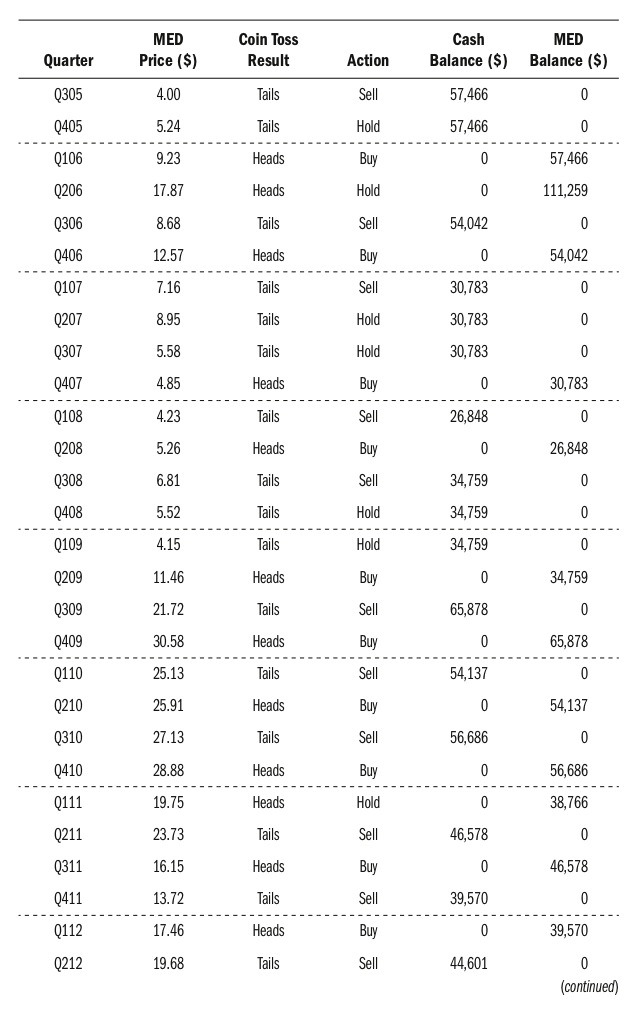
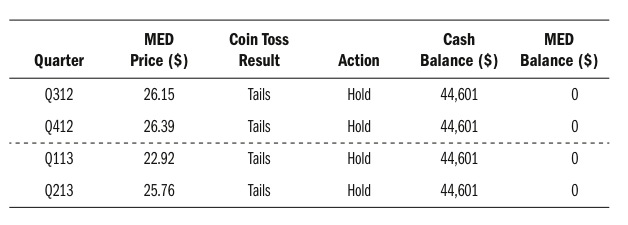
We’ll assume that Peter and other investors in Medifast faced reams of information regarding the company over the fifty quarters just summarized, and that they had to make a decision each quarter on whether to buy, sell, or hold. The period begins with a generous gift on our part, which is granting that Peter bought $10,000 of MED at $0.14 at the end of 2000, which was its lowest price during the entire time frame. Thereafter, we’ll toss a coin each quarter. In quarters when Peter owned MED, heads meant he held it and tails meant he sold it. In quarters when Peter didn’t own MED, heads meant he bought it and tails meant he stayed in cash. This is necessarily simplified because we can’t account for partial sale possibilities and other choices Peter might have made, but it will nonetheless give us an idea for how greatly our 50 percent failure rate can affect even a winning investment’s performance. These are the results of my coin tosses throughout MED’s fifty-quarter history after buying it at $0.14 in December 2000:
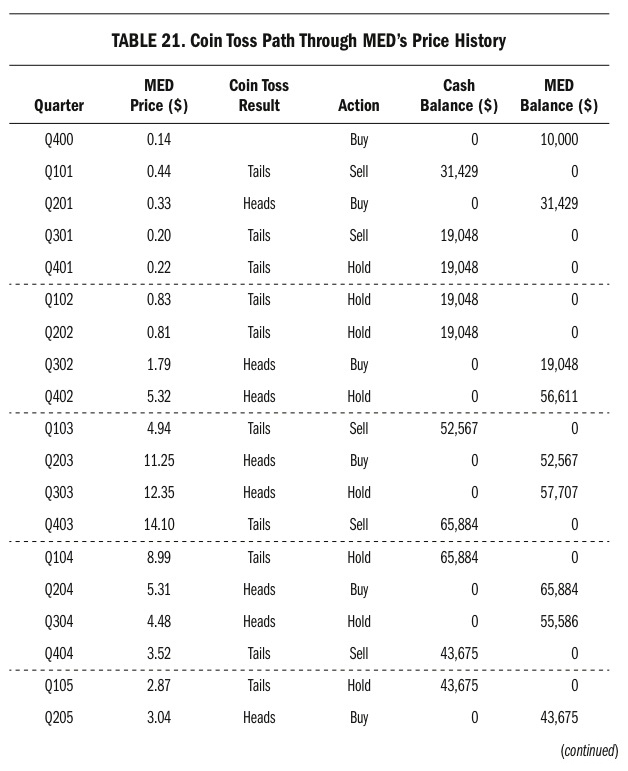
Visit (http://bit.ly/1JinVk1) for a larger version of this table.

Visit (http://bit.ly/1yDzJda) for a larger version of this table.
Visit (http://bit.ly/1JinYfH) for a larger version of this table.
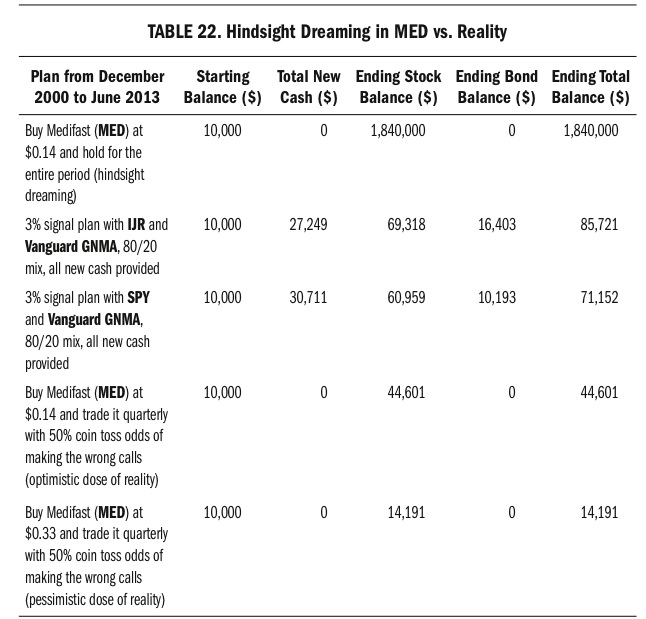
Well, I’ll be. After all the triumph followed by heartache, celebratory dinners followed by sleepless nights, frustration, elation, research, stress, more research, zero validation, bragging, near misses, sulking, and everything else we can list as part of enduring this trading saga with one of the best-performing stocks of this long period, Peter Perfect grew his $10,000 into just $44,601—a far cry from the $1,840,000 he would brag about when telling you, using hindsight, how much a person who bought MED at $0.14 back in December 2000 would have ended up with in June 2013. Perfection is easy to describe in theory, but is unachievable in the real world.
Of course, our look at one possible path through the travails of MED over these years was random, and your own experiment tossing coins to determine each quarterly action will probably produce a different path. The one just given isn’t a bad proxy for how our minds might have worked, however, and it included some genuine successes that Peter could have announced to his friends. If anything, this example is too kind to Peter, due to granting the initial $0.14 buy that rocketed his balance up to $31,429 within a single quarter. That kickoff, which we assumed in his favor before even starting our coin tosses, accounted for 91 percent of his gain over the entire period!
The coin tosses began from that excellent base, and they did fairly well. From the third to the fourth quarter of 2002, they grew $19,048 into $56,611. From the third to the fourth quarter of 2003, they grew $57,707 into $65,884. From the first to the second quarter of 2006, they grew $57,466 into $111,259, the high point of this series. Three quarters later, unfortunately, Peter’s balance had already dwindled to $30,783. If we don’t grant that Peter bought MED at $0.14 in 2000, but instead assume he started the fifty quarters in cash and didn’t buy MED until the second quarter of 2001, when it traded at $0.33, the same trail of coin toss results and their associated actions would have guided his ending balance to a mere $14,191. His high point in the series would have become only $35,401 in the second quarter of 2006, which would have deflated to $9,795 three quarters later, an amount below his $10,000 starting balance—pretty distressing.
Although these quarterly moves were generated randomly, we can imagine the mental processes that might have preceded them with a human at the helm. Returning to the rosier scenario where we grant that Peter bought MED at $0.14 in 2000, his immediate 214 percent surge in the first quarter of 2001 would have given him confidence in his abilities, especially after selling at $0.44 and then finding MED at $0.33 a few months later. “Score!” he would have shouted as he bought back in for another run higher. The subsequent 39 percent drop would have been painful, which could explain why he sold and sat in cash for the next year as the price of MED rose 795 percent, from $0.20 to $1.79. Watching that one get away had to have been just as painful, no doubt ruining untold number of holidays and vacations and special events from early autumn 2001 to early autumn 2002, when he finally couldn’t take it anymore and bought again. Watching a stock go from $0.20 to $1.79, then buying, takes guts. We should admire Peter for this one, especially since it paid off immediately when MED nearly tripled to $5.32 in a single quarter—except that it’s hard to admire coin tosses.
We don’t know how a person would have actually performed trading MED during these fifty quarters, but we do know that the long-term track record of human beings in the stock market reveals them making the wrong call half the time. This quick example shows how devastating this tendency can be to even the best-performing stocks. It should make you chuckle and smile knowingly when encountering tales of heroic holdings. A reasonable response to stories that begin with “Do you know that if you had just bought this stock ten years ago and held on to it . . .” is to say, “Too bad I didn’t buy it then. Neither did you, and even if we had we probably would have sold too soon and bought back in at the wrong times, to say nothing of the inconvenient fact that we didn’t know then what you’re telling me now about its overall performance. So, really, Peter, what’s the point?”
Having deconstructed Peter’s dreamy story of stock market heroism, we’ll now add a dose of reality to the comparison table we looked at earlier:
Visit (http://bit.ly/1JinZA6) for a larger version of this table.
Even the highest-performing stocks need to be bought, held, and sold at the right times with the right amounts of money. We get each part correct only half the time, which is bad enough to reduce a potential ending balance of $1.84 million in a heroic holding to just $44,601 in a generous scenario or to $14,191 in a less generous one.
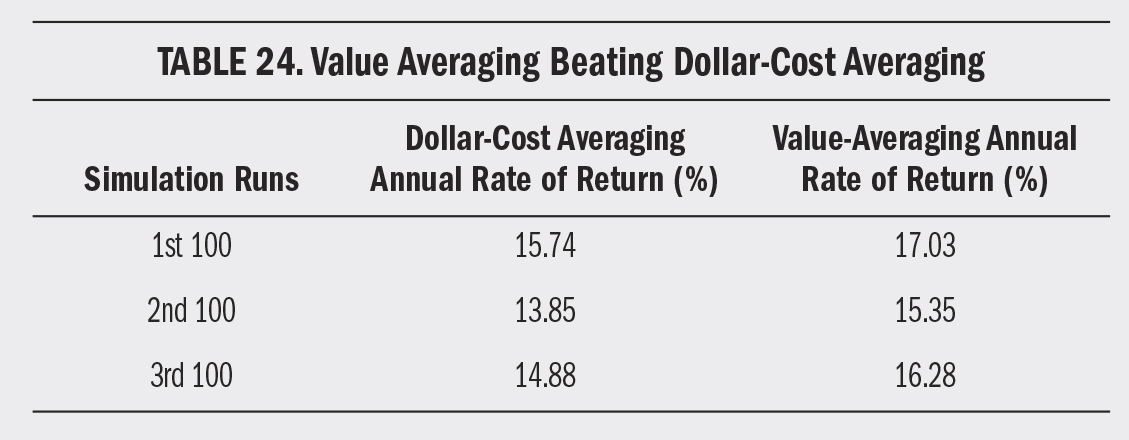
Beating Dollar-Cost Averaging
Many investors advocate dollar-cost averaging (DCA) as the best way to approach the stock market. Their objection to 3Sig is that it doesn’t provide enough of a performance advantage over DCA to make it worth the extra effort. They’re wrong, however, and it’s time for the more sophisticated 3Sig strategy to push DCA from the top of the stock market’s best practices list.
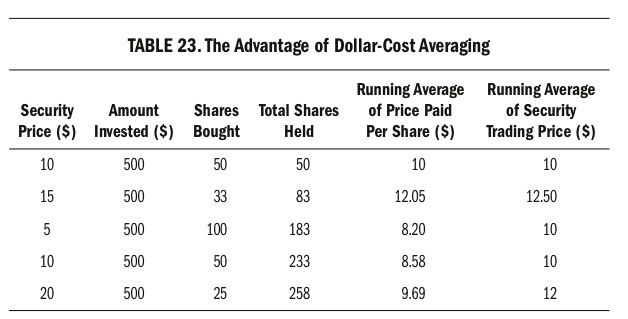
As you saw earlier, DCA is a good long-term investment plan that cuts out most of the investment industry’s noise and focuses on the simple mathematics of having your regularly invested sum of money buy fewer shares when the price is high and more when the price is low, thereby making your average price paid per share lower than the average trading price of the security during the time frame. This table makes the advantage plain:
Visit (http://bit.ly/1upIguT) for a larger version of this table.
Just by automating the regular $500 installment, this investor lowered her average price paid per share to less than the security’s average trading price during the period. DCA is popular because of its simplicity. In a head-to-head match with 3Sig on the same security, it can produce a larger ending balance in some time frames that include a long period of rising prices.
The reason for this encapsulates the entire trade-off between DCA and 3Sig. DCA never sells and, therefore, produces no safe bond balance. It is always 100 percent invested. The 3Sig plan does produce a bond balance and is rarely 100 percent invested. In a market that rises over a long period, DCA can pull ahead due to having all its capital invested. The 3Sig plan will sell profits of more than 3 percent quarterly along the path higher, thereby reducing its exposure to the rising stock line.
The Frailty of Full Investment
The problem with DCA is that people don’t react well when watching their fully invested plan go into the tank. You read about this in “The Myth of Buy-and-Hold” in Chapter 3, and saw earlier in this chapter, in “The Performance Advantage,” how 3Sig muted a 20 percent downturn. Many DCA investors stop sending in regular contributions just when they should be ramping them up or at least keeping them going during periods of low prices. There is no guidance from DCA, just the notion that no matter what’s happening in the world, we should send more money. This is emotionally unsatisfying because we are not uninvolved in the world. We read news, we see our portfolios fluctuate in response, and we are prodded into taking action. Uh oh. You know by now that this is where the trouble begins. Our taking action in the stock market means cranking up the 50 percent mistake machine.
The beauty of 3Sig is that it addresses our need to take action by telling us the right action to take. When the market is down, buy. When it’s down a lot, buy a lot. When it’s up, sell. When it’s up a lot, sell a lot. These are not always the correct calls, because the formula cannot know, for instance, whether a market that’s up a lot in the last quarter faces two more quarters of going up a lot more. The rational sale after going up a lot in Q4 can turn out to be wrong when the market goes up even more in Q1 and Q2. Over time, however, acting rationally each quarter wins out. In this case, it prevents the oh-so-likely personal judgment call to bet the farm at the top of Q2 because prices have so much upward momentum behind them. That’s when the plunge arrives, inflicting maximum damage on your capital because you’ve just moved it all in, then left the damage to linger after you moved back to cash and now sit grumbling on the sidelines as the market reverses course and marches higher again.
DCA presents this risk because of its fully invested nature and the feeling we have that an automatic monthly or quarterly installment isn’t really taking control of our portfolios. “It’s just on autopilot,” we think. “I need to keep an eye on this plan because it can’t adjust to changing conditions.” Bingo! It can’t, but unfortunately neither can we, with any degree of reliability—unless you consider a 50 percent chance of getting it wrong to be reliable. What happens with DCA in the real world is that people watch their fully invested balance grow over time, but panic when it collapses in a market rout. They pull some or all of it out, then have no guidance, aside from the z-vals, as to when they should move it back in. Thus, the plan is shot. Their regular installments pile up in cash instead of in the investment they’re supposed to be buying with the strict discipline that puts average cost reduction to work. Eventually, most people resume directing their regular installments to the investment, but after the best buying opportunity is gone and only until the bottom of the next downturn, when they should buy but instead sell again.
Given this, there’s no way for DCA users to know what their account will be worth in the future. Even if they don’t fiddle with it, the fully invested stock value fluctuates with the market because there’s no system for using a safe account to reset it on a predictable growth path. What will the DCA account be worth at the end of this quarter? Who knows? What will the 3Sig stock fund be worth after rebalancing at the end of this quarter? Three percent more than it was worth at the end of last quarter, which was 3 percent more than the quarter before that.
Visit (http://bit.ly/1y9cLW9) for a larger version of this table.
Another issue facing DCA investors is deciding how much to contribute on a regular schedule. In our earlier comparison of DCA with 3Sig, we determined the quarterly contribution by dividing new cash needed by 3Sig during the period by the fifty quarters involved. In the real world, there’s no such system available. We couldn’t know in advance what would happen in the fifty quarters, so we couldn’t know how much additional cash would be needed by 3Sig. Sometimes the amount contributed to a DCA plan is simply a matter of what the investor can afford, making the decision tree a sparse one, but the lack of guidance becomes an issue as an investor acquires more resources over time and as the investment and economy grow. This last part is more significant than you might think.
Say you set a quarterly DCA amount of $300, figuring that $100 per month is an easy number to remember. That’s $1,200 per year you’re putting into your investment. After five years, you’ve contributed $6,000. If it had been growing at 10 percent annually, your overall balance would be $7,326. Already, in just five years, at a $300 quarterly pace, you’ve built up a base account worth enough to make future contributions of $300 less meaningful. As time marches on, they’ll become smaller and smaller relative to the size of the account they’re supporting. Your income will grow, inflation will push prices higher, and before too long your DCA contribution is not an appropriate size anymore.
In 3Sig, this is never an issue. The plan grows at a percentage rate so that the buy-and-sell guidance it issues remains proportional to the plan size from start to finish. An initial $1,000 stock fund balance needs to grow just $30 this quarter to stay on track. A $300,000 balance built up over many years needs to grow $9,000 this quarter. The plan’s formula automatically accounts for this, so that quarterly actions remain meaningful regardless of the account size. Plus, the growth of the balance kicks off cash via sell signals, and this cash goes into the bond fund to support most subsequent buy signals even as they grow over time. You’re not handing over $9,000 this quarter, for instance. Some or all of it will be supplied by market growth. If not, proceeds from sales of past market growth will fill in the gap.
With DCA, even if you increase your regular contributions over time to account for a growing income, the installments will pale in comparison to your overall account balance. Let’s think very optimistically and say your income quadrupled in the five years after you began contributing $300 quarterly to your DCA plan, so you upped the quarterly amount to $1,200, for an annual amount of $4,800. At the end of the next five years, you’ve contributed a total of $30,000, and your account value is $41,103, given the same 10 percent annual return the whole time. Back at the five-year mark, when you were sending in just $300 each quarter, those installments were worth only 4 percent of your account value. Now, at the end of ten years, your $1,200 quarterly installments are worth only 3 percent—and $1,200 per quarter isn’t chump change. You can see where this is heading. The growth of the money you’ve contributed in the past always ends up dwarfing your later contributions. This lessens the ability of those contributions to take meaningful action in deep downturns.
Consider this $41,103 you see in your account after ten years of faithful quarterly investing. If the market sells off 40 percent over two quarters, the value of your account is going to drop to $24,662. The right thing for you to do in DCA is keep sending in your quarterly contributions as the price drops, so you’ll buy more shares. However, throwing $1,200 one quarter and then another $1,200 the next, at a problem that’s already erased $16,441 from your account value, will feel like fighting a fire with spoonfuls of water. You’ll want to take more action, and the action you take might be exactly the one you read about in “The Myth of Buy-and-Hold” earlier: bailing at the bottom. “All I do is keep sending in the same amount of money,” you’ll think, “but it’s never enough to make a difference, and it just evaporates along with the rest of my account. I have to stop this.” Then you bail.
With 3Sig, you’ll keep your regular quarterly contributions going the same way as with DCA, but you’ll benefit from the added buying power of your bond account built up by half of your past contributions and sales proceeds (more on this in the next chapter). This firepower is gratifying in times of crashing prices. Just doing something smart instills in you the confidence to stick with it. You can respond to your own “I have to do something” instinct by replying, “I am doing something: following 3Sig, and it always ends up working. It will this time, too.”
More Funds, Worse Performance
Because of these severe drawbacks when DCA and buy-and-hold are used with a single stock fund, they are almost always divided across an assortment of funds and asset classes. Your regular monthly or quarterly contributions would not go into just a small-cap fund, for instance. They would instead go into a large-cap stock fund, a growth and income stock fund, an international stock fund, a bond fund, a Treasury fund, and so on. In your younger years, this allocation might end up something like 40 percent aggressive stocks, 30 percent steady stocks, 20 percent bonds, and 10 percent Treasuries. This type of diversification dilutes performance and will almost always lose to 3Sig’s concentration of 80 percent of your assets in small-cap stocks. Keeping 80 percent of your capital in small caps is very aggressive and would be risky except that the other 20 percent of your money and your additional contributions are standing by to purchase market weakness when it appears. Watching this work, you will feel your stress alleviated as you outperform nearly every other stock market approach available.
Thus, 3Sig actually puts more money in the small-cap section of the market than does any real-life DCA plan. Holding out the example of running DCA with 3Sig’s new cash through a 100 percent small-cap allocation in a past period is a Peter Perfect trick. Nobody would do so, just as nobody ever buys at the exact bottom or sells at the exact top, as Peter constantly suggests is possible. However, as you saw earlier, 3Sig can come out ahead of even these fictional 100 percent small-cap-focused DCA examples on a raw-return basis, and more so on a risk-adjusted basis.
Dollar-cost averaging is a good investment method, certainly better than risking important financial goals on open-market coin tossing with z-vals. However, it’s not as good as 3Sig because: it achieves a lower risk-adjusted performance (and usually a lower absolute performance) in the focused one-fund version due to being always fully invested, it does not satisfy our need to react to market events, it does not provide guidance on increasing or decreasing contributions in response to market prices or the changing value of the portfolio over time, and it almost always ends up diversified across lower-performing asset classes because nobody can handle the stress of full investment in aggressive stocks without the benefit of a clear buy-and-sell formula. Here’s how the two plans compare:
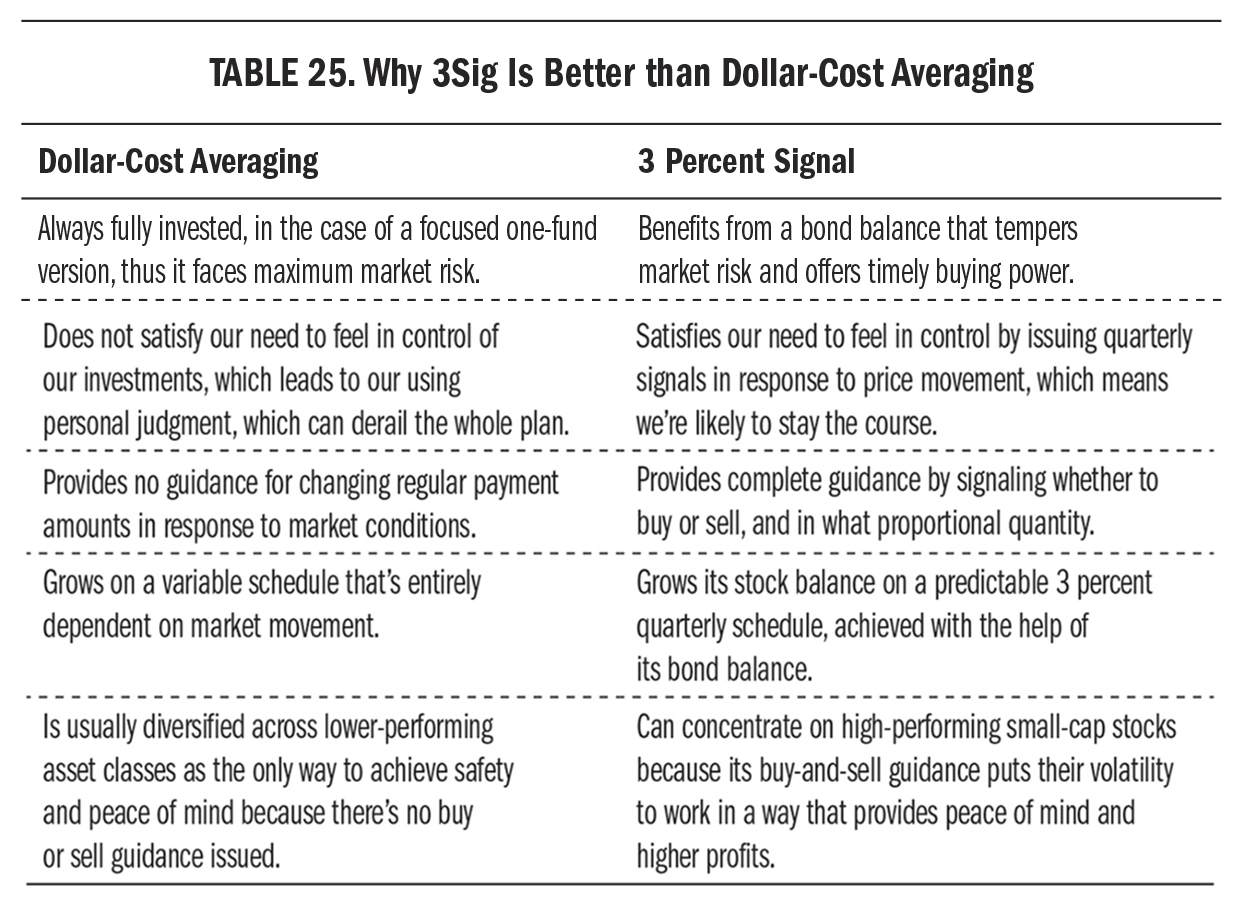
Visit (http://bit.ly/1ECgDol) for a larger version of this table.
30 Down, Stick Around
In the previous section on dollar-cost averaging, and in “The Myth of Buy-and-Hold” in the last chapter, you read that one of the biggest weaknesses of fully invested plans is that they’re so painful at the bottom, causing people to sell, thereby locking in losses by missing out on the recovery that follows. The 3Sig plan gets around this by signaling for us to buy the lower prices, or at least hold on if there’s no cash available for buying.
For a moment, focus on what would make the fully invested plans work. Staying put, right? If buy-and-hold investors just ignored the market’s plunge and truly held on, they’d benefit from the recovery. If dollar-cost averagers kept their plan going and remained fully invested through the bottom, they’d also benefit from the recovery. Our plan strives to put more money to work during extreme sell-offs to benefit more in the recovery. Is there a way we can further tweak it to perform even better when the market rebounds from a deep sell-off?
Yes. I call it “30 down, stick around” to describe that whenever the market loses more than 30 percent, you should stay put in stocks. That is, after a steep stock market sell-off, you’ll stick around stocks for the recovery rather than pulling money out by selling on the way up.
We have to define a couple of terms here. The 30 percent drop is calculated from the quarterly closing prices of SPY (not daily or real-time prices) in the previous two years. SPY works well for this purpose because it’s an excellent proxy for the general stock market, and it’s a rebound in the general market that we’re trying to capture. If you use something other than SPY, such as a more focused index or an individual stock, it could drop 30 percent from its high of the past two years without offering good odds for a rebound. If SPY falls 30 percent from its high of the past two years, there’s a very good chance that the market is going to rebound powerfully. Since we use quarterly closing prices only, the two-year lookback means you need to glance over just eight prices. A good memory jog is that you should “keep an eye on SPY.”
As for how long you’ll stick around following a 30 percent drop: four sell signals. They might happen back to back, four quarters in a row, or they might be interspersed with a few buy signals, which you would follow as usual. In case the market is not going to recover quickly, we should put a further time limit on how long you’ll remain in stick-around mode, which is two years. Put it together, then, and here’s the “30 down, stick around” rule:
- The stick-around mode is triggered when the quarterly closing price of SPY falls 30 percent from its quarterly closing price high within the past two years.
- “Stick around” means you’ll ignore the next four sell signals. They might happen in a row, but they might be interspersed with buy signals. Either way, ignore four of them.
- You’ll exit stick-around mode and resume the regular plan after you’ve ignored four sell signals or two years have passed.
It’s likely you’ll never need the two-year addendum. In back-testing, the plan has always generated four sell signals within two years of a drop greater than 30 percent. The reason we should specify a time limit nonetheless is that it’s conceivable the market could fall 30 percent and then flatline for longer than two years. If so, it’s not in a dramatic recovery to be held. It’s in something else, and the plan needs to revert to its standard mode of harvesting stock market profits for later buying. After the long sideways path, the market might fall again so the plan generates buy signals. You’ll want to have harvested some profits to prepare for such a contingency, so you shouldn’t let the stick-around phase last longer than two years. Similarly, if the market takes more than two years to fall 30 percent, there’s less chance of a sharp recovery.
Now that you know the rule, let’s get back to why it boosts performance.
The 3Sig plan instructs us to buy cheaper prices as the market falls, which will eventually pay off. From the bottom of big crashes, the market frequently rises most aggressively immediately afterward, piling up gains that most people miss because they’re waiting for signs of safety, which don’t usually appear until many of the gains are gone. The 3Sig plan will detect the big quarterly gains during such a phase and signal to sell excess profits beyond its target. By ignoring four such sell signals, you will leave your money in stocks during the most powerful part of the recovery and then resume following the signal as usual.
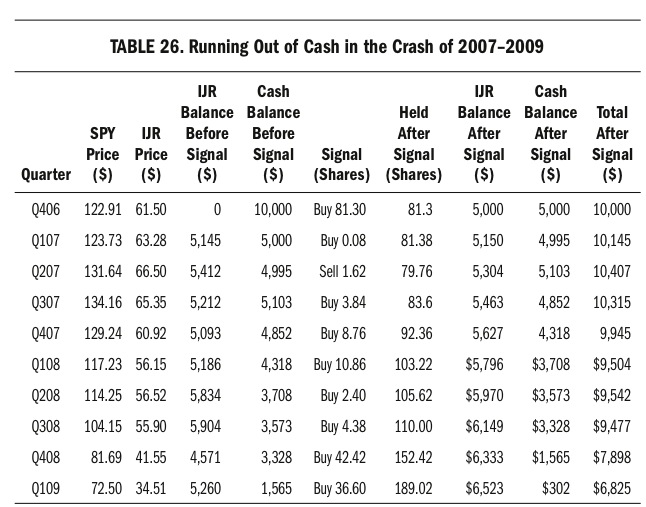
Let’s run through a simple comparison using the crash of 2007–2009 and its subsequent recovery. We’ll begin with a $10,000 balance at the end of 2006, investing half in IJR and leaving the other half in cash (not bonds this time) for later purchases. Here’s how it went to the bottom of the crash in the first quarter of 2009:

Visit (http://bit.ly/15xGTEh) for a larger version of this table.
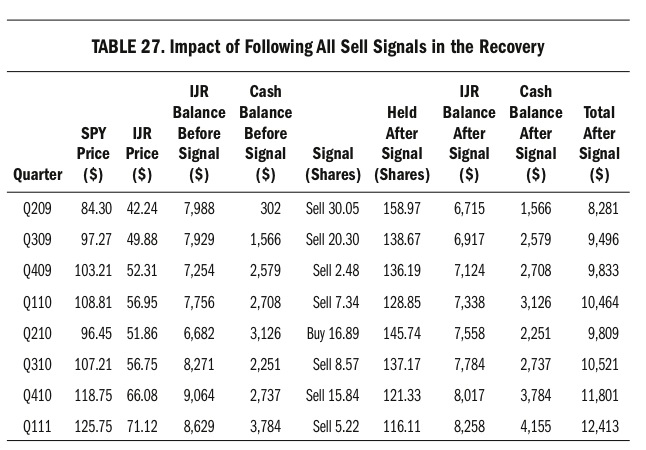
At this point we’re at the bottom of the bear market, almost out of cash, with our total account balance down 32 percent, even though our IJR balance has grown 3 percent per quarter religiously, thanks to our following the signal. Unbeknownst to us, the market would now recover. If we had not adhered to the “30 down, stick around” rule but had instead followed the plan’s sell signals, our account would have grown in the following two years in the manner shown in Table 27 on the next page.
Notice that the most powerful part of the recovery happened directly off the bottom, as IJR rose 65 percent from $34.51 at the end of Q109 to $56.95 at the end of Q110. During this profitable phase, we sold on the way up, thereby muting our gains. We still did well, growing our total balance 82 percent in these first two years of the recovery, but would have done better if we’d entered a stick-around phase and ignored the first four sell signals after SPY dropped 30 percent.
Visit (http://bit.ly/1BS3Ks4) for a larger version of this table.
On the quarterly price schedule—the only one you need to watch—SPY peaked at $134.16 in Q307. The threshold marking the stick-around phase was 30 percent below this, or $93.91. SPY slipped under $93.91 in Q408, triggering the stick-around phase of ignoring the next four sell signals within a two-year period. The next signal, in Q109, was a buy signal and followed as usual because the stick-around phase ignores sell signals only. After a 30-percent market drop, more buy signals means the market is still struggling and should be bought to the extent that cash availability will allow. Why? Because a recovery is on the way and more buying ahead of it will turn into more profit after it.
The first sell signal to be ignored arrived the next quarter, in Q209, and the next three to be ignored arrived back-to-back through Q110. It doesn’t always go this way. It’s possible to get buy signals mixed in with the sell signals to be ignored, but the “four to ignore” (another handy mnemonic rhyme) came in a row after the subprime mortgage crash bottomed in Q109. Here, then, is how we would have done with the exact same amount of money invested in the exact same recovery by adhering to the stick-around rule:
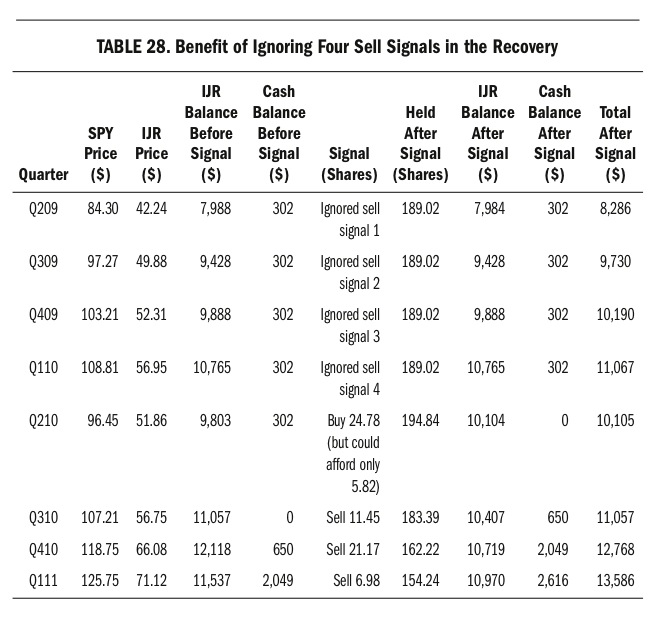
Visit (http://bit.ly/1CvjAbp) for a larger version of this table.
Look how much better we did. Ignoring the first four sell signals after SPY dropped 30 percent put our Q111 ending balance at $13,586 instead of the $12,413 it became without following the stick-around rule. It delivered a 9 percent improvement in this case, even though ignoring the four sell signals left our cash balance too small to afford the full buy signal in Q210.
The reason the rule works is not hard to understand. When the stock market is in a powerful recovery, it’s best to leave capital invested in stocks. The highest odds of getting a powerful recovery are in the time frame following a big drop in a small time period, which we’re defining as two years. A bear market is usually considered a 20 percent drop, so limiting the stick-around rule to periods following a 30 percent drop makes this a seldom-used but highly beneficial modification to the plan.
You may wonder if this benefit was unique to this time frame, that maybe it wouldn’t be as helpful in other time frames. In fact, it has been. In the two decades from 1993 to 2013, the stick-around rule boosted performance over the standard plan that follows all sell signals, even when it caused a shortage of cash in subsequent buy signals, which you saw happen in Q210 in this example. The 30 percent threshold was the ideal level as well, producing the biggest performance boost for the funding shortfalls it caused. Other thresholds (such as when the market drops 25, 35, 40, or 45 percent) didn’t work as well.
Using the S&P 500 itself rather than SPY as its proxy shows the rule appearing just four times in the 1950–2013 period: 1970, 1974, 2002, and 2009. The four ignored sell signals in each case left the plan fully invested for S&P 500 gains of 38 percent in the 1970 instance, 62 percent in the 1974, 14 percent in the 2002, and 43 percent in the 2009.
Getting around funding shortfalls with a bottom-buying account, which you’ll learn about in the next chapter, further magnifies the stick-around rule’s boost. It enables you not only to stick around for the recovery but also to take advantage of the first “buy-the-dip” opportunity that appears on the way higher.
Variations on the Plan
You know now that the plan uses small-cap stocks as its growth vehicle and bonds as its safe vehicle. It’s natural to wonder if we could use the exact same strategy aiming for 3 percent growth per quarter but with different vehicles. What if something other than a small-cap stock index could be used just as easily with better results? In researching the plan over many years, I’ve tried just about every type of investment vehicle the market offers, but nothing has been able to beat 3Sig’s base case meaningfully and consistently. Let’s run through a few examples.
Other Market Segments
There is no end to the ways we can divide up the stock market. We already looked at separating it by capitalization, or company size, and found that smaller company indexes are better than larger company ones because they’re more volatile on their way to a higher return. Another way that people divide the market is by sector and industry. Stock groupings go in the following order from wide to narrow: sector, industry, company. The idea with moving up the list from individual company stocks to industries and sectors is that we’ll have a better chance of choosing which entire groups of similar stocks will perform well than which handful of companies or single companies within the groups will beat their peers.
It’s easy to test whether specific sectors can outperform the broader market. The S&P 500, for instance, is divided into nine sectors, and there’s a SPDR ETF representing each of them. Not a single one beats small-cap stocks over time. There are pockets of time in which certain sectors outperform, but trying to guess which sectors and which times introduces familiar trouble.
The business of picking the next top-performing sector or industry has no better track record than the business of choosing top-performing stocks, and we know what a crapshoot that is. The same questions apply. What qualifies as a bottom? When do you buy it? When do you sell it and move to a different sector or industry? How much of your money do you use? The z-vals are just as bad with sectors and industries as they are with stocks for all the same reasons, so we can dispose of this approach without a second thought.
What about focusing on regions of the world or individual countries? Same problem. If choosing stocks within our own country is difficult, why would it be any easier choosing them in other countries or choosing which entire countries are looking better than others? On top of the now-familiar list of pitfalls, country diversification introduces the joy of currency exchange complexities and geopolitical risks. If there’s one thing we know our investment portfolio doesn’t need, it’s extra layers of complication. We’ll set this one aside.
I could go on, but I’m sure you already detect a pattern, which is that various ways of grouping stocks don’t get around the basic limitation of our 50 percent error rate in the market. This stock, that stock; this country, that country; this industry, that industry; this sector, that sector—get out your darts and coins. The only array of choices broader than the parts of the market is the range of z-val opinions on those parts, which sport no better odds than yours. Quick reminder: 50 percent.
Even if back-testing revealed that a certain sector beat IJR by a substantial margin, our inability to know whether it could do so again would make it a typical stock market gamble to move our plan from the general market to the winning sector from the last time frame. Maybe that sector will have another strong decade; maybe it won’t.
In my testing, however, none of the sectors achieved a substantially better performance than IJR, so we need not even consider the gamble. What’s more, almost every brokerage and retirement account includes a small-cap fund option, whereas fewer include sector fund options. This could be the simple deciding factor, and now you know that you’re not missing anything if your account offers no sector funds. Just run 3Sig with the cheapest small-cap fund available to you and you’ll do well.
Filtered Funds
There’s another way to view stock investments that involves setting a filter and buying what it catches through various cycles. This is better than buying fixed market segments because it gets around the problem of such segments moving into and out of favor. Rather than buying technology stocks, for instance, we might set a filter to buy cheap stocks, or fast-growing stocks, or the stocks most widely owned by investors we respect, and so on. The filter remains relevant through changing market seasons because it catches only stocks that match the formula we feed it. The stocks that were cheap a year ago might be a different set than the ones that are cheap now, and filter results will reflect this. Fixed segments won’t. The consumer discretionary sector will always contain the consumer discretionary stocks.
The most popular filter method is one that targets either growth or value stocks. A preference for either growth or value is the most basic division among stock investors, even more central to their characters than whether they prefer large or small companies. A growth investor is more concerned with a company’s growth rate than with its size or industry, and will typically build a portfolio of growth stocks of various sizes and industries with possibly an emphasis on small ones, as they have more room to grow. Similarly, a value investor will seek cheap companies regardless of size or industry. Growth stocks boast high earnings and sales increases, and their stocks usually exhibit upward price momentum. Value stocks boast bargain prices as measured by ratios of book value to price, earnings to price, and sales to price. Would a focus on either growth or value consistently boost 3Sig’s performance?
In short, no. Each of the capitalization indexes we’ve been considering (which is to say the ones based on company size) is available in both a growth and value subset. We can compare the overall S&P 500 index of large companies to a subset of the companies in it that meet growth-investing criteria and a subset that meet value-investing criteria. We can run this same comparison on the S&P 400 index of medium-size companies and the S&P 600 index of small companies. Doing so reveals results similar to running the plan with sectors. There are pockets of outperformance as growth and value come into and out of favor, but no meaningful long-term edge over the full small-cap segment.
Besides, almost all accounts provide some type of general small-cap fund. Fewer provide small-cap funds with growth or value filters. Even if they do, they’re bound to cost more than the base index itself. Given these factors, the easy conclusion is just to stick with the cheapest general small-cap stock index fund available to you.
Individual Stocks
The idea with 3Sig is to provide you with an evergreen approach to the market that you can run with minimal interference in your life for as many years as you want. To qualify as evergreen, the plan should be used with a diverse stock index rather than a specialty index or individual stock. Anything that can come into and out of favor with no guarantee of eventual recovery is not a good choice because it requires our judgment on when to own it and when to step aside, and we know what folly that introduces. This is why our basic plan runs with IJR or another broad small-cap investment. It works pretty well in all environments for a comforting set-and-forget result.
The plan can work with individual stocks, however, and usually much better than any Peter Perfect attempt to time entries and exits. The reason 3Sig works is that it guides us to buy low and sell high around the 3 percent growth line—no judgment required, just a calculator. The Peter Perfect approach relies on faulty human perspective that thinks it knows when to buy and sell, but gets it right only half the time, which is enough to reduce potential perfection to subpar performance on even the highest flying of stocks. You saw this yourself with the heroic holding Medifast earlier in this chapter.
Some companies are so big and successful that they can work with 3Sig over very long periods, if not for the rest of your life. The big, diversified, global companies on the Dow, for instance, are like indexes unto themselves. Owning dividend-paying conglomerates such as ExxonMobil and IBM and Walmart is similar to owning sector funds targeting oil services, information technology, and retail, for example. Therefore, such stocks are worthy candidates for 3Sig. They introduce individual company risk, namely, in that they’ll go bankrupt the way GM did in 2009, but it’s a low risk. Setbacks for such massive companies are almost always temporary, and the recovery from them provides profit potential. The 3 percent signal will catch this, issuing buy guidance of the right size when the stocks slip under the 3 percent growth line and subsequent sell signals of the right size when they recover back above the line. The deeper they dip, the more you buy; the higher they spike, the more you sell.
Smaller, aggressive companies can work, too. They introduce a higher risk of company-specific trouble and bankruptcy, but might be worth it with a tiny portion of your overall portfolio. You could implement 3Sig using a small-cap fund in your retirement account with the bulk of your nest egg, but keep a play account on the side for individual stock ideas. Some of these you’ll probably want to actively trade for kicks, on the off chance that you get the timing right and make a few bucks, thereby creating your own chapter in Peter Perfect’s Big Book of Stock Stories. You know by now that these fliers aren’t to be relied upon for real financial planning, but you might find one that works better with 3Sig than old, reliable IJR. You should not, however, run it in place of your core plan using IJR or an equivalent; you should run it in addition to your core plan. Whatever excess profits it produces are strictly icing on the cake, the product of a dash of luck as much as anything else.
A good way to use individual stocks is in an account that receives shares of your company’s stock as part of your compensation. One problem with these types of accounts is that people let them build up until they own many thousands of shares of their employer’s stock. This creates a risky situation when the company runs into trouble and the stock drops. Suddenly, the once-large employee stock account gets cut in half. Even worse, the very trouble cutting the stock in half could be bad enough to cost the employee’s job. Talk about a double whammy. “Here’s your pink slip and your most recent retirement account statement,” says the boss. The pink slip tells you to pack up your office before noon and turn in your badge. The account statement says you’re half as well off as you thought you were—just as you head to the unemployment office.
A way to avoid this double whammy is to manage your employer stock account with 3Sig so you build up a safe bond buffer and avoid concentrating too much of your well-being in the fortunes of one company.
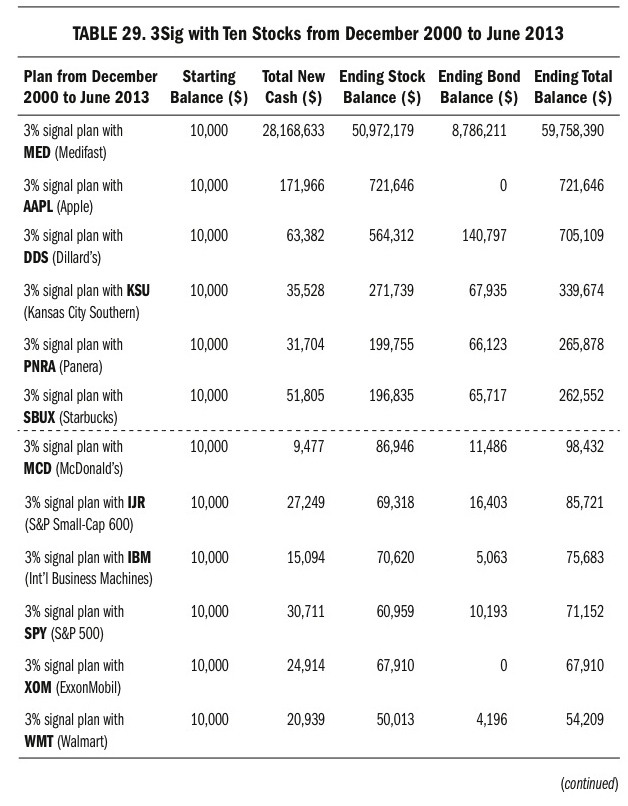
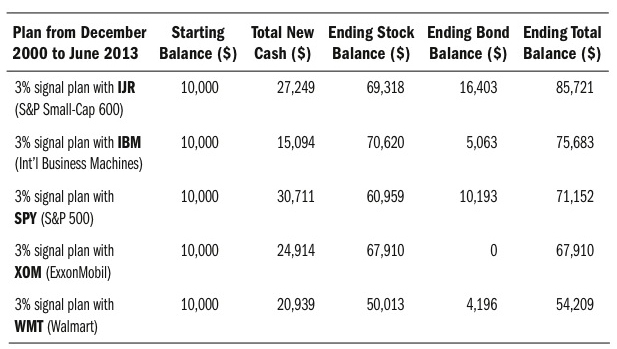
With these considerations in mind, let’s see how we would have fared in a variety of ten individual stocks using our base-case 3 percent signal plan over the fifty quarters from December 2000 to June 2013, compared with our standard IJR and SPY vehicles, sorted in descending order by ending total balance:

Visit (http://bit.ly/1ySX7lM) for a larger version of this table.
Visit (http://bit.ly/15DYHhO) for a larger version of this table.
What a hodgepodge this turned out to be. Our old friend Medifast continued its entertaining ways, delivering a jaw-dropping ending balance of $59,758,390. Fantastic, except for the quibbling detail of requiring $28,168,633 in new cash to do so. If you had a spare $28 million during this period, then running the plan with MED would have been a good way to turn it into $60 million. I’m guessing few of my readers fall into this category, and would not have been able to fund the requirements for Medifast, Apple, Dillard’s, or Starbucks.
Kansas City Southern paid off for those able to afford the $35,528 of new cash it required. Panera was also very good. McDonald’s and IBM required less new cash than IJR and SPY. Even so, McDonald’s outperformed both index ETFs, delivering an ending balance of $98,432, compared with $85,721 for IJR, and requiring only $9,477 in new cash compared with IJR’s $27,249. You may think Apple was an easy choice, but in 2000, when this time frame began, it had not yet invented the iPod, iPhone, or iPad, and was much less easy an investment choice than it might appear to be today.
McDonald’s provided the best balance between new cash required and performance delivered. The problem is you didn’t know in 2000 that McDonald’s was going to do better than Exxon, IBM, and Walmart in the next fifty quarters, and you don’t know now which stock is going to do better in the coming fifty quarters.
You certainly can’t count on the z-vals for help. Back in September 2000, McDonald’s worried that weak foreign currencies would hamper its earnings, which they did, and the z-val covering the stock at Bank of America downgraded it, even though McDonald’s said it would keep growing at its planned pace. In April 2002 a Fortune article headline began, “Fallen Arches McDonald’s Has Had Six Straight Earnings Disappointments,” and the story reported that a z-val at Argus Research “not only slapped a sell on the stock in January—she announced that she was dropping coverage this month. Why? Because clients are no longer interested.” The Argus z-val said, “McDonald’s is not a growth company anymore.”
As you can see, it was anything but obvious to have owned McDonald’s during the fifty quarters we’re looking at. In retrospect, we know that buying the stock like crazy when the z-vals announced that McDonald’s was a goner was a great move. There was plenty of time to acquire shares as MCD fell from $30 in April 2002 to $13 in March 2003, which our 3 percent plan signaled to do. From their March 2003 low, shares of MCD recovered dramatically to $100 in January 2012. In this case, the Argus z-val was right to urge selling the shares in January 2002 to avoid the steep drop ahead, but her subsequent decision to stop covering the company due to lack of client interest was precisely wrong. Over the long term it would have been more beneficial to create interest in the stock, to tell clients to begin a buying program in MCD that acquired as many cheap shares as possible in the weak year ahead. Such a plan would have profited handsomely when MCD recovered, as our 3Sig results prove. The z-val tendency, however, is to bad-mouth and ignore stocks in cheap phases and praise them relentlessly in expensive phases, exactly the opposite of what produces profit. The 3 percent signal relies on arithmetic to overcome this media mistake.
Z-vals are no more helpful when it comes to avoiding dangerous stocks, by the way. The June 2, 2008, Barron’s cover story, “Buy GM,” was introduced thusly: “General Motors’ turnaround could accelerate in coming years, driving handsome gains for bold stockholders.” GM accelerated all right, but into a brick wall. A year later, it was bankrupt.
Don’t get too excited about the winning stocks among the ten we’ve just tested, because a lot of what you’re seeing is simply that the best-performing stocks of the time frame did the best in 3Sig as well—no great mystery. The same way you would have bought Medifast at $0.14 in 2000 if you’d known then what you know now, so, too, you would have chosen to run McDonald’s in 3Sig rather than IJR. This is hindsight bias in all its glory.
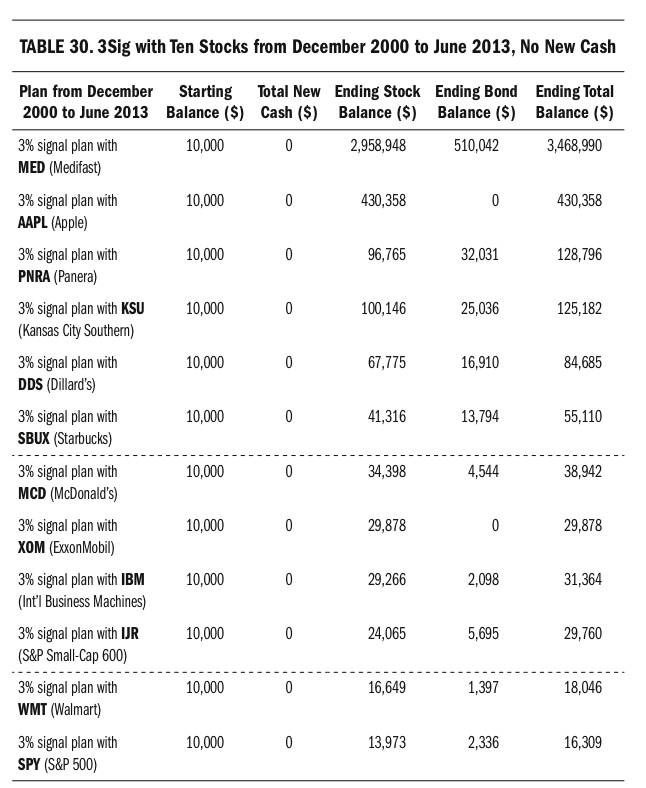
The more valuable takeaway than any specific stock to use in the plan is that 3Sig is a good way to own individual stocks if you decide to dabble in them. Remember how we eviscerated Peter Perfect’s story of Medifast riches back on page on page 94? He spun a tale of turning $10,000 into $1.84 million. We ran the stock through 50 percent odds of taking the wrong action as its price fluctuated dramatically and found that the optimistic scenario created an ending balance of just $44,601, and the pessimistic scenario, only $14,191. Owning the stock with our 3 percent plan and no new cash provided, by contrast, turned $10,000 into $3.47 million with $510,000 of it in safe bonds at the end of the time frame. This ending balance is 90 percent more than buying and holding produced, and a sensational seventy-eight times more than the 50 percent mistake rate of human judgment produced.
You might like to see this angle on all the stocks we’ve just covered, so here are the results of the usual plan running the ten stocks plus IJR and SPY, but with no new cash provided, sorted in descending order by ending total balance:
Visit (http://bit.ly/1Bliddx) for a larger version of this table.
The 3Sig plan is a fine way to manage an individual stock position, but the persistent fly in the ointment is that nobody knows in advance which stocks will do best, or do well—or even survive, for that matter. Remember: stocks can go bankrupt; indexes can’t.
I recommend that you manage most if not all your money in the reliable version of the plan, which uses IJR or another small-cap index equivalent. If you’re tempted to risk some of your money on individual stock ideas, then do so with the 3 percent plan separately from your core plan. This way, if you end up in the wrong individual stock—as people tend to do—at least the plan will protect you from your own worst instincts and do its best to manage the stock’s volatility to a decent profit. If you end up in a winner (such as Medifast, Apple, Panera, Kansas City Southern, or Dillard’s in the time frame we’ve been examining), the plan will help you extract money from its path higher without needing to consider stressful choices.
Safer Puzzle Pieces
Most of this section has looked at investments other than small-cap stocks to use on the growth side of 3Sig, in search of higher returns. We found some that could work, and I’m sure there are others, but this book’s base case strikes about as good a balance between risk and reward as the plan can deliver.
You may be less interested in boosting the reward side and more interested in decreasing the risk side. If so, you’ll be pleased to know there are ways to do so. The simplest is to increase your allocation to bonds. Even if you’re in your younger working years, you might decide you’d rather forgo stronger overall performance in favor of a more peaceful journey. Moving your target bond allocation up to 30, 40, or even 50 percent would accomplish this. I urge you to think carefully, however, as the plan’s base 80/20 allocation between stocks and bonds is pretty safe, and nearly guaranteed to come out ahead of a higher bond allocation in the end.
Beyond this, a more drastic dose of safety is easy to achieve by substituting cash for bonds. This would get around interest rate risk. Using cash instead of bonds makes the safe side as safe as it can be, with zero fluctuation. It won’t grow as much as the bond side over time because the steady stream of bond dividends is hard to get from money market interest rates, but it will certainly offer peace of mind. Here, too, consider carefully because the plan run with bonds performs much better than the plan run with cash, and bond indexes are quite safe.
Finally, you could swap in a total stock market index fund instead of the plan’s small-cap index fund. This would neutralize the chance that small caps will underperform over an extended period. With a tiny 0.05 percent expense ratio, the Vanguard Total Stock Market ETF (VTI) covers 100 percent of the investable U.S. stock market, all company sizes and flavors. Running 3Sig with VTI on the growth side and the Vanguard Total Bond Market ETF (BND) on the safe side would be about as evergreen an arrangement as you could assemble.
I still recommend the book’s base-case plan running a small-cap stock index on the growth side, a bond index on the safe side, and an 80/20 stock/bond target allocation for most of your working years. If, however, you want more comfort, the plan can accommodate safer puzzle pieces and still keep you out of the clutches of Peter Perfect and the z-vals.
Executive Summary of This Chapter
Our goal is to beat the S&P 500 index of large-company stocks, but there’s no rule saying we can’t use a different index to do so. We’ll use small-company stocks for most of our capital, and bonds for the safe portion of our plan. The higher volatility of small-company stocks improves our plan’s performance, and automated reliance on the bond fund keeps us better committed to staying the course than would a fully invested dollar-cost averaging plan. Key takeaways:
 Small-company stocks outperform their larger-company peers with more volatility, which our plan transforms into extra profit with signals to buy low and sell high. The higher performance and extra profit extraction provide us with a double advantage.
- The only real competitor to our 3 percent signal plan is dollar-cost averaging, which invests more money on a fixed schedule no matter what’s happening in the market.
- A weakness of dollar-cost averaging is that it’s always fully invested with no mechanism for reacting to market movement. This is not emotionally comforting to investors in terrible times, and many panic as their balance collapses, then sell at the wrong moment.
- The emotional stress caused by dollar-cost averaging when it’s used on a single stock fund leads most people to divide it across many funds. Doing so underperforms a focus on small-company stocks, which is a key part of 3Sig.
- The 3 percent signal’s automated buy/sell guidance in response to market movement provides investors with emotional comfort to stay the course and benefit from the high performance of small-company stocks.
- These advantages enable 3Sig to outperform dollar-cost averaging even when it’s used on the same funds, and to greatly outperform it when it’s used on other funds, the vast majority of which underperform the market indexes used in our plan.
- After an extreme sell-off, defined as a 30 percent drop in SPY on a quarterly closing price basis in the previous two years, our plan will temporarily stay put in its stock fund by ignoring the next four sell signals. This is the “30 down, stick around” rule.
- The “30 down, stick around” rule takes advantage of historically high odds for an extreme sell-off to be followed by a strong recovery, during which we want as much profit as possible by staying fully invested in stocks.
- Other permutations of the plan are possible, such as using sector funds, growth and value funds, individual stocks, or cash instead of bonds, but nothing delivers more compelling performance than the base case using an 80/20 mix of small-cap stocks and bonds.