So far you’ve learned that we’re bad at forecasting the stock market, but that an automated plan to buy low and sell high gets around this shortcoming by reacting to what already happened. In this chapter, we’ll further define the automation by setting a performance goal that tells us whether the market is high or low. The market moves around all the time, so we need a signal line to put its movement in context. If the market rises above the line, we’ll sell. If not, we’ll buy.
This chapter explains why 3 percent per quarter is the right performance goal and how using it beats other approaches while taking less risk.
What’s a Good Performance?
How much should we expect from stocks? The stories people tell are always about big successes, of course, doubling their money or owning a legendary “tenbagger,” a stock that grows tenfold. These triumphs happen now and then, and they’re a lot of fun, but they’re not reliable and they usually don’t involve enough of our capital to make a meaningful impact. The question to ask when somebody claims to have doubled their money is “How much of your money?”
We need a reliable target that we can achieve again and again as the years go by. The best way to know what’s typical for the market is to look at its historical performance. There’s no guarantee that it will perform similarly in the future, of course, but the past is all we have. The sea of stocks contains individual bankruptcies and tenbaggers and countless variations in between, but how much has the sea itself moved?
The Market Over Time
Various long-term studies of the stock market show its performance to have been about 10 percent per year for the past ninety years or so. This is nominal performance, which is to say before inflation is factored in. Inflation-adjusted performance is called “real performance,” and it comes in at about 6.8 percent per year. The returns for large companies are lower than the returns for medium-size and small companies, but the 10 percent nominal rate of return is a good approximation for what the overall market has delivered, and it’s easy to remember.

Rolling ten-year annualized geometric returns of the broad U.S. stock market, December 1935 to June 2012. © The Vanguard Group, Inc. Used with permission.
The market hasn’t grown as smoothly as annualized performance might make you think, though. The market’s rolling ten-year returns since 1926 have fluctuated from –5 percent to 20 percent, as shown in the chart from Vanguard on page 54.
We’ll use 10 percent as the basic annual growth of the stock market, and improve upon it with 3Sig.
The Outperformance Sweet Spot
“Why three percent per quarter?” you ask. It’s not 1 percent per month or 12 percent per year, neither an intuitive goal nor one you see anywhere else in the investment world, thus a curiosity at first blush. It makes sense upon closer examination, though, so let’s have a look.
Our goal is to beat the market, but by how much? If we assume that stocks will return about 10 percent per year, should we strive for 10.1 percent, 12 percent, 15 percent, 20 percent, or something higher?
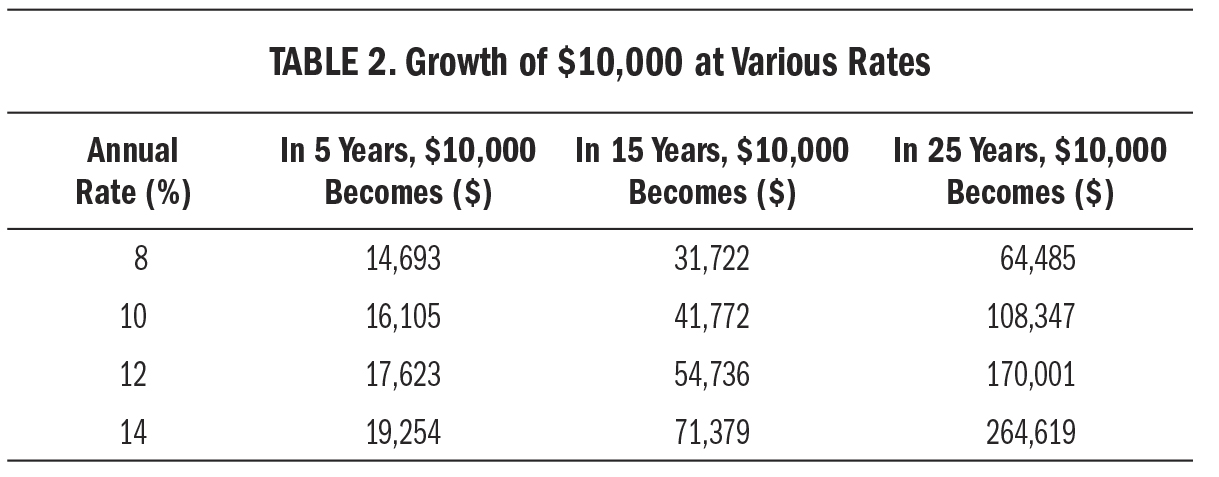
Because we want to achieve our goal repeatedly forever, it needs to be reasonable. Steady outperformance of even a small margin produces a big advantage over time due to compounding. Look at the growth of $10,000 at various rates:

Visit (http://bit.ly/1yDyKcP) for a larger version of this table.
Notice the impact of just two percentage points on your ending balance over every time frame. At 10 percent per year, your $10,000 becomes $108,347 in twenty-five years, but at 12 percent it becomes $170,001—a difference of $61,654. Even the five-year difference of $1,518 will buy two weeks’ worth of dinner for two. Don’t underestimate the benefit of a seemingly small 2 percent advantage. It makes a big difference.
Naturally, we’d like to earn as much as possible. With most styles of investing, the higher the desired rate of return, the higher the risk that goes with it. A safe government bond, for example, offers a low interest rate because repayment is guaranteed. Stock in a risky start-up that might become the next force in business but also might disappear offers those same twin potentials to your money: it might become a tenbagger but also might fall 90 percent. With the system we’re creating, a higher desired rate of return will force us to add money to our plan more frequently because the market will be less likely to achieve our goal. This is easy to understand. If you are aiming for a 10 percent gain every month and will make up for shortfalls with new cash, you’re going to be adding cash almost every month because the market rarely rises 10 percent in a month. Conversely, if you aim for 1 percent per quarter, you’ll make it almost every time and will probably never need to add extra cash—but you won’t grow your wealth enough over the years.
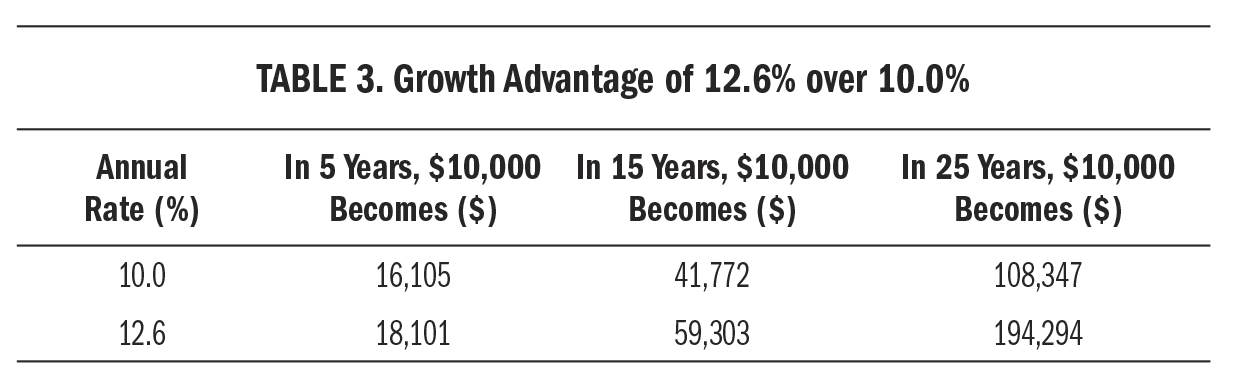
Our goal is 3 percent per quarter, thus the 3 percent signal. Growth of 3 percent per quarter produces an annual performance of 12.6 percent, which is 26 percent better than the market’s annual performance of 10 percent over the past ninety years. This is a giant outperformance that produces much more profit over long periods, as you saw in the previous table. Here is the market’s 10 percent annual rate compared with our 12.6 percent annual rate over the same time frames:

Visit (http://bit.ly/1GJ5E1f) for a larger version of this table.
The extra 2.6 percentage points of performance provide an impressive amount of profit beyond what the market has provided.
I’ve found this 3 percent quarterly rate to be the sweet spot of risk and reward. It’s not so high that we need to take extraordinary measures to achieve it, but it’s not so low that we barely notice the benefit of beating the market. It provides a reasonable boost over stock index performance that adds up to a sizable profit improvement over the years.
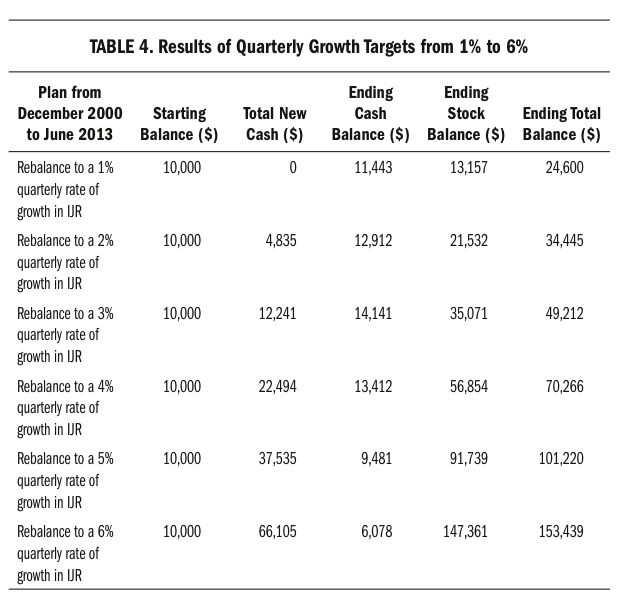
You need to know that I didn’t just pull “3 percent per quarter” out of a hat, so let’s look at how it compares with other rates of return. In the next chapter, you’ll read that small-company stocks are the best category to use with our plan. Throughout later examples, we’ll look at iShares Core S&P Small-Cap (IJR) as a way to invest in them, and we’ll use the fifty-quarter time frame from December 2000 to June 2013. The next table shows the results of different quarterly growth targets run with our plan using IJR in this time frame, beginning with $8,000 in IJR and $2,000 in cash. “Total New Cash” refers to times the plan signaled buying with more cash than the account had, thus requiring you to deposit new cash to keep it going. As you can see, the higher the desired rate of growth, the more new cash that’s occasionally needed:

Visit (http://bit.ly/1AZPnfP) for a larger version of this table.
It is possible to dial in a higher ending balance by moving the growth rate target up. However, it eventually requires a lot more cash to keep the plan going. Quarterly growth rate targets higher than 3 percent ask too much of the market, and therefore frequently signal you to make up the difference with fresh cash. You could aim for a 50 percent quarterly growth rate if you wanted, but you’d end up supplying almost all of the bigger balance with new cash. The rising cash dependency is obvious when you compare the results of a 3 percent target with those of a 5 percent target. To double the ending balance from $49,212 to $101,220, you needed to invest three times the cash, from $12,241 to $37,535. This eroding efficiency persists as the growth rate is ratcheted higher.
The 3 percent quarterly target snags enough oomph from the market to make your efforts worthwhile, but not so much that it demands excessive amounts of cash from you. It’s the sweet spot, a good balance of new cash required and profit achieved.
Gauging Fluctuations Against Our Goal
Now we know how much performance we want from stocks: 3 percent per quarter. How do we go about guaranteeing we get it? By using a safe bond fund to support our stock fund when the market fails to deliver 3 percent in a quarter, and by selling the excess profit from the stock fund when the market delivers more than 3 percent in a quarter.
This strategy is a variation of value averaging, a money management technique introduced by Michael Edleson in a 1988 article and further explained in his book Value Averaging: The Safe and Easy Strategy for Higher Investment Returns. It’s reliable because we simply provide our stock fund with whatever profit the market failed to provide in a quarter, and we replenish our bond fund with excess profits delivered by the market in other quarters. This back-and-forth keeps the stock fund growing at our 3 percent quarterly rate due to basic math, regardless of what the market does. The engine behind the long-term growth of our stock fund is provided by the market, but when that engine sputters we help it out with our safe bond fund.
You saw this concept in a chart in the last chapter on page 48, and in action when we set a system of buying price drops and selling price rises in the fictional coin toss market. Doing so produced a better performance than the market itself. In that example, the market moved in 5 percent increments, and we reacted to it by either buying or selling an amount worth 5 percent of our stock balance.
The real market moves in whatever amount it wants in whatever time frame it wants, rather than in clean 5 percent increments. Our real-life plan will respond in spirit the same way we responded in the coin toss market, by selling price rises and buying price drops at the end of each quarter. Instead of moving 5 percent of our stock balance each time, we’ll buy or sell our way to the 3 percent quarterly performance goal we’ve set. This means the amount we buy and sell will change each quarter, which is better than the fixed reaction we used earlier because it enables our plan to reallocate in proportion to how far the market moved rather than buying and selling a set percentage of our stock fund. If the market goes up a lot, we should sell a lot. If the market goes down a lot, we should buy a lot. Our plan will do both.
How do we know how much is a lot? By comparing the rise or fall to our 3 percent quarterly goal. That’s our signal, showing us both whether to buy or sell and how much to buy or sell, every quarter.
Quarterly Time Frame
“Why quarterly?” you may wonder. After all, the market is active every business day, and paychecks arrive either once or twice a month, so it might seem odd to check our portfolio only four times per year. The investment media create the impression that frequent activity increases one’s control and therefore boosts performance, but as usual, the evidence runs contrary to the propaganda.
In the January/February 2013 issue of Financial Analysts Journal, Roger Edelen, Richard Evans, and Gregory Kadlec published a paper titled, “Shedding Light on ‘Invisible’ Costs: Trading Costs and Mutual Fund Performance,” in which they reveal that mutual fund managers who trade frequently run up higher transaction fees and achieve worse performance.
A 1997 study by Richard H. Thaler, Amos Tversky, Daniel Kahneman, and Alan Schwartz published in The Quarterly Journal of Economics, “The Effect of Myopia and Loss Aversion on Risk Taking: An Experimental Test,” explored the impact of information frequency on investment performance and came to similar conclusions. Participants were told to imagine they managed the endowment portfolio of a college and would invest it in a simulated financial market. At the end of the study, they would receive a sum of real money commensurate with their performance, thus encouraging everybody to do as well as possible. There were just two mutual funds in the market, A and B, and participants had to decide how many of a 100-share allotment to allocate to each. The period covered twenty-five simulated years. Participants were randomly assigned how often they would be informed of their portfolio’s performance for a chance to change the allocation between the two funds: monthly, yearly, or every five years during the simulated time period.
Since nobody knew anything about the two funds, most began with a fifty-fifty division between them. As updates arrived, they adjusted their allocations. Participants receiving five-year updates could make only a handful of adjustments, while those receiving monthly updates had hundreds of chances to make moves. The end result? People receiving updates every five years more than doubled the returns of those receiving monthly updates.
One of the funds simulated the behavior of bonds, the other the behavior of stocks. The bond fund changed little month to month and almost never lost money. The stock fund was much more volatile on its path to stronger long-term performance. While the bond fund rarely slipped, the stock fund lost money in about 40 percent of the simulated months. The maximum performance would have been achieved with a complete allocation to the stock fund because its frequent losses were more than offset by higher overall gains. It delivered few losing years, for instance, and no losing five-year runs. Participants seeing monthly updates experienced the short-term losses in the stock fund, however, and reacted by moving money into the safer bond fund, thus crimping total performance. Participants receiving fewer updates saw the bigger picture of the stock fund performing better, without seeing its higher volatility between updates. By the end of the simulation, the participants updated monthly had allocated only 40 percent of their money to the stock fund, compared with 66 percent for the participants receiving updates every five years.
Add these studies to the profusion of research showing that passive investing, doing little or almost nothing with long-term investments, is the path to better performance. Why? For all the reasons you read about in Chapter 1 concluding that people are bad at picking stocks and timing the market. Humans are so prone to error in the stock market that more information leading to more activity just means more mistakes, along with higher fees incurred to make them. This fact prompts learned veterans of financial research to advise newcomers, “Don’t just do something, sit there!”
Professional money managers never will, though, even as we see that the more they manage, the more fees they rack up, the more mistakes they make, and the more their performance suffers. We must learn from their mistakes, and the lesson we’ll take away is that we should involve ourselves very little in the day-to-day vicissitudes of our stock account, filing those vicissitudes under the catch-all “fluctuation” label while focusing our energy on more meaningful aspects of living. We’ll check in just four times per year, and in a systematic manner at that.
This quarterly schedule is just right. It gives the market three full months of moving around before we rebalance back to target. Three months is enough time for a lot of up and down to happen, for trends to get under way or wrap up. A monthly schedule tends to interrupt cycles. More important, historical testing of the plan shows that frequencies higher than quarterly ones increase activity without increasing performance. You’ll buy more and sell more, but you won’t make more. Our aim is to maximize profits while minimizing activity, and a quarterly pace achieves this aim.
It also provides opportunity for you to do something in reaction to what’s happening in the news, but not too much. Investing doesn’t take place in a vacuum, and people are proven meddlers. When we get the feeling that everybody is taking action now, we want to take some kind of action, too. Waiting until the end of the year to measure our performance against a growth target is too long for many people, and doesn’t allow for the plan to react to subcurrents during the year.
Our systematic quarterly plan comes up often enough to remind us that we’re not neglecting our financial duties, but infrequently enough to prevent Peter Perfect from dragging us off course and into the sand traps of whimsical judgment.
How It Works
We’ve established so far that we’re going to aim for 3 percent growth on a quarterly basis, and that we’ll buy our stock fund up to that signal line or sell it down to that signal line every quarter.
We’re going to stop tossing coins and start using real market data. Let’s run through an example using the 3Sig plan with the S&P 500, the definitive index of large-company stocks, covering three-quarters of the American stock market’s capitalization. The S&P 500 contains lots of companies you know, such as Apple, Chevron, Google, and Wells Fargo, in addition to many you probably haven’t heard of, such as Allergan (a pharmaceutical company in California, maker of Botox), Leggett & Platt (a manufacturer in Missouri), and NiSource (a utility in Indiana).
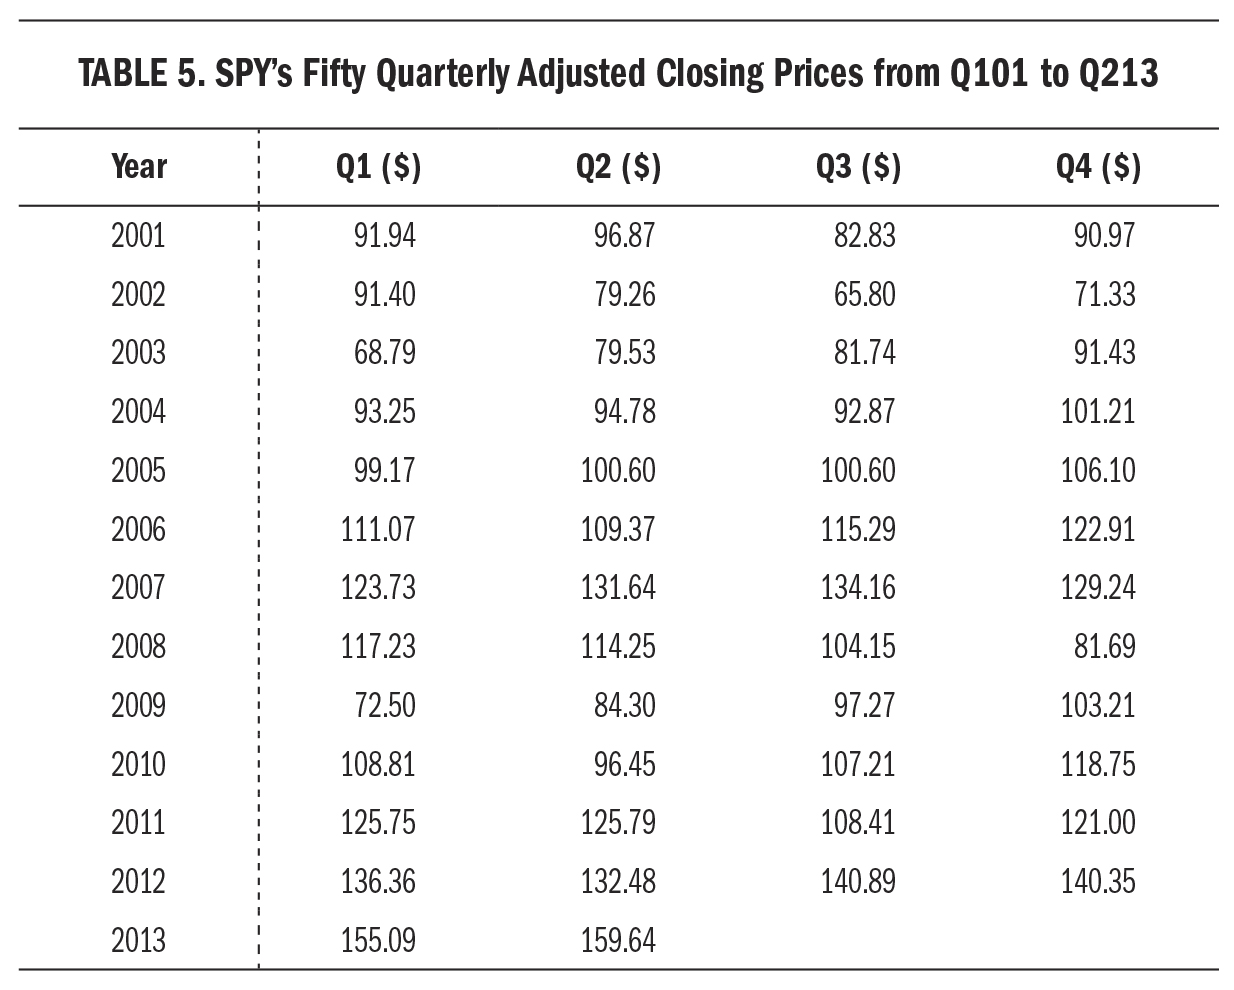
As we did in the coin toss example in the last chapter, and consistent with the base case of 3Sig, we’ll begin with an 80/20 division of our capital between a stock side and a safe side. The stock side will own the S&P 500 as represented by the SPDR S&P 500 ETF (SPY). The safe side will own the Vanguard GNMA bond fund (VFIIX). Instead of fifty coin tosses, we’ll use fifty calendar quarters of adjusted SPY closing prices from the beginning of 2001 to the middle of 2013. This twelve-and-a-half-year time frame saw part of the dot-com crash, the roaring housing market recovery on Federal Reserve stimulus and lax lending standards, the subprime mortgage collapse, and part of the next recovery on more Federal Reserve stimulus—something for everybody. Here are SPY’s fifty quarterly closing prices throughout the drama:

Visit (http://bit.ly/1yZf84W) for a larger version of this table.
Summarized this way, the stock market isn’t so daunting, is it? For all the strong opinions from bulls and bears, vociferous presentations predicting future direction, projected impact of a showdown in Washington or geopolitical outburst overseas, and speculation on the Fed’s next move, the only thing that matters is a handful of prices. Some are high, and some are low as the market moves up and down in response to waves of human emotion washing over it. Rather than looking as silly as the z-val “pros” running around guessing loudly what will happen next, we’ll react to each quarterly closing price by selling or buying our stock fund to the 3 percent signal line. As we do so, we’ll wonder what all the fuss is about.
Let’s say we began with $10,000, as in previous examples. The 80/20 starting mix between our stock side and our safe side put $8,000 in SPY and $2,000 in VFIIX. The year-end 2000 price of SPY was $103.09, so our $8,000 owned 77.6 shares. Our $8,000 plus 3 percent put our 3 percent signal line at $8,240 for the first quarter of 2001. The closing price of SPY that quarter was $91.94. Our 77.6 shares times $91.94 were worth only $7,135, which was $1,105 below our signal line at $8,240, so we needed to buy 12 shares of SPY to catch our stock fund up to the 3 percent signal line. SPY paid a dividend of $0.316 that quarter. Multiplied by our 77.6 shares, the dividend added $24.52 worth of new VFIIX shares to our VFIIX balance, plus VFIIX itself paid a dividend of $0.170. Together, the dividends brought our VFIIX balance up to $2,141. Buying 12 shares of SPY at $91.94 used $1,103 from our VFIIX balance, and our stock fund rose to 89.6 shares of SPY worth $8,238—close enough to the $8,240 signal line we wanted.
Observe the magic at work here. This simple plan of making up the difference between what the market delivered and our 3 percent signal line guided us to buy SPY at a price almost 11 percent cheaper than it had been three months prior, when we began our plan at the end of December 2000. Do you think most stock investors were eager to buy after the S&P 500 fell 11 percent in the first quarter of 2001? Not on your life. Peruse the zeitgeist back then.
The New York Times reported on February 22, 2001, “The pessimism gripping United States stock markets deepened yesterday, as investors nervous about weak corporate earnings and higher inflation sent stocks to new lows for the year.”
BBC News reported on March 14, 2001, “Stock markets around the world are falling because they fear that the slowdown in the economies of Japan and the United States could become global, hurting company earnings.”
The New York Times reported on March 15, 2001, “The stock market fell sharply yesterday, with the Dow Jones Industrial Average falling below 10,000 for the first time in five months . . . The Federal Reserve, which has cut short-term interest rates twice this year, is widely expected to cut rates again next week, but investors appear to be losing faith in the Fed’s ability to engineer a quick recovery. . . . The decline ‘worries me,’ President Bush said.”
Businessweek reported in a story headlined, “When Wealth Is Blown Away,” on March 25, 2001, “Many terrified—and suddenly poorer—investors now sit paralyzed on the sidelines. . . . [T]he plunge in stocks has them holding onto their wallets for dear life. . . . [which] could lead to more cuts in consumer spending and further depress corporate profits, sending the stock market into a downward spiral. ‘It’s going to be sharper on the downside than it even was on the upside,’ says [one of the many z-val economists offering predictions].”
Following this commentary, SPY gained 5.4 percent in the second quarter of 2001.
While the rest of the investment public attempted to navigate such observations, which emphasized freezing in place or selling to prevent further damage, you pulled out your calculator to see that SPY’s price at the end of March 2001 put you way below the 3 percent signal line, and you bought the number of low-priced shares needed to catch up. End of involvement. As the z-val crowd pontificated, you spent a grand total of fifteen minutes to outperform them in the very next quarter. Remember, most z-vals lose to the plain index over time. Our 3 percent signal plan beats the index, thereby beating almost every “pro” who manages to get his or her name in the news with what you’re coming to see as merely distracting commentary.
How It Performs
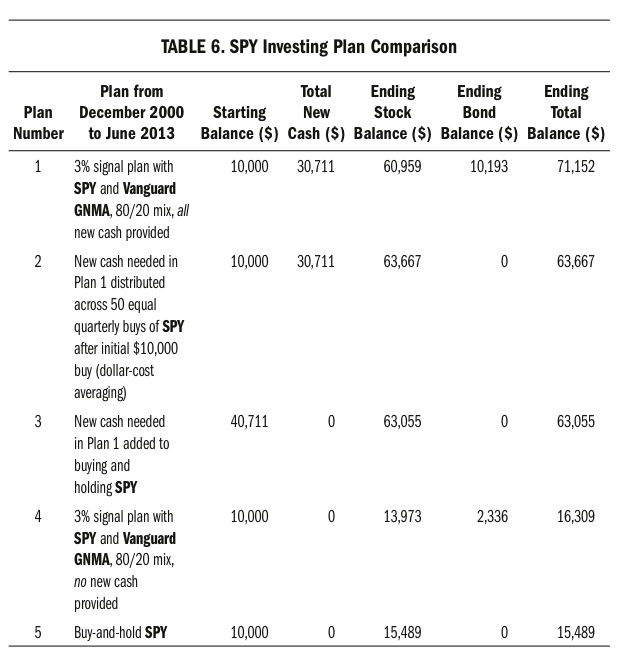
Following the same simple procedure at the end of each quarter that we followed at the end of the first quarter of 2001, our 3 percent signal portfolio outperformed the S&P 500. The extreme market swings that characterized the period would have signaled buying amounts that exceeded our cash balance in nineteen quarters—although one did so by only $58, another by only $111, and nine others by less than $800, so eight quarters is more like it—for a total of $30,711 of new cash needed. (We’ll explore later the occasional need for extra cash.) Had you followed the plan and added new cash in the nineteen quarters that needed it, you would have ended with a balance of $71,152 instead of SPY’s ending balance of $15,489 with all dividends reinvested. Stripping out the $30,711 of new cash required during this time period’s extreme sell-offs to keep the buy orders going (about $205 per month over the 12.5-year period), you still grew your initial $10,000 into $40,441. That’s 161 percent better than buying and holding the market would have achieved.
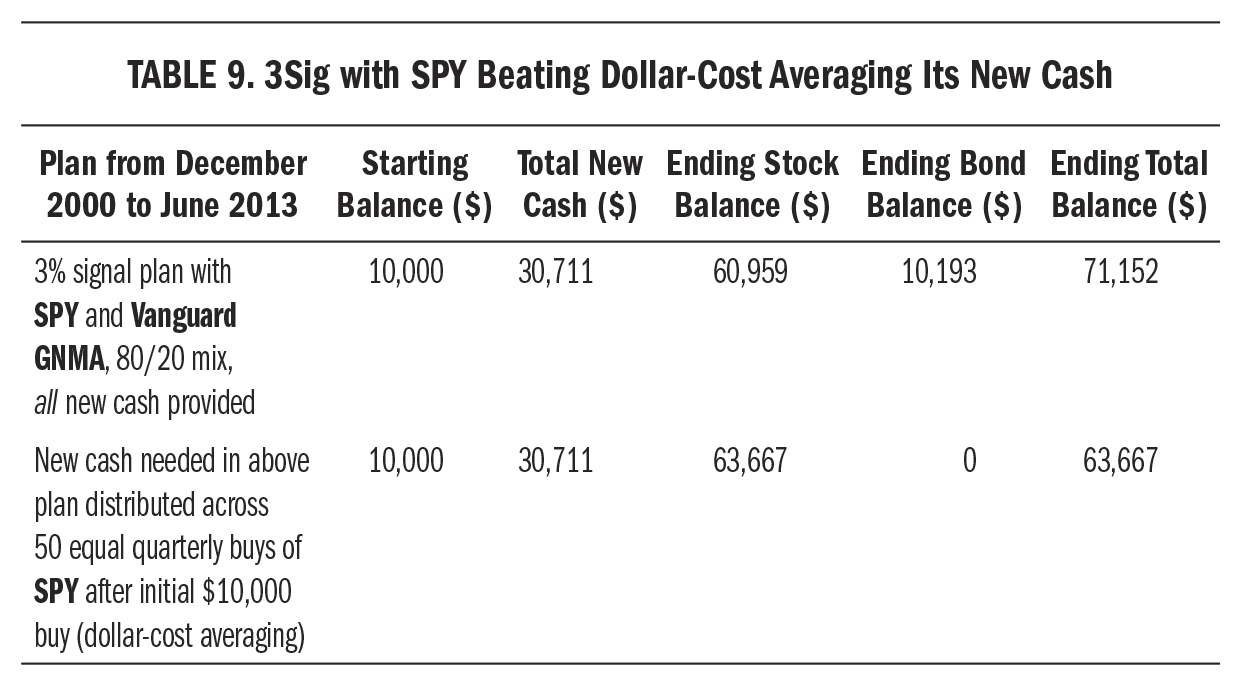
In the next table, these results are summarized and compared with those from other plans using the same two stock and bond funds, SPY and Vanguard GNMA. The plans are arranged in descending order by ending total balance. Notice the strong performance of 3Sig when it fully funded all buy signals by adding new cash when its bond balance was insufficient, but also when it funded none of them beyond the buying power of its bond fund balance, as shown in the superiority of Plan 4 over Plan 5:
Visit (http://bit.ly/1wsKjyb) for a larger version of this table.
The top-performing plan was 3Sig, with all buy signals funded. Dollar-cost averaging Plan 1’s new cash amount into SPY across all fifty quarters of the time period, as shown in Plan 2, didn’t work better. Even investing all the new cash demanded by Plan 1 in SPY at the beginning of the time period produced inferior results, as shown in Plan 3. The final apples-to-apples comparison, between Plans 4 and 5, with no new cash in either case, shows 3Sig beating a plan that just bought and held SPY the whole time.
Dollar-cost averaging is the technique of contributing a fixed amount of money to an investment on a regular schedule, such as monthly or quarterly. Dollar-cost averaging into indexes and buying and holding indexes are the two most popular set-and-forget investment techniques. Each performs much better over time than almost all z-val advice, of course, but 3Sig performs even better than both, and does so more safely by keeping some of its assets in a bond fund. This makes for not only a better raw performance but a better risk-adjusted one, too. Plan 1 beat Plan 2 with 14 percent of its ending balance in safe bonds. Ditto with Plan 4 over Plan 5. We’ll look at this advantage more closely later.
Finally, this stronger 3 percent signal performance is after we’ve been overly generous to dollar-cost averaging plans and buy-and-hold plans. In real life, almost all of them distribute capital across several different funds rather than concentrating on one stock market index, as the examples just given show. When people diversify across several funds and asset classes, they do worse over long time periods than they would have done by just buying and holding a stock index. This is due to what you learned in Chapter 1 (that most managers lose to the market) and also because nonstock funds will underperform stocks over time.
To show that 3Sig is better than just about anything else, we compared it not to run-of-the-mill rivals but to high-performance versions of dollar-cost averaging and buying and holding. It still came out on top.
The Myth of Buy-and-Hold
There’s a key point we have to consider here, however, and it’s that people don’t buy and hold through awful times. Like accurate market forecasting and Peter Perfect’s track record, buying and holding through thick and thin exists only in theory for almost all investors. Given the fear-inducing headlines and commentary that appear during sell-offs, no wonder people bail out at the worst possible moments and fail to get back in until most of the recovery is gone.
3Sig helps buck these emotional urges by showing in a simple formula when it’s time to buy more shares on the cheap or, at the very least, hold on to what you already own. Glance back at Table 5 showing all fifty quarterly closing prices for SPY. From the third quarter of 2007 to the first quarter of 2009, the price of SPY fell 46 percent. A theoretical buy-and-hold investor who began the time frame with $10,000 in SPY saw the balance drop from $14,888 in the third quarter of 2007 (Q307) to $8,375 in Q109, a 44 percent loss. The balance fell less than SPY’s price fell, due to dividend reinvestment. Imagine the feeling of doing nothing while your account dropped 44 percent on pessimistic commentary.
Everybody believes in buy-and-hold when times are good, but almost nobody does when times are bad. A fully invested portfolio looks most brilliant just before it collapses. The odds are overwhelming that our buy-and-holder watching her balance fall from $14,888 to $13,158, then $12,899, then $11,836, then $9,364, then $8,375 would have pulled the rip cord from a low altitude and sworn off stocks forever—or at least until the bulk of the recovery was over and the z-vals started talking about how much profit the smart money made from the bottom, which, of course, nobody other than Peter actually bought.
This tendency is compounded by the very reason some advisers advocate buy-and-hold investing, which is that the bulk of market gains happen on just a few days. It’s true that a person who buys and holds is guaranteed to be in on those days, but because buying and holding is so psychologically difficult to maintain when it maximizes losses at the market’s lowest points, it sets the odds of abandoning the technique highest just when it’s about to finally pay off. Ironically, then, a strategy that’s supposed to guarantee that a person’s money will be invested during the tiny subset of days that produce gains actually makes it likely that person will bail out just ahead of such days precisely when holding on is most desirable.
The very commitment to buying and holding is what leaves people invested to the point of greatest pain, when they sell. If they weren’t committed to buying and holding, they would give up earlier and spare themselves some of the spiral to the bottom. Anybody can ignore a small loss, and maybe even a medium one. It’s the big ones that shake ’em loose. Being fully invested to the bottom of a stock market crash is emotionally excruciating. The final, dominant urge is “Just get me out of here. I don’t care what the market does next, I simply don’t want to be part of it anymore.”
Buy-and-hold is what people say; buy-and-bail is what they do.
Any system that doesn’t precondition both the investor and the portfolio for falling prices runs a high risk of exceeding the investor’s emotional fortitude and suffering the performance-killing decisions that follow. This aspect of investing is usually relegated to a tiny subsection within presentations on formulas and advice for staying disciplined, but the emotional weakness of human beings is the primary reason we fail at investing. It’s not a subpoint at all; it’s the main point.
There are two classic mistakes that emotional investors (which is to say, all investors) make: buying the top and selling the bottom. We can’t say which is worse, because one leads in the direction of the other, but here we’re looking at the problem of crying uncle at the bottom. When we do so, we’re engaging in a kind of market timing without even knowing it. The motivation is to stop the pain, but selling as a way to do so assumes that the market will keep going down. If we knew it would go up, we’d stay put and let the rising prices assuage our suffering. We think it will never stop, though, so we get out of the market.
Strategies that leave us deciding with our emotions when to be in and out of the market almost always miss the bulk of the market’s performance. Numerous studies have confirmed that the market’s rising and falling are unevenly distributed, with most days going nowhere as movement concentrates into a small number of remaining days.
In February 2013, for example, the investment company Fidelity published charts showing that the worst times are actually the best times to invest. It showed four examples of this, each detailing the five-year gain in stocks following the bottom of a bear market: 367 percent after the Great Depression ended in May 1932, 267 percent after the 1970s malaise recession ended in July 1982, 251 percent after the most dramatic Federal Reserve interest rate tightening ended in December 1994, and 111 percent after the Great Recession kicked off by the subprime mortgage crash ended in March 2009.
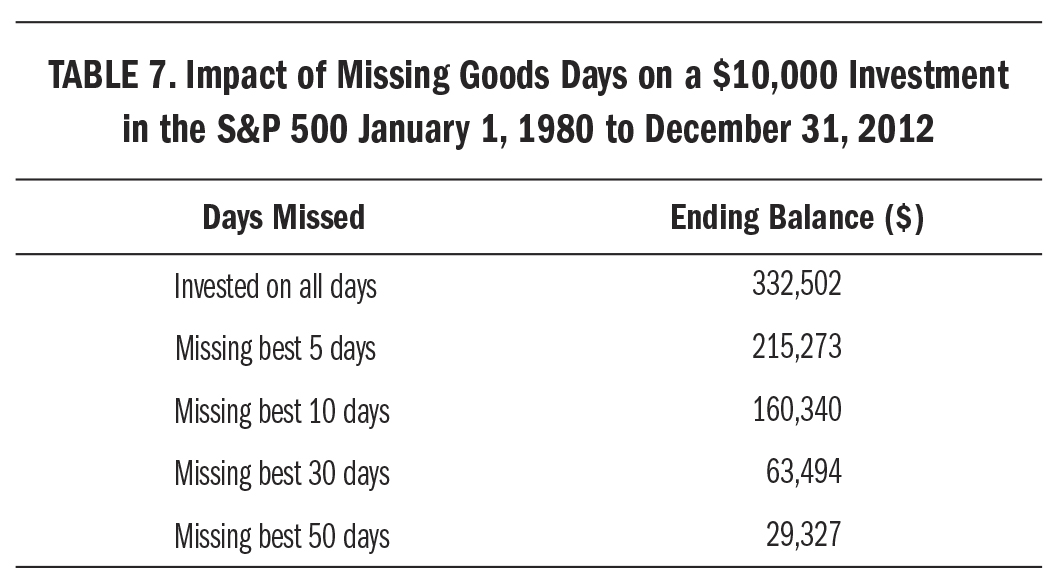
The same report demonstrated the impact of missing the small number of days when the market staged its biggest moves higher. Had an investor beginning with $10,000 on January 1, 1980, stayed fully invested in the S&P 500 through December 31, 2012, her account would have been worth $332,502. Had she missed the five best days—just five days in a thirty-three-year time frame—she would have forgone $117,229 in profits to end up with a balance of $215,273. The same calculation was run removing the ten best days, thirty best days, and fifty best days to create a convincing illustration that missing concentrated up moves inflicts severe performance damage. Remove the fifty best days from this investor’s thirty-three-year journey, and the final account balance falls $303,175, to a paltry $29,327. Here’s the summary:

Visit (http://bit.ly/1CKDRHz) for a larger version of this table.
This type of research is usually rebutted by z-vals showing that returns are similarly improved by missing the worst days. In both cases (missing the concentrations of the best days and worst days), the conclusion is mathematically obvious. Look how self-evident the answer is when we frame the question this way: “Gee, I wonder what will happen to my performance if I remove some of the very best days. Oh, what do you know? It went down.” Conversely: “Hmm, let’s see where performance goes when I remove some of the very worst days. How about that? It went up.” It doesn’t take much imagination to get the picture.
Of course removing the best days will result in lower performance, and of course removing the worst days will result in higher performance. Therefore . . . what, exactly? Since none among us knows ahead of time which days will be the best and worst, we’re back to coin tossing. There’s a 50 percent chance you’ll correctly get out of the market ahead of the good days and bad days, and another 50 percent chance you’ll reenter ahead of the good days and bad days. This leads most academics to conclude that staying the course is the best way to go because the market rises over time, so the great days will overcome the bad days to net out to the long-term performance of the market.
Wouldn’t it be great, though, if we reacted just a little more intelligently to these good days and bad days? If only there were a system that told us when the good days added up to a level where profits should be harvested, or the bad days compounded down to a level where new money should be invested. Oh, wait, there is such a system: 3Sig. It keeps you mostly invested all the time, and guides you to do the right thing when the world goes frothy and it’s harder than ever to think straight. Over a lifetime, mostly invested in practice trumps fully invested in theory.
Outperforming with Less Risk
Even though buy-and-hold is a fantasy, it’s often used as the benchmark to judge various investment plans. The common question is “Does the plan earn enough more than buying and holding to make it worthwhile?” With 3Sig, the answer is yes, as you read in “How It Performs” on page 67. It’s even worthwhile with a low percentage of capital in stocks, one so low that the plan requires no additional cash.
To have avoided needing any cash infusions in 3Sig during the time period of the example we’re considering, we would have had to begin with a conservative 37/63 mixture of stocks and bonds, or $3,719 in SPY and $6,281 in VFIIX. Nobody could have known this at the time, and our plan doesn’t require getting the balance perfectly right, but if somebody had been very careful during the dot-com crash when this time frame began and chosen to start with such a cautious allocation, they still would have outperformed buying and holding SPY to the middle of 2013.
This consideration is called “risk-adjusted performance.” It takes into account that there’s more to an investment story than just raw growth. Sure, somebody somewhere may have doubled his money, but how much risk did he take to do so? Probably quite a bit. Somebody else may have earned far less, but probably faced a lot less risk. This matters because risk tolerance varies among people, and many are willing to accept lower returns for the comfort of lower risk. Thus, if you can outperform the stock market while allocating only a portion of your capital to stocks while some remains safely in bonds, you’ll achieve higher risk-adjusted and raw performance than an all-stock portfolio that’s buffeted by every market storm.
This is what 3Sig achieved when it began the time frame with only 37 percent of its capital in SPY, and it never needed fresh cash. The buy-and-hold SPY balance ended at $15,489 including all dividends reinvested. If we started our 3 percent signal plan with only $3,719 in SPY we would have ended at $36,155, with $29,508 in SPY and $6,647 in VFIIX. That’s 133 percent better than buying and holding SPY—with less exposure to stock risk. We’ll look more closely at risk-adjusted performance in the next chapter.
Cash Shortages
You may be concerned about cash shortages that crop up now and then when you have most of your capital in stocks and the market tanks. These shortages give Peter Perfect another opportunity to try tempting you back into the follies of forecasting, so let’s pause to address them.
Before we do, remember that our plan puts its safe side into bonds. When the bond fund runs out of funds, I’m calling it a “cash shortage” even though it’s technically a “bond fund shortage.” Everybody knows that a cash shortage means we need more cash, and indeed that’s the case here, too. When the bond fund runs dry, we need to add more cash.
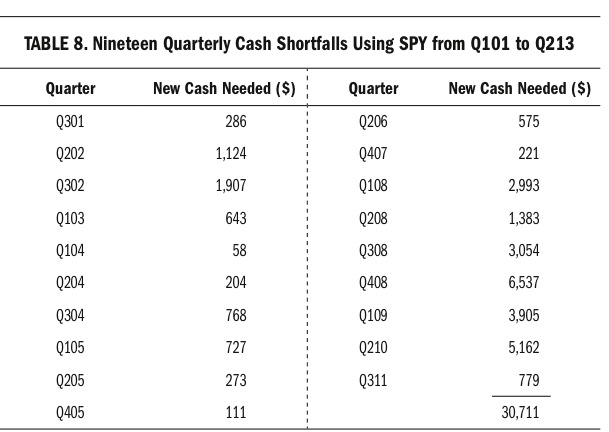
We ran into nineteen quarterly cash shortages when the buy signal called for more new shares than our bond fund could afford. One of the quarters required less than $100, five required between $100 and $300, and five required between $500 and $800. These eleven delivered modest demands. The other eight required more than $1,000. The biggest shortfall happened in the heart of the subprime mortgage collapse, when the three quarters from Q308 to Q109 required respective new cash deposits of $3,054, $6,537, and $3,905. Using a technique you’ll learn later, called “30 down, stick around” (in which you stay fully invested in stocks after a big crash), caused another large shortfall, in Q210, when the market hit its first dip in the recovery. Had the plan been selling on the way up, it would have generated enough cash to cover the drop. Since it was fully invested in stocks, however, the bond fund was empty and needed new cash for buying. This was actually a profitable situation because staying fully invested on the way up grew the stock account enormously. All nineteen shortfall quarters added up to $30,711 in new cash needed over the course of these 12.5 years. These were the nineteen shortfall quarters, rounded but with a correct total sum:
Visit (http://bit.ly/1Cvis7z) for a larger version of this table.
Such shortfalls occasionally happen when we are dealing with the stock market because we can’t know what it’s going to do. If we knew enough to achieve a perfect balance of bonds to stocks, we’d know enough to time the market in the first place and wouldn’t need this plan. Nobody can do that, which means we’re occasionally going to have to manage cash shortages. As long as you can fund them, they’re great opportunities.
This time period was extremely volatile and included two of the biggest stock market crashes ever. Almost nobody saw them coming, and even fewer were well positioned ahead of them. Five of the nineteen quarters requiring new money happened in a row during the subprime mortgage crash, from the first quarter of 2008 to the first quarter of 2009. The last big one, Q210, was also related to the subprime crash because the plan stayed in stocks for the recovery. It’s impressive that this plan correctly signaled investors to buy the steep sell-off rather than selling, as many z-vals advised. The recovery that ensued made all those brave buys during the crisis pay off.
Another point is that $30,711 doesn’t seem like such a large figure when you realize it came to an average of $204.74 per month during the 12.5-year stretch. People interested enough in their finances to read a book like this are people who save money, which makes me think this additional cash demand would not have been impossible to meet. Regular cash contributions to a plan, such as those into a retirement account, greatly reduce the number of shortfall quarters, but even they can’t guarantee eliminating them completely. You’ll see this unfold in a detailed example in Chapter 7.
For an apples-to-apples comparison, look at the following excerpt, taken from Table 6 on page 68. Notice how 3Sig’s average new cash needed per month of $204.74 stacks up against the same $204.74 per month invested in SPY at the end of every quarter regardless of price, a dollar-cost averaging plan. Three months of $204.74 monthly savings turns into $614.22 going into SPY at the end of each quarter. We’ll start the plans with the same $10,000 balance, and we’ll allocate our 3Sig portfolio into the same 80/20 mixture of stocks to bonds at the start, and both plans will end up using the same $30,711 in new cash. Here’s the result, with all dividends reinvested:

Visit (http://bit.ly/1CKDVHe) for a larger version of this table.
At the end of the 12.5-year period, with each approach starting at the same $10,000 balance and investing the same amount of new cash, buying $614.22 worth of SPY each quarter produced an ending balance of $63,667 while our 3Sig plan produced an ending balance of $71,152 with less risk. Our signal achieved an 11.8 percent improvement even though it finished the period with $10,193 in bonds—14 percent of our capital.
It’s possible that your bond fund will drop to zero and that you’ll have no extra cash available in your life when 3Sig tells you to buy more stock. In such cases, you can at least understand from the plan’s advice that you should not sell into the falling market. This, too, is valuable. When headlines and stories panic people, it’s tempting to get out entirely at just the wrong moment. A cool-headed look at what the signal is saying should provide you with confidence to stay put, because you’ll come to trust it after many quarters of sound advice. You’ll know you should be buying, but you can’t, so you’ll do the next best thing, which is holding the shares you already own for their eventual recovery. After they recover, you’ll resume selling excess profits and rebuilding your bond fund balance with the proceeds. Running out of cash doesn’t end the plan; it just pauses it.
Even this worst-case scenario—which isn’t terrible—is almost always avoidable with a cash management technique we’ll look at later.
Because we’re investing in the stock market, where anything can happen, it’s impossible to construct a plan that functions perfectly in any environment. We can’t predict how high or low prices will go, so we have to come up with a plan that navigates the fluctuation in a way that outperforms the market in almost all time frames. The 3 percent signal is such a plan, but it can issue a buy signal big enough to exceed your bond fund reserves. Such moments usually mean that a very good opportunity is at hand, so we’ll strive to keep you ready for this.
In rare cases when you’re not ready, you’ll shrug and stand by until your stock balance recovers and you can pick up where you left off. No big deal.
Executive Summary of This Chapter
The performance goal with 3Sig is 3 percent per quarter. It rebalances back to this signal line when you either sell a stock profit surplus down to it or buy a shortfall up to it. Key takeaways:
 We will use proceeds from a safe bond fund to buy more of our stock fund when the market fails to deliver 3 percent in a quarter, and replenish the bond fund by selling excess profit from the stock fund when the market delivers more than 3 percent in a quarter.
- Our quarterly schedule is just right. It maximizes profits while minimizing activity. Frequencies higher than quarterly ones increase activity without increasing performance.
- The 3Sig plan with SPY handily outperformed powerful alternatives, including dollar-cost averaging and buying and holding.
- Beware the myth of buy-and-hold. It exists only in theory. Everybody believes in buy-and-hold when times are good, but almost nobody does when times are bad.
- The 3Sig plan guides us through this tendency. It tells us when the market’s good days have added up to a level where profits should be harvested, and when its bad days have compounded down to a level where new money should be invested.
- Keeping part of the plan in safe bonds also helps to weather stock storms.
- It’s possible for our plan to run out of buying power. In such times, buy signals tell us to stay put for recovery, which is helpful. However, such moments have been historically rare, suggesting that gradually built savings can help you take advantage of these exceptional buying opportunities.