
Globalization and Extreme Wealth
Martua Sitorus of Indonesia made his fortune in agribusiness. The company he cofounded, Wilmar International, is the world’s largest producer of palm oil. It has 450 manufacturing plants in 15 countries and a multinational workforce of about 90,000 people. Eighty percent of the company’s revenues come from countries outside Southeast Asia. Eggon João da Silva of Brazil made his fortune in manufacturing. He cofounded WEG, the largest producer of electric motors in Latin America, in 1961. WEG employs more than 27,000 people worldwide and manufactures 11.5 million motors a year. Half of its revenues come from outside Brazil. Global markets are also important for He Xiangjian of China. His fortune stems from the appliance producer Midea, which earns about half of its revenues from exports.
This chapter presents anecdotal evidence that expanding through trade has allowed emerging-market companies to grow faster and larger, enriching their owners. It goes on to examine the relationship between a company’s reliance on international markets and the owner’s wealth—and also between the amount of extreme wealth in a country and its external linkages. Companies that have a greater share of revenue from outside the home country have richer owners, and countries more open to trade have more billionaires. The chapter discusses the importance of foreign markets, imported inputs, and global supply chains in the creation of extreme wealth in emerging markets. As tariffs and trade costs have fallen and technology has improved, it has become easier to create global factories, which produce internationally and serve customers around the world. The promise of large markets and the efficiency gains from global supply chains have become the blueprint for many large emerging-market multinationals.
Extreme Wealth and Extreme Talent
Theory suggests that when countries integrate through trade, goods prices equalize across countries, which in turn affects wages and the returns to capital. For example, if T-shirt prices in the United States and China are equalized when the two countries trade, then the wages of apparel workers should also converge. More broadly, if goods that use unskilled labor intensively in production (such as light manufactures) are imported at a relatively low price, the demand for unskilled workers falls, putting downward pressure on their wages. Looking for evidence of this so-called Stolper-Samuelson effect (named after the economists who discovered it) has been a major endeavor of trade economists.1 Empirical studies, however, find that trade plays at most a supporting role in exacerbating income inequality in advanced countries, with technological change being a far more important determinant (see, for example, Edwards and Lawrence 2013). Unlike trade, technological advance directly displaces unskilled labor, as routine tasks can be more easily mechanized, reducing the demand for these workers (consider, for example, the elevator operator or the telephone switchboard worker).
The Stolper-Samuelson effect—the bedrock of the trade and wage literature—does not make predictions about extreme wealth. Models that tie globalization to extreme incomes and wealth rely on gradations among workers and the existence of a small number of extraordinarily talented individuals. According to Jonathan Haskel et al. (2012), these people will command extraordinary pay because they are unusually efficient with capital. Technology plays the role of magnifying the importance of talent differences because the best producer can serve more consumers. For example, new massive open online courses (MOOCs) imply that all students of a subject can learn from the most esteemed professors. Some worry that this could lead to a decline in the demand for instructors at all but the top-ranked universities. Globalization magnifies the return to talent because it increases the potential consumer base for tradable goods. In the example of a MOOC, which new technology makes possible, openness to trade means that MOOCs attract students and professors from all over the world, not just a single country. Together technology and globalization boost the wages of a small group of highly talented individuals. The key distinction among models that allow for different worker types is that the standard forces of trade that determine the relative wages of skilled workers are muted compared with the effect on a small group of exceptionally talented individuals.
Examples of the Role of Globalization in Wealth Creation
Dilip Shanghvi borrowed 10,000 rupees (about $1,000 in the 1980s) from his father to start a drug company, Sun Pharmaceutical Industries. Shanghvi chose to focus on medications for chronic diseases because the market was very thin in India, with few suppliers, especially of products designed to treat mental illnesses; other companies were focusing on medications to treat acute illnesses. In addition, chronic illnesses meant that demand would be strong and relatively constant.
Sales of Sun Pharma’s first product (lithium, used to treat bipolar disorder) began in 1987; exports followed soon after in 1989 but remained limited in the 1990s. One problem was that exporting alone was not the best way to reach the more lucrative international market, especially the US market, where drug prices were much higher but safety and health regulations were more stringent. So in 1997 Shanghvi bought Detroit-based Caraco Pharma, a distressed generics maker that was approved by the US Food and Drug Administration for manufacturing but had no new drug approvals. The purchase allowed Sun to transfer drug technology to Caraco and get a much larger foothold in the US market. The acquisition is striking since one normally thinks of advanced countries, like the United States, exporting technology to subsidiaries in India to produce at a lower price. Shanghvi’s strategy was precisely the reverse, exporting Indian technology and producing in the United States to facilitate adherence with cumbersome US regulations. Since turning Caraco into a highly profitable subsidiary, Sun Pharma has completed 11 more such game-changing deals, including six in the United States, one in Israel, and one in Hungary.2 Sun Pharma now focuses on complex generics, which means it innovates to improve existing drugs (such as by improving the delivery mechanism). This type of innovation has allowed Sun Pharma’s products to take market share from name-brand drugs and other generics and expand their international reach.
Figure 6.1 International revenue of Sun Pharmaceutical and the wealth of its founder, 2006–14

Sources: Data from Forbes, The World’s Billionaires; and Revenue by Geography for Sun Pharmaceutical, 2006–2014Q2, Bloomberg (accessed on October 23, 2014).
Shanghvi’s wealth soared when his firm expanded globally (figure 6.1), with 75 percent of its 2014 revenue coming from international sales. Today Sun Pharma is the largest drug company in India, employing 16,000 people. In 2014 the company was worth $27 billion, making Shanghvi (worth $12.8 billion) the second-richest man in India.
Luis Matte was a civil engineer involved in the import business in Chile. In 1918 he started a paper company and in 1920 that company merged with German Ebbinghaus to create Compañía Manufacturera de Papeles y Cartones (CMPC). CMPC continued to grow and by 1942 it was supplying Chile with nearly all of its printing and packaging paper. In the 1970s, under the socialist regime of Salvador Allende, the company was the only paper company to escape state control, enabling the opposition newspaper to remain in print.3 In the 1990s the company moved into Argentina, Peru, and Uruguay. A decade later it expanded to Mexico, Brazil, Ecuador, and Colombia. In this period, the company was at the forefront of technological developments, in terms of both materials produced and reforestation techniques, while investing 70 percent of profits into growth. The share of revenue from outside Chile rose continually and in 2008 increased from less than half to more than 70 percent. The rise in the company’s exports corresponded with the growth in the wealth of its owner, Eliodoro Matte, and his family, who own 55 percent of the company (figure 6.2).
Figure 6.2 International revenue of CMPC and the wealth of its founder and his family, 2007–13

Sources: Data from Forbes, The World’s Billionaires; and Revenue by Geography for CMPC, 2006–2013, Bloomberg (accessed on October 23, 2014).
Production has also become global. Natura Cosmeticos, the innovative Brazilian cosmetics firm of Antonio Luiz Seabra (discussed in chapter 3), which has been labeled a benefit corporation because of its environmentally sustainable business plan, expanded production into Argentina, Colombia, and Mexico beginning in 2010. The share of exports in its revenues doubled between 2010 and 2013. The company earns 19 percent of revenue abroad and has 400,000 of its 1.7 million consultants (like Avon ladies) outside Brazil.
Trade is increasingly important for all growing companies, not just emerging-market ones. The Swedish retailer H&M, for example, earns only about 5 percent of its revenues in Sweden. Its owners, Stefan and Liselott Persson, depend on external markets for their wealth.
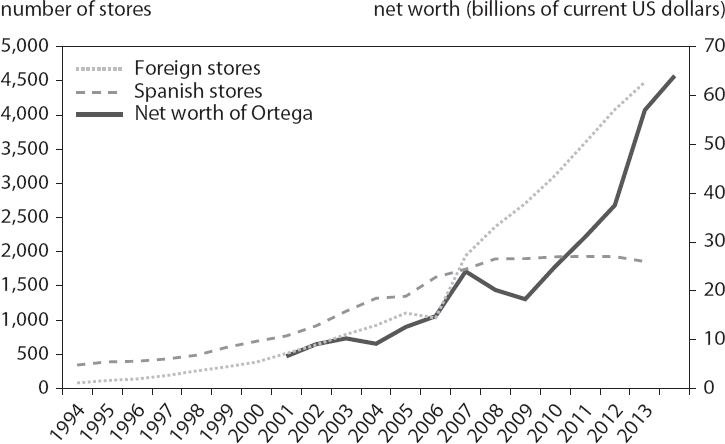
Even billionaires in larger countries are going global. Amancio Ortega was the third-richest person in the world in 2014. The Spaniard first appeared on the Forbes World’s Billionaires List in 2001, when his company, Inditex, was listed. Since then his wealth has increased by a factor of 10, reaching $64 billion in 2014. His success is typically attributed to the affordable fashionable style associated with his Zara brand and the vertical integration of his company, which extends from design to production to logistics and retail. But it was developments in trade and technology that made this model possible.
Figure 6.3 Inditex’s domestic and international stores and the wealth of its founder, 1994–2013
Sources: Inditex annual reports and Forbes, The World’s Billionaires.
The combination of a complete shift in trade policy on apparel and improved technology that promoted supply chain development is evident in Zara’s rise. Average most-favored nation (MFN) clothing tariffs fell from 18 to 10 percent in advanced countries between 1988 and 2011. Nontariff barriers were also removed. The loosening and the 2004 expiration of the Multifiber Agreement (which had placed strict limits on the quantities of clothing produced in developing countries that could be sold in developed countries) made it increasingly possible to produce at low costs in countries like Morocco and Turkey and sell unlimited quantities in countries like Japan and the United States. Zara’s business model relies on maintaining and using information in real time, adjusting production to demand, and shipping goods to more than 6,000 stores worldwide. Technological developments and improved trade facilitation allowed the company to do so.
Figure 6.3 shows Ortega’s net wealth and the global and local expansion of his brand. His wealth closely tracks Inditex’s global expansion, not its presence in Spain. Had Ortega relied solely on Spanish sales, he would have become very rich. But it was conquering the much larger world market that made him the third-richest person in the world.
While the global market is especially important for emerging markets and small countries, where domestic demand is unlikely to allow the most productive firms to reach their full potential, it is also important for large-country firms, which are increasing their foreign presence to grow. In 1994 Microsoft earned three-quarters of its revenue in the United States; in 2013 the United States accounted for just half of the company’s earnings, indicating that global sales grew much more rapidly than domestic sales. In 1994 less than 1 percent of Walmart stores were outside the United States; by 2014 the figure had risen to 60 percent.
Table 6.1 Billionaires connected to major Apple suppliers, 2014
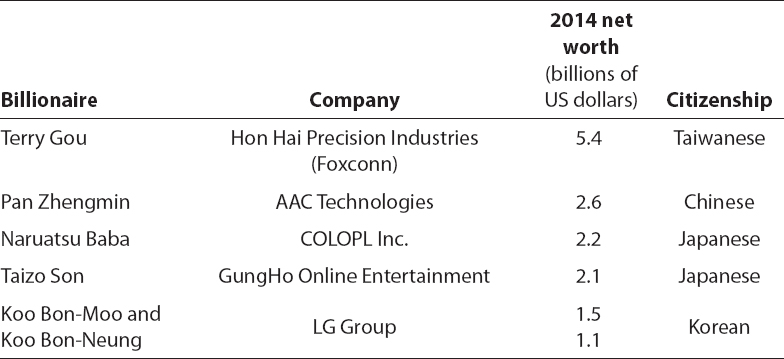
Note: Major suppliers include companies in which 30 to 60 percent of revenue came from sales to Apple in the first three quarters of 2014.
Source: Apple Supply Chain Analysis, percent of revenue, 2014Q1–Q3, Bloomberg (accessed on October 23, 2014).
Trickle-Down Wealth
Because of the integration of production, extreme wealth often spreads from its source in advanced countries to other (mostly emerging) markets along the supply chain. Consider the case of Apple. Forty percent of the company’s stores were outside the United States in 2013, but revenue is not the only side of Apple’s balance sheet that is globalized. Apple’s supply chain extends around the world. The most competitive of Apple’s suppliers have become large multinational companies, and their founders have become extremely wealthy. In 2014 Taiwan-based firms controlled about 60 percent of the value associated with the relationship between Apple and its suppliers, with US suppliers representing only 15 percent. Apple also sources from suppliers in Europe, South Africa, and Peru (map 6.1).
Apple is connected to 60 billionaires worldwide. For most of them, revenue from sales to Apple represents less than 5 percent of their revenue in 2014. For six billionaires (connected to five companies), at least 30 percent of revenue comes from sales to Apple. The two richest of these billionaires are from emerging-market companies (table 6.1).4
Map 6.1 Apple suppliers by home country, 2014

Note: Map shows percent of total supplier relationship value in all countries that host Apple suppliers, based on Bloomberg’s assessment of the dollar amount involved in the relationship between suppliers headquartered in each country and Apple. Europe-based suppliers as a whole represent 3.86 percent of total supplier value.
Source: Apple Supply Chain Analysis, relationship value, 2014Q1–Q3, Bloomberg (accessed October 23, 2014).
Table 6.2 Globalization of largest nonfinancial companies as measured by share of international revenue, by region, 2013
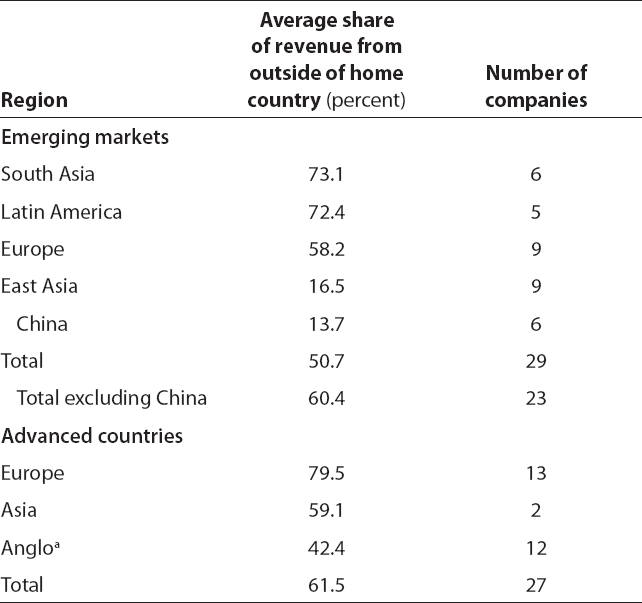
a. Anglo countries are the United States, Canada, Australia, and New Zealand.
Note: Sub-Saharan Africa, which had just one company, is not included.
Source: Revenue by Geography 2013, Bloomberg (accessed on October 23, 2014).
Company Exports, Country Trade, and Wealth
How important are global markets for the largest multinational companies that generate extreme wealth? Bloomberg provides financial data on publicly traded companies around the world, and combining these data with the 2014 Forbes World’s Billionaires List allows identification of the companies associated with the 50 richest (nonfinancial) billionaires in emerging markets and the companies associated with the 50 richest (nonfinancial) billionaires in advanced countries. Geographically segmented revenue data are available for companies in 33 emerging markets and 27 advanced countries for 2004–14 (though not all companies had data every year), which allows the identification of the share of revenues from international sales.5 As most company data are in local currencies, international revenue as a share of total revenue was used to make data comparable across countries.
On average large companies are very international, with more than half their revenue coming from exports (table 6.2). Companies in advanced countries tend to derive a larger share of their revenues from exports (62 percent) than companies in emerging markets (51 percent). Regionally, the most globalized firms are in Latin America, South Asia, and developed Europe; companies in developing East Asia are the least global.
Figure 6.4 Correlation between exports as share of company’s revenue and billionaire owner’s real net worth, 2004–14

Note: The vertical axis shows net worth that is not explained by country size (residuals from a regression of individual net worth on home country GDP) and the horizontal axis shows the international revenue share of the company that is not explained by country size (residuals from a regression of international share on home country GDP). Years vary by company.
Sources: Revenue by Geography 2013, Bloomberg (accessed October 23, 2014); and Forbes, The World’s Billionaires.
It is not surprising that a large share of European firms’ revenue is foreign, given the relatively small domestic markets in European countries and the close integration of countries within Europe (trading with another European country counts as global). In contrast, Chinese firms serve a large domestic market. Unlike Google and Facebook, both of which earn more than half of their total revenue outside the United States, Chinese technology companies such as Tencent, Baidu, and Alibaba rely almost exclusively on domestic consumers, with average shares of foreign revenue in 2013 of 7.3, 0.2, and 12.1 percent, respectively. Other East Asian countries look much more like Korea and Japan, where mega firms earn about 60 percent of revenue abroad.
By definition global companies have a larger market than domestic ones, allowing owners to expand wealth. Figure 6.4 shows the relationship between the combined net worth of individuals associated with a company and the international sales share of the company, controlling for country size. It shows that international sales are positively correlated with net worth. Controlling for country size, individuals who expand their companies abroad tend to be richer than those who focus on the domestic market, with a 1 percentage point increase in the international share associated with about a 0.8 percent increase in wealth. This effect is greater than the effect of domestic income (a 1 percent increase in GDP corresponds to only a 0.3 percent increase in wealth).
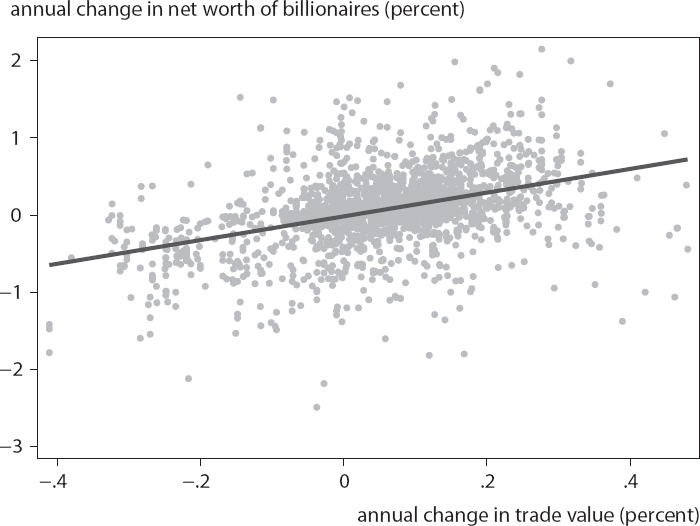
Figure 6.5 Correlation between changes in billionaire wealth and changes in international trade in the billionaire’s country, 1996–2014
Sources: Data from World Bank, World Development Indicators; and Forbes, The World’s Billionaires.
Given the importance of international markets and imported inputs, countries in which trade is growing faster are likely to be the ones where fortunes are soaring. Even companies that serve domestic markets benefit from trade, because it allows them to use imported inputs.
Figure 6.5 plots the annual growth in billionaire wealth against the annual growth in trade in the billionaire’s country. The fitted line shows the strong positive correlation between the two variables.
Trade is also correlated with income growth; trade and net worth could therefore be strongly correlated because both trade and net worth increase when income grows. To explore the role of trade as opposed to broader income growth, the correlation between wealth and trade can be evaluated, controlling for standard determinants of wealth. In particular, income, as well as fixed effects for country and industry-year, are included in a regression of net worth on trade.6 Country fixed effects pick up country characteristics that do not vary with time. For example, the United States may have more billionaires than Brazil because it is larger and is at a higher level of development—or because Forbes is located in the United States and journalists do a better job of tracking wealth there. Industry-year fixed effects pick up changes over time that drive global wealth at the sector level, such as the effect of rising commodity prices on resources.
Figure 6.6 Relationship between trade, GDP, and billionaire wealth in advanced countries and emerging economies, 1996–2013
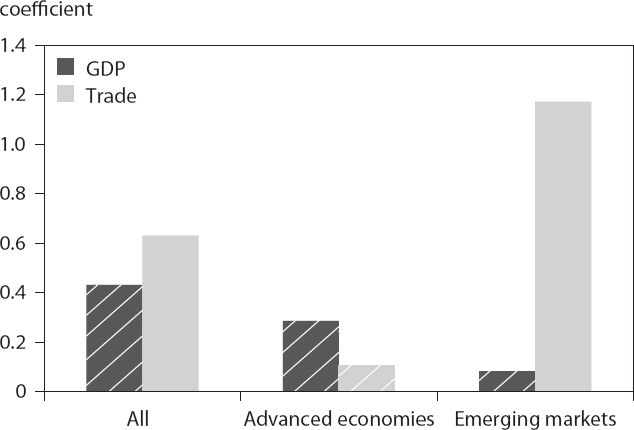
Note: Bars represent coefficients on GDP and trade from a regression of ln(net worth) on ln(income), ln(trade), and country and industry-year fixed effects. Solid bars indicate significance at the 10 percent level.
Source: Author’s calculations.
The net worth data are at the country-industry level. The five industries are resources, traded goods, nontraded goods, new sectors, and finance.
Figure 6.6 presents the results. It shows that wealth is positively and significantly associated with trade in the full sample. Although positive, the effect is not statistically significant in the North. The correlation between trade and wealth is much stronger in the South.
The results indicate that increased trade is closely related to the increase in wealth in emerging markets. The coefficient is just over 1, meaning that a 1 percent increase in a country’s trade is associated with about a 1 percent increase in the net worth of billionaires, after controlling for income growth in the country and country-specific and industry-specific effects. This result is similar to the relationship found using company data. Trade in emerging markets grew on average 7.4 percent a year over the period. Using the estimated coefficient of 1 on the log of trade implies that growth in real trade contributed to an annual increase in billionaire wealth of 7.4 percent. The average annual increase in real wealth in emerging markets was 10.7 percent, suggesting that 70 percent of the increase in the wealth of billionaires was related to trade growth.
The statistically insignificant effects of both trade and income in the advanced countries are at first perplexing. But separating the regressions by sector explains why trade and GDP are less important in the North than in the South. Wealth associated with finance exhibits a strong negative correlation with trade in the North. Excluding finance, the coefficient on trade (0.60) is positive and significant. This result suggests that the rise of extreme wealth in the North is more closely related to developments in the domestic financial sector than to globalization, an issue addressed in chapter 10.
Takeaways
Trade explains much of the rise of extreme wealth in emerging markets. Although the share of foreign revenues is higher in advanced-country mega firms, the rate of increase of international revenues is faster among emerging-market firms, as they are rapidly expanding their foreign presence, and thus trade is a bigger contributor to recent wealth creation in emerging markets. Increases in the home country’s trade can explain about 70 percent of the rise in extreme wealth in the South. The extraordinary rise in the wealth of emerging-market billionaires is to a large extent the result of having a wider selection of resources to use in production and a large market to sell to.
Table 6A.1 List of companies in emerging-market and advanced economies with the richest billionaire owners, by nonfinancial sector, 2014

Note: These companies are associated with the 50 richest individuals in nonfinancial sectors in both emerging markets and advanced economies in 2014 and represent the companies for which geographically segmented company revenue data are available.
Source: Revenue by Geography 2004–14, Bloomberg (accessed on October 23, 2014).
1. The Stolper-Samuelson theorem states that under certain conditions a rise in the relative price of a good will lead to a rise in the return to the factor that is used most intensively in the production of the good.
2. Forbes India, “Sun Pharma’s Dilip Shanghvi has become the stuff of legend,” October 17, 2014.
3. Funding Universe, “Empresas CMPC S.A. History,” www.fundinguniverse.com/company-histories/empresas-cmpc-s-a-history/.
4. Zhou Qunfei, of Lens Technology, in China, was added to the list in 2015.
5. Appendix table 6A.1 lists the companies in the sample.
6. The dependent variable is aggregate annual country-industry net worth from 1996 to 2013, the most recent year for which World Development Indicators data are available. The independent variables are income, country fixed effects, industry fixed effects, and year fixed effects. Trade, income, and net worth are in real terms and in logs. Errors are clustered at the country level.