
Your running is only as good as the fuel that powers it. Building a great running body and then providing it with inadequate energy is like having a Hennessey Venom GT (260 mph top speed, 0–60 mph in 2.5 seconds) and a full tank of lemonade. Building your energy system begins with the food you eat—with the carbs, fats, protein, and other nutrition that you choose to consume every day—and ends with your body’s creation of ATP, the molecule that powers every movement you make, from the slightest twitch to the longest leap. Your favorite part about training your energy system will be picking healthy foods from the menu. But the most important part is teaching your body to turn bananas and pasta into faster, fitter running performances.
Your body needs energy to run, just like kitchen appliances need electricity, a TV remote control needs batteries, and your car needs gasoline in the tank. Unlike electricity, batteries, or gasoline, however, the energy you need, as a runner, doesn’t arrive ready to burn. You have to make it yourself—and that’s the job of your energy system.
Human motion is powered by energy from the molecule ATP (adenosine triphosphate). You eat to harness food’s energy (calories), but food doesn’t directly provide energy for your running. Instead, your energy system breaks down carbohydrates, fats, and protein, and then uses that energy to create ATP. It’s ATP that provides the energy you need to run.
In the grand scheme of things, you have one running energy system—the system that produces ATP—but it’s easier to understand that energy system’s function if we break it down into three systems, two that are anaerobic and one that’s aerobic. Your two anaerobic systems don’t require oxygen to produce energy and are limited in duration. Your aerobic system requires oxygen to function and can produce energy for the long haul. The three systems are:
These three systems work together to ensure that you always have adequate ATP. In fact, they create fuels, enzymes, and other products that can be used by one another (e.g., your glycolytic system creates lactate, which is used by your aerobic system to make ATP). In other words, these systems are codependent. Keeping that in mind, here are four energy system principles:
In addition to describing the three energy systems, we’ll discuss two other energy-related topics in this chapter: aerobic enzymes and body heat. Aerobic enzymes are an essential element in mitochondrial energy production, and body heat is created as a by-product of ATP production and use.
You train your energy systems by performing workouts that challenge the fuels (known as substrate), enzymes, buffers, and processes (e.g., the lactate shuttle) associated with each system. Because the workouts recommended in this chapter have already been demonstrated in the photo instruction for previous chapters, we’ll use this chapter’s photo instruction a little differently. To aid your fueling decisions, we’ll break down a variety of workouts into their caloric requirements, as well as noting approximate contributions from carbohydrates and fats.
You have three energy systems that are working twenty-four hours a day to provide you with the ATP you need. Of course, they’re not working at full capacity twenty-four hours a day. And they’re not making equal contributions to energy production for all activities. Your energy systems specialize, with each system best-suited for a different type of energy demand. Table 10.1 approximates the contributions from energy systems at different effort levels (represented by paces). Sprints are almost entirely anaerobic, with around 50 percent of energy contributed by the phosphagen system alone, while the marathon goes the opposite direction, deriving 99 percent of energy from your aerobic system. We’ll look at each of your energy systems to see exactly how they work (and how best to train them), beginning with a brief overview of ATP itself.
Table 10.1 Aerobic/Anaerobic Energy Contribution
|
Run/Race Distance |
Aerobic |
Glycolytic (Anaerobic) |
Phosphagen (Anaerobic) |
Total Anaerobic |
|---|---|---|---|---|
|
100m |
20.0% |
33.3% |
46.7% |
80.0% |
|
200m |
28.0% |
51.3% |
20.7% |
72.0% |
|
400m |
41.0% |
49.6% |
9.4% |
59.0% |
|
800m |
60.0% |
35.9% |
4.1% |
40.0% |
|
1500m |
77.0% |
21.0% |
2.0% |
23.0% |
|
3K |
86.0% |
13.0% |
1.0% |
14.0% |
|
5K |
92.0% |
7.5% |
0.5% |
8.0% |
|
10K |
96.0% |
3.7% |
0.3% |
4.0% |
|
Half Marathon |
98.0% |
1.9% |
0.1% |
2.0% |
|
Fast Tempo |
98.5% |
1.4% |
0.1% |
1.5% |
|
Slow Tempo |
99.0% |
1.0% |
0.1% |
1.0% |
|
Marathon |
99.5% |
0.4% |
0.1% |
0.5% |
|
Long Runs |
99.7% |
0.3% |
0.0% |
0.3% |
|
Regular Distance Runs |
99.8% |
0.2% |
0.0% |
0.2% |
|
Recovery Runs |
99.9% |
0.1% |
0.0% |
0.1% |
TABLE 10.1 shows approximate contributions from all three energy systems—aerobic, glycolytic, and phosphagen—during various running efforts.
ATP has been called the “common currency” of energy. Whether you’re sprinting, running distance, or just staring out the window thinking about going for a run, ATP is providing the energy that lets you do it. If muscle contractions were slot machines, ATP would be your coins.
You begin each day with about one hundred grams (roughly a quarter-pound) of ATP in your body and then recycle it as needed. But be forewarned: Those one hundred grams won’t power more than a few minutes on the couch or a few seconds on the run. Just to meet daily energy demands, you’ll recycle each ATP molecule approximately 500–750 times—a volume of ATP equal to your body weight! High-volume training increases demand up to 100 percent. (See sidebar, “How much ATP does it take to run a marathon?”)
You always have a small supply of available ATP in your muscle fibers. If you didn’t, you’d experience rigor mortis (muscles use ATP to contract and relax). But with your first running step, you start depleting that ATP. To continue running, you’ll need to fire up the phosphagen system.
The phosphagen system is your first responder when muscle fiber ATP levels fall. Also called the ATP-CP system, it resides in your muscle fibers’ sarcoplasm, relies upon creatine phosphate (CP or PCr) as its fuel source, and is anaerobic. Whether you’re blasting out of the blocks in the Olympic 100-meter final or taking the first steps of a distance run, ATP levels will nosedive within seconds unless the phosphagen system comes to the rescue. And come to the rescue it does, in mere thousandths of a second, using CP to rapidly recycle ATP at twice the rate of your next-fastest energy system.
Your phosphagen system immediately arrests the fall in ATP levels until reinforcements arrive. For low-intensity exercise, your other energy systems will quickly take over ATP production. For high-intensity exercise like all-out sprints, which demand the kind of energy supply that only creatine phosphate can fuel, your phosphagen system will remain in the driver’s seat, keeping your ATP levels at 80 percent of normal volume for up to ten seconds. Then, just as the nitro boost that rocketed Dominic Toretto’s RX-7 to victory in The Fast and the Furious was short-lived, CP depletes rapidly. By fifteen to twenty seconds, it’s mostly gone. That’s enough energy for sprints, heavy lifts, plyometrics, or jumping a puddle, but not enough for a jog around the block—meaning you’ll have to reduce your effort if you intend to keep running.
Whereas the phosphagen system produces energy anaerobically, rebuilding your CP stores requires oxygen. That’s one reason you huff and puff after a sprint or heavy lift. It takes up to three minutes to restock your CP, so plan recovery from high-intensity activities accordingly.
Like the phosphagen system, the glycolytic system resides in the sarcoplasm, is anaerobic, and ramps up as soon as you start exercising. During high-intensity exercise, the glycolytic system takes over as your primary energy source once the phosphagen system has run dry. It’s also the perfect example of your individual energy systems working as branches of one big energy system. The centerpiece of the glycolytic system is a multi-step chemical reaction called glycolysis, which is the first step in both anaerobic and aerobic energy production.
Fueled by glucose and glycogen (carbohydrates), glycolysis quickly produces two or three ATP molecules anaerobically plus two very important molecules called pyruvate. If your muscle fibers’ energy demand exceeds what can be produced aerobically, the pyruvate molecules will be cycled through “fast” glycolysis. If enough oxygen is available for aerobic energy production, most pyruvate molecules are shuttled to your mitochondria (if they aren’t already at 100 percent capacity) through “slow” glycolysis.
Fast glycolysis is what most runners think of when they hear the term “anaerobic.” Fast glycolysis can produce ATP up to one hundred times faster than your aerobic system. The drawback is that this production is short-lived. You’ll get one minute max of full-capacity production, two minutes with a more conservative effort, and a longer-lasting dribble of energy if you throttle way back. Sprinters and middle-distance runners lean hard on this system (see Table 10.1).
Fast glycolysis begins with the pyruvate molecules created during glycolysis. The pyruvate enters a chemical reaction that produces lactate and the coenzyme NAD+. NAD+ is important because it allows glycolysis to cycle again immediately, producing another two to three ATP and two more pyruvate, which initiates yet another cycle, and another, going round and round at breakneck speed, until you’ve created an enormous volume of ATP.
Fast glycolysis occurs under three different conditions:
Training fast glycolysis requires speed work—repetitions of 200 to 400 meters at mile race pace or faster. Speed work increases anaerobic enzymes, and anaerobic enzymes break down the carbohydrates that fuel glycolysis. More anaerobic enzymes means faster energy production. But be forewarned that a byproduct of speed work is acidosis. And acidosis can damage or even destroy aerobic enzymes (we’ll discuss these in a minute). For this reason, endurance athletes need to limit speed work by practicing these three rules:
Fast glycolysis will cycle in and out as needed during runs, and it’s a major contributor when kicking to the finish line of a race.
A final note on fast glycolysis: If you do find yourself going out too fast in a run, race, or repetitions workout—and feel the unavoidable onset of acidosis—slow down to an easily held aerobic pace. Trained muscles are efficient at clearing both lactate and hydrogen ions, and while you won’t be able to reverse the effects of acidosis completely, you’ll recover enough to finish more strongly than if you hadn’t backed off.
Slow glycolysis represents the other pathway for those two pyruvate molecules. Once adequate oxygen reaches your muscle fibers—and as long as your mitochondria aren’t already producing energy at full capacity—most pyruvate will be shuttled to your mitochondria, there to be used as fuel for producing ATP aerobically.
Aerobic energy production requires oxygen and takes place in your mitochondria. It produces the greatest volume of energy—by far—but takes time to get up to speed. While some oxygen is always present in your muscles, your cardiovascular system requires twenty-five to thirty seconds, and up to forty seconds for untrained runners, to deliver the volume of O2 necessary for most running. Until then, unless you’re running extremely easy, your anaerobic systems dominate energy production.
Once ample oxygen is available, your mitochondria shift into high gear. Utilizing two processes—the Krebs cycle and the electron transport chain (ETC)—your mitochondria will generate thirty-six ATP molecules from those original two pyruvate molecules, thirty-eight to thirty-nine if you include the ATP from glycolysis. Up to six of those ATP molecules are used by the mitochondria, leaving around thirty-two for your muscle fibers. As for oxygen, it waits at the end of the electron transport chain, ready to combine with electrons and protons to form water, a by-product of aerobic energy production.
Another well-known by-product of the aerobic system is carbon dioxide (CO2). The rising CO2 level in your bloodstream is the main reason your breathing rate increases during exercise (oxygen levels and acidosis play lesser roles). And offloading excess CO2 is a big reason why you continue to breathe hard at the conclusion of a taxing run.
Fatigue during aerobic exercise can result from carbohydrate depletion, nervous system fatigue, electrolyte impairment, and free radical accumulation.
When runners think of carbohydrate fuels for their muscle fibers, they tend to think of glucose and glycogen. They don’t think of lactate. But they should, because lactate is an excellent carbohydrate source. In slow-twitch fibers, during exercise, your mitochondria use up to 80 percent of lactate produced by fast glycolysis to create aerobic energy—netting approximately fifteen ATP molecules per lactate molecule. Are you wondering how one glucose molecule could net thirty-two ATP molecules through slow glycolysis but only two through fast glycolysis? Now you know: It doesn’t. It’s just that the remaining energy in fast glycolysis gets temporarily stored as lactate. Again, this is a striking example of how your anaerobic system is linked to your aerobic system: Fast glycolysis simultaneously pumps out high-yield anaerobic energy while creating a fuel (lactate) for aerobic energy.
But lactate’s role as a fuel source doesn’t end there. Your muscle fibers can also export lactate to be used as fuel elsewhere. Exported lactate is not only the primary fuel source for your heart (cardiac muscle) during exercise, it’s also a major fuel source for carbohydrate-depleted working muscles. Let’s say you’re running a demanding session of 5K pace repetitions. As the session continues, you deplete the muscle glycogen stores in your working slow-twitch fibers. Not to worry. In a properly trained runner, lactate from non-working muscle fibers can come to the rescue. A 1998 study by Rauch, Hawley, Noakes, and Dennis found that lactate can diffuse from adjacent inactive muscle fibers to provide an energy boost in active ones. And two studies by Ahlborg, et al. (1982, 1986) showed that glycogen stored in non-working muscles (e.g., the muscles of your arms when you’re working your legs) can be converted to lactate, exported to the bloodstream, and thereafter converted into glucose, which fuels your working muscles. In other words, the ability of lactate to directly and indirectly fuel working muscles turns your entire body into one giant lactate battery!
Dr. Timothy Noakes, a South African professor of exercise and sports science at the University of Cape Town and author of the book Lore of Running, as well as an author of the 1998 study referenced above, writes that lactate might “be one of the most important energy fuels in the body.” In the 1998 experiment, athletes exercised for six hours at 60 percent of VO2 max. During the last few hours of exercise, lactate provided approximately one-sixth of total energy, with glucose (mostly ingested) and fat providing the remainder. The authors concluded that “there must have been a considerable diffusion of unlabelled lactate from glycogen breakdown in inactive muscle fibres to adjacent active muscle fibres.”
Diffusion of lactate from nearby muscle fibers and export of lactate—and its subsequent conversion to glucose—from faraway fibers give you two more good reasons to engage in the cross training exercises illustrated in Chapter 9. Increasing MCTs in muscle fibers that can export lactate increases your available carbohydrate fuel supply.
Fat is good. In fact, when it comes to distance running, fat is great! It’s just that if carbohydrate-based aerobic energy production is slow, fat is glacial. Utilizing a multitude of steps, lipolysis (breakdown of fats to fuel aerobic energy production) delivers fatty acids to the mitochondria, which process them through the Krebs cycle and the electron transport chain. And if you’ve got the time, it’s worth the wait. A single palmitate fatty acid produces 129 ATP molecules, four times the amount netted from glucose or glycogen. But because fat-based energy production is so slow, it can’t keep up with the energy demands of races faster than 5K pace. That said, fat is a powerful fuel source for many occasions, including:
You can improve your fat-burning ability by increasing the number of fat-burning enzymes in your mitochondria and by training your body to become more efficient at using fat as a primary energy source. A study by E. Jansson and L. Kaijser found that trained athletes, exercising at 65 percent of VO2 max, produce 53 percent of their aerobic energy from fat, while untrained subjects produced only 33 percent from fat.
Fatigue during fat-based energy production often results from the biomechanical fatigue of longer efforts—your connective tissues and muscles take a beating.
Protein is an oft-forgotten energy source. It’s better known as the building block for muscle fibers and enzymes. But protein, once broken down into amino acids, can be converted to glucose by the liver. And broken down even further, it can even be converted to glucose within your muscle fibers, thereafter to be fed into the mitochondrial furnace. Ball State exercise physiologist David Costill estimates that up to 9 percent of the total energy expended during a marathon is fueled by protein. But that’s not a route you want to travel on a daily basis. Protein breakdown generates toxic wastes (e.g., ammonia). And protein provides structural and functional support for your cells—burning it is like having termites munching away at the support beams for your house.
As mentioned in Chapter 9, most runners are surprised to discover that the first thirty to fifty seconds of a race—of any race—are the most anaerobic. We’ve grown accustomed to thinking that races become more anaerobic as they proceed, but this simply isn’t the case. The reality is that all three energy systems kick in the second we launch ourselves off the start line. Because the sudden energy demand exceeds what can be produced aerobically—until enough oxygen is delivered to your muscle fibers and pyruvate is shuttled to your mitochondria—your anaerobic systems (phosphagen and glycolytic) must carry the early load. By about thirty seconds into longer races (e.g., 1500 meters or more), aerobic energy becomes the dominant energy source. But even in shorter races (e.g., 400 and 800 meters), aerobic energy starts to provide the majority of energy by forty to fifty-five seconds, as demonstrated in a 2003 Australian study by Duffield, Dawson, and Goodman. In races run at less than VO2 max (e.g., 5K or longer), your aerobic system will take over almost all energy production. In shorter races, the energy demand exceeds what aerobic energy alone can provide, and anaerobic systems will continue to contribute until the buildup of acidosis and other fatigue factors force you to slow down or stop. But that pain you feel during the final portion of the race—the bear jumping on your back—is not the point at which you “go anaerobic”; instead, it’s the point at which the increase of anaerobic by-products that began at the race start line has finally become too much to bear (pun intended).
Aerobic enzymes are mitochondria’s little helpers. These proteins improve your mitochondria’s ability to provide aerobic energy by increasing the efficiency of chemical reactions inside your mitochondria. Within five seconds of commencing exercise, these enzymes go to work, and their activity level increases all the way up to marathon pace. In fact, training at marathon pace (tempo) is a good way to trigger creation of even more aerobic enzymes. At faster paces, acidosis can occur, and it negatively impacts and even destroys these enzymes.
Generating ATP also generates heat—about 98.6°F in most humans. You can’t add energy to a system, in this case the human body, without creating heat. When you break down carbs and fats, you release energy to create ATP. When that ATP is used to power muscle contractions, you release more energy. But you don’t capture all that energy, funneling every spark into your next quadriceps or calf contraction. Instead, you use as little as 25 percent of your produced energy, while the remaining energy escapes as heat. That heat is the source of your body temperature.
Have you ever wondered why you shiver when you’re cold? It’s because shivering requires muscles to contract and relax quickly, generating more ATP and heat. When you’re hot, your body has two responses:
But even with increased blood flow and sweating, your core body temperature rises during exercise. Normally, that’s not a bad thing. Every runner knows that a warm-up aids performance. But when the air outside your body also heats up (especially if it’s humid, too), problems arise.
If the air temperature is higher than 98.6°F, your body will gain heat from the air. In that situation, sweating is the only way to cool down. But, again, sweat has to evaporate for that to work. If it’s humid, the air might not be able to absorb your sweat, and sweat dripping to the ground doesn’t help you. You’re left with no way to cool down except to jump in a pool, douse yourself with a hose, or stop exercising.
Steps you can take to mitigate the impact of hot and humid days include:
Table 10.2 Air Temperature and Pace Adjustments
|
Temperature |
Pace-per-Mile Adjustments Based on Heat* |
||||||||||||
|---|---|---|---|---|---|---|---|---|---|---|---|---|---|
|
Fahrenheit |
Celsius |
4:30 |
5:00 |
5:30 |
6:00 |
6:30 |
7:00 |
7:30 |
8:00 |
8:30 |
9:00 |
9:30 |
10:00 |
|
120 |
48.9 |
5:23 |
5:59 |
6:34 |
7:10 |
7:46 |
8:22 |
8:58 |
9:34 |
10:10 |
10:45 |
11:21 |
11:57 |
|
110 |
43.3 |
5:07 |
5:41 |
6:15 |
6:49 |
7:32 |
7:57 |
8:31 |
9:05 |
9:40 |
10:13 |
10:48 |
11:22 |
|
100 |
37.8 |
4:55 |
5:27 |
6:00 |
6:33 |
7:05 |
7:38 |
8:11 |
8:44 |
9:17 |
9:49 |
10:22 |
10:55 |
|
90 |
32.2 |
4:45 |
5:17 |
5:49 |
6:20 |
6:52 |
7:24 |
7:55 |
8:27 |
8:59 |
9:30 |
10:02 |
10:34 |
|
80 |
26.7 |
4:38 |
5:09 |
5:40 |
6:11 |
6:42 |
7:13 |
7:44 |
8:15 |
8:46 |
9:17 |
9:48 |
10:19 |
|
70 |
21.1 |
4:34 |
5:04 |
5:34 |
6:05 |
6:35 |
7:06 |
7:36 |
8:06 |
8:37 |
9:07 |
9:38 |
10:08 |
|
60 |
15.6 |
4:31 |
5:01 |
5:31 |
6:01 |
6:31 |
7:01 |
7:31 |
8:02 |
8:32 |
9:02 |
9:32 |
10:02 |
|
*53 |
11.4 |
4:30 |
5:00 |
5:30 |
6:00 |
6:30 |
7:00 |
7:30 |
8:00 |
8:30 |
9:00 |
9:30 |
10:00 |
|
50 |
10.0 |
4:30 |
5:00 |
5:30 |
6:00 |
6:30 |
7:00 |
7:30 |
8:00 |
8:30 |
9:00 |
9:30 |
10:00 |
|
40 |
4.4 |
4:31 |
5:01 |
5:31 |
6:01 |
6:31 |
7:01 |
7:31 |
8:02 |
8:32 |
9:02 |
9:32 |
10:02 |
|
30 |
-1.1 |
4:34 |
5:04 |
5:34 |
6:05 |
6:35 |
7:06 |
7:36 |
8:06 |
8:37 |
9:07 |
9:38 |
10:08 |
|
20 |
-6.7 |
4:38 |
5:09 |
5:40 |
6:11 |
6:42 |
7:13 |
7:44 |
8:15 |
8:46 |
9:16 |
9:47 |
10:18 |
|
10 |
-12.2 |
4:45 |
5:17 |
5:48 |
6:20 |
6:52 |
7:23 |
7:55 |
8:27 |
8:58 |
9:30 |
10:02 |
10:33 |
|
0 |
-17.8 |
4:54 |
5:27 |
6:00 |
6:32 |
7:05 |
7:38 |
8:11 |
8:43 |
9:16 |
9:49 |
10:21 |
10:54 |
|
-10 |
-23.3 |
5:07 |
5:41 |
6:15 |
6:49 |
7:23 |
7:57 |
8:31 |
9:05 |
9:39 |
10:13 |
10:47 |
11:21 |
|
-20 |
-28.9 |
5:22 |
5:58 |
6:34 |
7:10 |
7:46 |
8:21 |
8:57 |
9:33 |
10:09 |
10:45 |
11:20 |
11:56 |
TABLE 10.2 shows pace adjustments for distance runs (or tempo, reps, etc.) in the heat. The chart assumes that *53 degrees is the optimal temperature; pace headings reflect pace/mile at this temperature. Find your optimal pace in the top row, then find pace adjustments in the column below that pace (associated with the temperature in the two left-hand columns).
The good news is that your body will adapt to hot weather within two weeks. According to an Australian review article by Saunders, et al., your blood plasma increases by up to 12 percent, your heart rate goes down, your ventilation goes up, you sweat more, and your energy requirements are reduced. In other words, your body gets better at running in the heat by running in the heat.
The Build Your Running Diet section of this book will offer in-depth counseling on fuel choices, so for now we’ll take a brief look at four areas of immediate concern:
For a better fueling rundown, turn to Part Four of this book.
For this chapter’s photo instruction, we’re going to break down the caloric requirements of different workouts and tabulate approximate contributions from carbohydrates and fats. We’ll also offer some fueling tips. Breakdowns include:
It’s one thing to know how to do the various workouts that are required to build your running body. It’s another to properly fuel the effort. For this section, we’ll break down workouts into calories, carbohydrates, and fats. You’ll also find a meal or snack suggestion accompanying each workout. These suggestions are based on the specific caloric and nutritional requirements of each workout, but don’t worry that they’re your only choices. You’ll find more recipes in Part Four of this book, and you probably have some favorites of your own. These examples are offered to help you get started. Also, remember that you burn calories around the clock (unless you’re running one hundred miles per week or more, most of the calories you burn support your normal metabolism), so don’t limit fueling to replacement of calories burned through exercise. To use the tables:
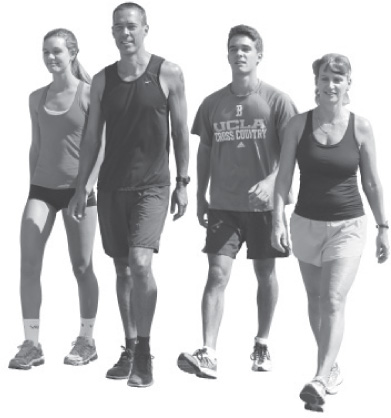
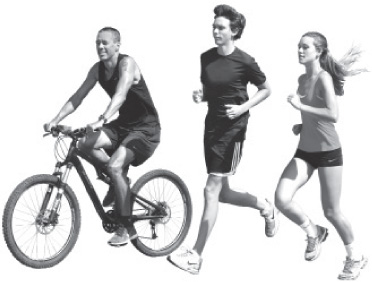
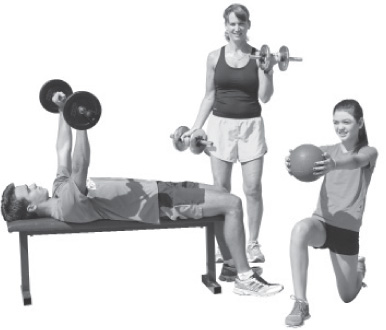
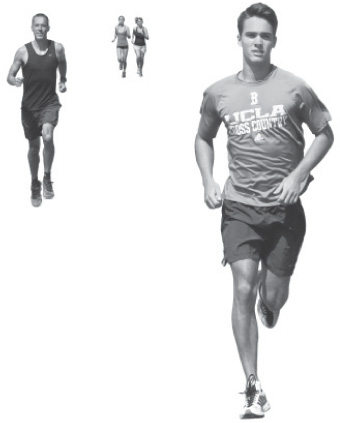
Because good fitness is a family affair, the Cushing-murrays will demonstrate the workouts. Christian, you’ve met. Wife Kathleen was a national junior age-group cross country champion and a scholarship athlete for UCLA. Son Nathaniel, now at UCLA, was a 9:15 high school 3200-meter runner. Daughter Jessica, still in high school, has run a 5:06 mile. Son Zachary was a sub-5:00 miler as a high school freshman. And daughter Rebecca ran a 5:27 mile in the sixth grade.
Walking recruits fewer muscle fibers at a less-intense effort than jogging or running, so it burns fewer calories. Most of the calories burned while walking come from fat, with carbs providing a smaller percentage. For “brisk walking,” add 5–10 percent more calories per mile.
Training: Energy and Nutrition Breakdown
|
Calories Burned Per Mile: Walking Pace |
|||
|---|---|---|---|
|
Weight (lbs.) |
Total Calories |
Calories from Carbs |
Calories from Fats |
|
50 |
27 |
5 |
22 |
|
75 |
40 |
7 |
33 |
|
100 |
53 |
9 |
44 |
|
110 |
58 |
10 |
48 |
|
120 |
64 |
11 |
52 |
|
130 |
69 |
12 |
57 |
|
140 |
74 |
13 |
61 |
|
150 |
80 |
14 |
66 |
|
160 |
85 |
15 |
70 |
|
170 |
90 |
16 |
74 |
|
180 |
95 |
17 |
79 |
|
190 |
101 |
18 |
83 |
|
200 |
106 |
19 |
87 |
|
210 |
111 |
19 |
92 |
|
220 |
117 |
20 |
96 |
|
230 |
122 |
21 |
101 |
|
240 |
127 |
22 |
105 |
|
250 |
133 |
23 |
109 |
|
275 |
146 |
26 |
120 |
|
300 |
159 |
28 |
131 |
|
Actual % Carbs/Fats Range |
14–21% |
86–79% |
|
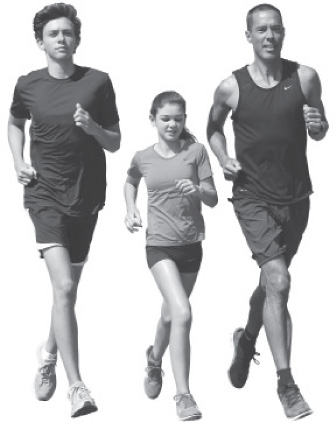
Jogging is more a matter of effort than pace. Sometimes jogging is performed at walking pace, while other times jogging can approach the effort of an easy run. Still, since the effort remains below that of a normal distance run, you’ll rely most heavily on fat as an energy source.
Training: Energy and Nutrition Breakdown
|
Calories Burned Per Mile: Jogging Pace |
|||
|---|---|---|---|
|
Weight (lbs.) |
Total Calories |
Calories from Carbs |
Calories from Fats |
|
50 |
38 |
12 |
26 |
|
75 |
57 |
17 |
40 |
|
100 |
76 |
23 |
53 |
|
110 |
84 |
26 |
58 |
|
120 |
91 |
28 |
63 |
|
130 |
99 |
30 |
69 |
|
140 |
106 |
32 |
74 |
|
150 |
114 |
35 |
79 |
|
160 |
122 |
37 |
85 |
|
170 |
129 |
39 |
90 |
|
180 |
137 |
42 |
95 |
|
190 |
144 |
44 |
100 |
|
200 |
152 |
46 |
106 |
|
210 |
160 |
49 |
111 |
|
220 |
167 |
51 |
116 |
|
230 |
175 |
53 |
122 |
|
240 |
182 |
56 |
126 |
|
250 |
190 |
58 |
132 |
|
275 |
209 |
64 |
145 |
|
300 |
228 |
70 |
158 |
|
Actual % Carbs/Fats Range |
26–35% |
74–65% |
|
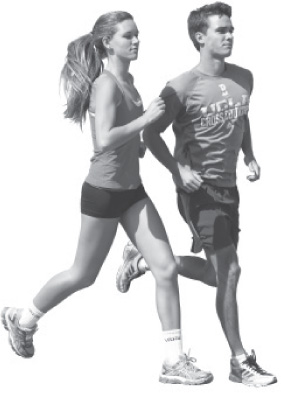
Regular runs include the full range of distance runs that you’ll include in your training diet: easy, regular, and long. For easy runs, you’ll probably burn near the lower end of the carbohydrate range. For long runs, you’ll burn near the high end of the range.
Training: Energy and Nutrition Breakdown
|
Calories Burned Per Mile: Regular Run Pace |
|||
|---|---|---|---|
|
Weight (lbs.) |
Total Calories |
Calories from Carbs |
Calories from Fats |
|
50 |
38 |
18 |
20 |
|
75 |
57 |
28 |
29 |
|
100 |
76 |
37 |
39 |
|
110 |
84 |
41 |
43 |
|
120 |
91 |
44 |
47 |
|
130 |
99 |
48 |
51 |
|
140 |
106 |
51 |
55 |
|
150 |
114 |
55 |
59 |
|
160 |
122 |
59 |
63 |
|
170 |
129 |
63 |
66 |
|
180 |
137 |
66 |
71 |
|
190 |
144 |
70 |
74 |
|
200 |
152 |
74 |
78 |
|
210 |
160 |
78 |
82 |
|
220 |
167 |
81 |
86 |
|
230 |
175 |
85 |
90 |
|
240 |
182 |
88 |
94 |
|
250 |
190 |
92 |
98 |
|
275 |
209 |
101 |
108 |
|
300 |
228 |
111 |
117 |
|
Actual % Carbs/Fats Range |
43–54% |
57–46% |
|
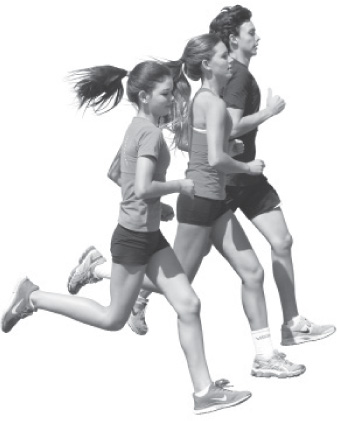
Tempo runs push the pace to an effort level that demands faster fueling from carbs. You’ll still burn fat for a third of your calories—plus, the fact that you’re covering ground faster means that you’ll actually burn about the same amount of fat per minute as you did during regular runs.
Training: Energy and Nutrition Breakdown
|
Calories Burned Per Mile: Tempo Pace |
|||
|---|---|---|---|
|
Weight (lbs.) |
Total Calories |
Calories from Carbs |
Calories from Fats |
|
50 |
38 |
25 |
13 |
|
75 |
57 |
38 |
19 |
|
100 |
76 |
51 |
25 |
|
110 |
84 |
56 |
28 |
|
120 |
91 |
61 |
30 |
|
130 |
99 |
66 |
33 |
|
140 |
106 |
71 |
35 |
|
150 |
114 |
76 |
38 |
|
160 |
122 |
82 |
40 |
|
170 |
129 |
86 |
43 |
|
180 |
137 |
92 |
45 |
|
190 |
144 |
96 |
48 |
|
200 |
152 |
102 |
50 |
|
210 |
160 |
107 |
53 |
|
220 |
167 |
112 |
55 |
|
230 |
175 |
117 |
58 |
|
240 |
182 |
122 |
60 |
|
250 |
190 |
127 |
63 |
|
275 |
209 |
140 |
69 |
|
300 |
228 |
153 |
75 |
|
Actual % Carbs/Fats Range |
62–72% |
38–28% |
|
Whether you’re running 5K/10K pace for repetitions or during a race, your carbohydrate requirements just increased. The speed with which carbs are burned combined with the length of time you’ll be running means you’ll be going deep into the muscle glycogen well. You’ll want to carbo-load the night before and follow the workout with a quick carb snack.
Training: Energy and Nutrition Breakdown
|
Calories Burned Per Mile: 5K/10K Pace |
|||
|---|---|---|---|
|
Weight (lbs.) |
Total Calories |
Calories from Carbs |
Calories from Fats |
|
50 |
38 |
31 |
7 |
|
75 |
57 |
47 |
10 |
|
100 |
76 |
63 |
13 |
|
110 |
84 |
69 |
15 |
|
120 |
91 |
75 |
16 |
|
130 |
99 |
82 |
17 |
|
140 |
106 |
87 |
19 |
|
150 |
114 |
94 |
20 |
|
160 |
122 |
101 |
21 |
|
170 |
129 |
106 |
23 |
|
180 |
137 |
113 |
24 |
|
190 |
144 |
119 |
25 |
|
200 |
152 |
125 |
27 |
|
210 |
160 |
132 |
28 |
|
220 |
167 |
138 |
29 |
|
230 |
175 |
144 |
31 |
|
240 |
182 |
150 |
32 |
|
250 |
190 |
157 |
33 |
|
275 |
209 |
172 |
37 |
|
300 |
228 |
188 |
40 |
|
Actual % Carbs/Fats Range |
77–88% |
23–12% |
|
Most efforts at mile race pace—whether for a race or repetitions—don’t burn fat. Above 100 percent of VO2 max, most runners burn only carbohydrates. So the table for mile-paced running shows total calories without breaking down fat or carb content (note that slower runners will burn some fat). Also, the calories are given in “per minute” totals, since all reps are less than a mile. It has been theorized that high-intensity training might lead to an “afterburn” of 3–5 percent additional calories, much of it from fat.
Training: Energy and Nutrition Breakdown
|
Calories Burned Per Minute: 1-Mile Pace |
|||||
|---|---|---|---|---|---|
|
Weight (lbs) |
Mile Pace |
||||
|
4:00 |
6:00 |
8:00 |
10:00 |
12:00 |
|
|
50 |
9.5 |
6.3 |
4.8 |
3.8 |
3.2 |
|
75 |
14.3 |
9.5 |
7.1 |
5.7 |
4.8 |
|
100 |
19.0 |
12.7 |
9.5 |
7.6 |
6.3 |
|
110 |
21.0 |
14.0 |
10.5 |
8.4 |
7.0 |
|
120 |
22.8 |
15.2 |
11.4 |
9.1 |
7.6 |
|
130 |
24.8 |
16.5 |
12.4 |
9.9 |
8.3 |
|
140 |
26.5 |
17.7 |
13.3 |
10.6 |
8.8 |
|
150 |
28.5 |
19.0 |
14.3 |
11.4 |
9.5 |
|
160 |
30.5 |
20.3 |
15.3 |
12.2 |
10.2 |
|
170 |
32.3 |
21.5 |
16.1 |
12.9 |
10.8 |
|
180 |
34.3 |
22.8 |
17.1 |
13.7 |
11.4 |
|
190 |
36.0 |
24.0 |
18.0 |
14.4 |
12.0 |
|
200 |
38.0 |
25.3 |
19.0 |
15.2 |
12.7 |
|
210 |
40.0 |
26.7 |
20.0 |
16.0 |
13.3 |
|
220 |
41.8 |
27.8 |
20.9 |
16.7 |
13.9 |
|
230 |
43.8 |
29.2 |
21.9 |
17.5 |
14.6 |
|
240 |
45.5 |
30.3 |
22.8 |
18.2 |
15.2 |
|
250 |
47.5 |
31.7 |
23.8 |
19.0 |
15.8 |
|
275 |
52.3 |
34.8 |
26.1 |
20.9 |
17.4 |
|
300 |
57.0 |
38.0 |
28.5 |
22.8 |
19.0 |
Find your weight and mile pace; calories burned while sustaining that pace for a minute appear in the column beneath the pace. All values are approximate.
Training or racing at 800m pace burns only carbohydrates. But it’s hard to estimate the exact energy cost. When aerobically produced energy is your primary source, the energy cost is straightforward. But the moment that strength, speed, power, greater muscle fiber recruitment, and a primarily anaerobic energy supply become factors, the science becomes less clear, because studies to date haven’t addressed those factors. Add to that a theorized 3–5 percent “afterburn” of additional calories, much from fat, and it’d be fair to say that calorie totals are partly guesswork. This book’s best guess is that calorie totals are higher than those indicated.
Training: Energy and Nutrition Breakdown
|
Calories Burned Per Minute: 800m Pace |
|||||
|---|---|---|---|---|---|
|
Weight (lbs) |
800m Pace |
||||
|
2:00 |
2:30 |
3:00 |
4:00 |
5:00 |
|
|
50 |
9.4 |
7.6 |
6.3 |
4.7 |
3.8 |
|
75 |
14.2 |
11.3 |
9.4 |
7.1 |
5.7 |
|
100 |
18.9 |
15.1 |
12.6 |
9.4 |
7.6 |
|
110 |
20.9 |
16.7 |
13.9 |
10.4 |
8.4 |
|
120 |
22.6 |
18.1 |
15.1 |
11.3 |
9.0 |
|
130 |
24.6 |
19.7 |
16.4 |
12.3 |
9.8 |
|
140 |
26.3 |
21.1 |
17.6 |
13.2 |
10.5 |
|
150 |
28.3 |
22.7 |
18.9 |
14.2 |
11.3 |
|
160 |
30.3 |
24.3 |
20.2 |
15.2 |
12.1 |
|
170 |
32.1 |
25.7 |
21.4 |
16.0 |
12.8 |
|
180 |
34.1 |
27.2 |
22.7 |
17.0 |
13.6 |
|
190 |
35.8 |
28.6 |
23.9 |
17.9 |
14.3 |
|
200 |
37.8 |
30.2 |
25.2 |
18.9 |
15.1 |
|
210 |
39.8 |
31.8 |
26.5 |
19.9 |
15.9 |
|
220 |
41.5 |
33.2 |
27.7 |
20.8 |
16.6 |
|
230 |
43.5 |
34.8 |
29.0 |
21.7 |
17.4 |
|
240 |
45.2 |
36.2 |
30.2 |
22.6 |
18.1 |
|
250 |
47.2 |
37.8 |
31.5 |
23.6 |
18.9 |
|
275 |
51.9 |
41.6 |
34.6 |
26.0 |
20.8 |
|
300 |
56.7 |
45.3 |
37.8 |
28.3 |
22.7 |
Find your weight and 800m pace; calories burned while sustaining that pace for a minute appear in the column beneath the pace. All values are approximate.
Few runners will run “sprints” at faster than 400-meter pace—and those who run HIIT can confidently use this same table. Again, it’s nearly impossible to estimate accurate energy expenditures for primarily anaerobic activity, but this table should give you a ballpark idea. Sprint workouts won’t burn a lot of calories, although there’s a theorized 3–5 percent “afterburn” of additional calories, much from fat.
Training: Energy and Nutrition Breakdown
|
Calories Burned Per Minute: 400m Pace |
|||||
|---|---|---|---|---|---|
|
Weight (lbs) |
400m Pace |
||||
|
:50 |
1:00 |
1:20 |
1:40 |
2:00 |
|
|
50 |
11.3 |
9.4 |
7.1 |
5.7 |
4.7 |
|
75 |
17.0 |
14.2 |
10.6 |
8.5 |
7.1 |
|
100 |
22.7 |
18.9 |
14.2 |
11.3 |
9.4 |
|
110 |
25.1 |
20.9 |
15.7 |
12.5 |
10.4 |
|
120 |
27.1 |
22.6 |
17.0 |
13.6 |
11.3 |
|
130 |
29.5 |
24.6 |
18.5 |
14.8 |
12.3 |
|
140 |
31.6 |
26.3 |
19.8 |
15.8 |
13.2 |
|
150 |
34.0 |
28.3 |
21.3 |
17.0 |
14.2 |
|
160 |
36.4 |
30.3 |
22.7 |
18.2 |
15.2 |
|
170 |
38.5 |
32.1 |
24.0 |
19.2 |
16.0 |
|
180 |
40.9 |
34.1 |
25.5 |
20.4 |
17.0 |
|
190 |
42.9 |
35.8 |
26.8 |
21.5 |
17.9 |
|
200 |
45.3 |
37.8 |
28.3 |
22.7 |
18.9 |
|
210 |
47.7 |
39.8 |
29.8 |
23.9 |
19.9 |
|
220 |
49.8 |
41.5 |
31.1 |
24.9 |
20.8 |
|
230 |
52.2 |
43.5 |
32.6 |
26.1 |
21.7 |
|
240 |
54.3 |
45.2 |
33.9 |
27.1 |
22.6 |
|
250 |
56.7 |
47.2 |
35.4 |
28.3 |
23.6 |
|
275 |
62.3 |
51.9 |
39.0 |
31.2 |
26.0 |
|
300 |
68.0 |
56.7 |
42.5 |
34.0 |
28.3 |
Find your weight and 400m pace; calories burned while sustaining that pace for a minute appear in the column beneath the pace. All values are approximate.
Cross training encompasses a wide variety of sports and workouts and can’t be broken down into calories burned across the board. Instead, this table attempts to give you an idea of how different cross training activities at different intensities stack up against one another.
Training: Energy and Nutrition Breakdown
|
Cross Training - Calories Burned per 60 Minutes |
||
|---|---|---|
|
Type |
Intensity |
Calories |
|
Elliptical |
Level-5 setting |
550 |
|
ElliptiGO |
15 mph |
600 |
|
Treadmill |
7 mph |
650 |
|
Pool Running |
Marathon effort |
450 |
|
Cross Country Skiing |
8 mph |
675 |
|
Snow Shoeing |
3 mph |
625 |
|
Kickboxing |
Medium effort |
525 |
|
Cycling |
14 mph |
475 |
|
Stair Climbing |
Level-5 setting |
506 |
|
Swimming |
75 meters/minute |
375 |
|
Indoor Rowing |
125 watts |
550 |
Note: All values are approximate.
All resistance training is not created calorically equal. High-intensity endurance training workouts, like The Runner 360 (see page 53), burn lots of calories in 30 minutes (the factor used for determining calories in the table). Traditional weightlifting, with breaks between sets, burns fewer calories, although still a high percentage of carbs.
Training: Energy and Nutrition Breakdown
|
Resistance Training—Calories Burned per 30-Minute Workout |
||||||
|---|---|---|---|---|---|---|
|
Weight (lbs.) |
Weightlifting |
The Runner 360 |
||||
|
Cals |
Carb Cals |
Fat Cals |
Cals |
Carb Cals |
Fat Cals |
|
|
50 |
47 |
43 |
5 |
143 |
128 |
15 |
|
75 |
71 |
64 |
7 |
214 |
193 |
21 |
|
100 |
95 |
86 |
9 |
285 |
257 |
28 |
|
110 |
104 |
94 |
10 |
314 |
282 |
32 |
|
120 |
114 |
103 |
11 |
342 |
308 |
34 |
|
130 |
123 |
111 |
12 |
371 |
333 |
38 |
|
140 |
133 |
120 |
13 |
399 |
359 |
40 |
|
150 |
142 |
128 |
14 |
428 |
384 |
44 |
|
160 |
152 |
137 |
15 |
456 |
410 |
46 |
|
170 |
161 |
145 |
16 |
485 |
436 |
48 |
|
180 |
171 |
154 |
17 |
513 |
462 |
51 |
|
190 |
180 |
163 |
18 |
542 |
488 |
54 |
|
200 |
190 |
171 |
19 |
570 |
513 |
57 |
|
210 |
199 |
179 |
20 |
599 |
539 |
60 |
|
220 |
209 |
188 |
21 |
627 |
564 |
63 |
|
230 |
218 |
196 |
22 |
656 |
590 |
66 |
|
240 |
228 |
205 |
23 |
684 |
616 |
68 |
|
250 |
237 |
213 |
24 |
713 |
641 |
72 |
|
275 |
261 |
235 |
26 |
784 |
706 |
78 |
|
300 |
285 |
256 |
28 |
855 |
770 |
85 |
Note: All values are approximate.
You won’t need to worry about in-race fueling for 5Ks to 10Ks. But once races reach 70 minutes or longer, you can fuel with 30–60 grams of carbohydrate per hour (test yourself in training first, as different runners’ needs and gastrointestinal reactions will vary). Since runners differ in how often—and how much—they want to fuel while racing, this table breaks down different fueling options in increments of 15–60 grams. For example, if you choose to consume 30 grams of carbs per hour, and Gatorade is your fuel of choice, you’ll drink 8 ounces (the 15-gram equivalent) every 30 minutes. Many runners mix and match fueling sources during a race. Note that gels—a favored fueling source—come in 25-gram packets, but you probably wouldn’t want to split those; you’ll just take one every 30 minutes or hour, depending on your personal requirements. If you prefer chewy (rubbery) cubes or jelly beans to drinks and gels, then Clif Shot Bloks or sport beans might be the fueling option for you.
Training: Energy and Nutrition Breakdown
|
Marathon Fueling |
|||||
|---|---|---|---|---|---|
|
Fuel Options |
Options for 15–60 Grams of Carbohydrates per Hour |
||||
|
15 Grams |
25 Grams |
30 Grams |
50 Grams |
60 Grams |
|
|
Clif Shot Bloks |
2 pieces (16g) |
3 pieces (24g) |
4 pieces (32g) |
6 pieces (48g) |
8 pieces (64g) |
|
Dates |
1 date (18g) |
1.5 dates (27g) |
2 dates (36g) |
3 dates (54g) |
3.5 dates (63g) |
|
Fig Newtons |
0.5 cookies (11g) |
1 cookie (22g) |
1.5 cookies (33g) |
2 cookies (44g) |
3 cookies (66g) |
|
Gatorade |
8 oz (14g) |
12 oz (20g) |
16 oz (26g) |
32 oz (52g) |
36 oz (60g) |
|
Gels |
n/a |
1 packet (25g) |
n/a |
2 packets (50g) |
n/a |
|
Honey |
1 tbsp (17g) |
n/a |
2 tbsp (32g) |
n/a |
4 tbsp (64g) |
|
Power Bar |
0.25 bars (11g) |
0.5 bars (22g) |
0.75 bars (33g) |
1 bar (44g) |
1.5 bars (66g) |
|
Pretzels (mini) |
12 pretzels (15g) |
20 pretzels (25g) |
24 pretzels (30g) |
40 pretzels (50g) |
48 pretzels (60g) |
|
Raisins |
50 raisins (15g) |
1 ounce box (22g) |
100 raisins (30g) |
2 boxes (44g) |
200 raisins (60g) |
|
Sport Beans |
9 beans (15g) |
1 ounce packet (25g) |
18 beans (30g) |
2 packets (50g) |
|