


CHAPTER 11
Strategies for Teaching Math
What Is It?
In many ways, science is the application of math. During science lessons, students can use mathematical thinking to solve problems, interpret data, and measure objects and phenomena.
The Next Generation Science Standards (NGSS) authors didn't want science teachers to outpace grade-level math content. Their goal, instead, was to incorporate grade-level math curriculum into science lessons so that science classes were reinforcing the math concepts by applying them to real-life settings (NGSS, 2013e).
To ensure we are complementing our math colleagues, we review the Common Core Math Standards that students have been taught in previous grades and will be taught this current school year. For example, because science lessons require students to measure a myriad of objects and phenomena, we take note of the measurement standards, which include
- measuring length using several different tools (rulers, meter sticks, measuring tape)
- measuring liquid volumes
- measuring masses of objects
- using units of measurement from both the metric and Imperial systems (grams, kilograms, liters, inches, feet, centimeters, and meters)
- adding, subtracting, and dividing liquid volumes, masses, and lengths of the same unit of measurement
Table 11.1 Measurement Standards per Grade Level
| Measurement standards | Grade level |
| Convert units of measurement within the same system (i.e., 3 ft = 1 yard and 100 cm = 1 m) | 4 |
| Solve multi-step, real-world word problems by converting units of measurement within the same system | 5 |
| Convert units across the measurement systems (metric vs. Imperial) (i.e., 5 in. = 12.7 cm) | 6 |
When we create lessons for elementary students, we consider their math background and the current math skills they are learning, depending on their grade level. Generally, this requires a conversation with the math teacher, who can also provide insight into the struggles students are having in math. We often co-plan with the math teachers so that our lessons are reinforcing their curriculum. For example, Table 11.1: Measurement Standards per Grade Level shares math curriculum expectations that also appear in the Next Generation Science Standards (NGSS, 2013e).
Why We Like It
In our experience, many secondary students have the mistaken perception that because they learn subjects in separate classes, the subjects are independent of each other. For example, when we ask our students to write an essay, some students protest with “but this isn't English class.” When students use mathematical concepts in science class, we are strengthening their math skills but also communicating that content areas are often integrated beyond the school environment.
Supporting Research
Math skills are required in many science lessons and everyday applications of science.
Teaching students how to read and make graphs is an essential skill for science learning. Graphs have been found to promote a deeper understanding of science concepts (Kilic, Sezen, & Sari, 2012, p. 2937).
In this chapter, we will provide resources for teaching students how to perform dimensional calculations. Dimensional analysis can help students with calculations in and out of science class because it has been determined that it does not require a high level of mathematical skill (Reichelova & Teleki, 2013).
Chemistry classes are required for most professions in the medical field because chemistry is the basis for how drugs work on the body (Helmenstine, 2019). Chemistry classes usually teach students how to perform dimensional analysis calculations in order to prepare them for future careers. For example, research has found that when nursing students are taught how to determine medication calculations, they tend to make fewer errors when they use dimensional analysis instead of algebraic equations that solve for x (Greenfield, Whelan, & Cohn, 2006).
Skills for Intentional Scholars/NGSS Connections
Utilizing math while learning science concepts requires students to practice all three Skills for Intentional Scholars. When students are solving challenging math problems, they can use their critical thinking and effective problem-solving skills. When students use graphs and data tables to record and share their data, they practice their effective communication skills.
In addition to the Skills for Intentional Scholars, the NGSS require students to use math skills in several of the engineering practices. For example, students must use “mathematics and computational thinking” and engage “in argument from evidence” (NGSS, 2013b). This chapter will also provide resources for the engineering practice of analyzing and interpreting data.
The NGSS also require students to use the crosscutting concept of “scale, proportion, and quantity,” which has them recognize what is “relevant at different size, time, and energy scales, and to recognize proportional relationships between different quantities as scales change” (National Science Teaching Association, n.d.). This chapter emphasizes using units of measurement in both the metric and Imperial systems because the K-12 Science Education Framework that was used to author the NGSS suggests that students can obtain an understanding of scale by using various units of measurement (Teaching Science as Inquiry, 2019).
Application
We first provide resources for teaching students to make, choose, and interpret graphs. Then we offer strategies to teach students how to complete dimensional analysis problems and how to use the metric and Imperial systems of measurement. This section also provides a specific lesson plan for celebrating March 14, which is known as Pi Day.
See Chapter 3: Strategies for Teaching the Scientific Method and Its Components for resources on another math-related skill: teaching students how to make data tables.
MAKING GRAPHS
Elementary and Middle School
Students can graph data from many experiments that are performed in class. In our experience, elementary and middle school students benefit from proactive lessons that teach them how to make graphs.
The Common Core Math Standards require students in second grade to learn how to make bar graphs (Common Core State Standards Initiative, 2019a, 2019b, 2019c, Math) so we use bar graphs in our examples when we work with fourth grade students. See Figure 11.1: Bar Graph Example for Teaching Graphing to Fourth Grade Students. Note that students need to know the vocabulary words horizontal and vertical to effectively use Figure 11.1. Line graphs are introduced in the fifth grade Common Core Math Standards (Common Core State Standards Initiative, 2019a, 2019b, 2019c), so this is when we also begin using line graphs and the terms “x- and y-axis.” See Figure 11.2: Line Graph Example for Teaching Graphing to Fifth Grade and Beyond.
When we first introduce graphing to students, they each receive a copy of Figure 11.1 or Figure 11.2, depending on their grade level. Using the students' data from a recent experiment, we model, step-by-step, how to turn their data table into a graph. As they work, we walk around the room to ensure they are following the process and to support students as they are creating their graphs.
After their graphs are complete, we provide a widely known science acronym to help them remember the basic parts of every graph. The acronym is DRY MIX. Here is an explanation of what each letter represents:
- D = dependent variable
- R = responding variable
- Y = y-axis (graph information on the vertical axis, also called the y-axis)
- M = manipulated variable
- I = independent variable
- X = x-axis (graph information on the horizontal axis, also called the x-axis)
Another well-known acronym we've found useful is TAILS, which stands for:
- T = title (must include all variables)
- A = axis labels (DRY MIX)
- I = interval marks (ensure they start at zero)
- L = label units (units of measurement)
- S = scale (ensure the intervals are equal)
To teach these two acronyms, we write the letters on the board. Students then work with a partner to guess what each letter represents. When they guess correctly, they are given a piece of chalk or a dry erase marker to write the answer on the board. Once all correct answers are written on the board, we provide any remaining parts of the acronym they didn't accurately guess. We then have students add the acronyms and their meanings to their notes or to Figure 11.1 and Figure 11.2.
When students make future graphs, we encourage them to use Figures 11.1 and 11.2 and follow the step-by-step procedures to ensure they have all of the requirements for a scientific graph.
See the section “Celebrating Pi Day” for resources students can use to make graphs in Microsoft Excel.
High School
We don't assume high school students know how to create a scientifically accurate graph.
After students perform their first class experiment and collect data, we require them to complete a pretest (see Figure 11.3: Example of Graphing Pretest and Figure 11.4: Example of Graphing Pretest—Answer Key). Our aim is to identify which students know how to make graphs and which students require further instruction.
If half of the class does well on the pretest and the other half proves to need more instruction, we strategically pair students so one student who is already proficient in making graphs is partnered with a student who requires more support. Each student creates their own graph using the data they collected in the class experiment; however, we permit students to work with their assigned partners to complete their graphs.
If a small number of students pass the pretest, then we allow these students to graph their data individually. As they are making their graphs, we model graphing to the remaining students during a class discussion.
If a majority of the students pass the pretest, they make their graphs individually while we meet in a small group with the few students who require more help. Each of these students makes his/her own graph but the graphs are constructed as a group, one step at a time.
Choosing the Type of Graph
In our experience, students of all grade levels often struggle to determine which type of graph is best to use. By the time students reach the secondary level, they may have already been exposed to four types of graphs: bar graphs, single and double line graphs, and pie charts. We use Figure 11.5: Which Type of Graph Should I Use? to give secondary students practice in determining which type of graph they should use with different types of data.
Each student receives their own copy of Figure 11.5. We model how to complete the first problem in front of the whole class. We use a strategy we call “I am thinking…,” which requires us to think aloud as we work through the problem. By doing this, students witness our thought process live. We start every statement with “I am thinking”; for example, for the first problem we say the following:
- “I am thinking…the data Xee is going to collect is the number of times the flowers are landed on.”
- “I am thinking…since that is the data she is collecting during the experiment, it is my dependent variable.”
- “I am thinking…that the dependent variable goes on the y-axis.”
We draw an x- and y-axis on the board and label the y-axis with “Number of Times the Flowers are Landed on.” We continue modeling our thinking.
- “I am thinking…there are three colors: pink, blue, and green. Flower color is the only difference between the flowers so this is my independent variable.”
- “I am thinking…that the independent variable goes on the x-axis.”
We label the x-axis “Flower Color.”
- “I am thinking…that because the x-axis doesn't have numbers, I have to make a bar graph.”
We begin making one bar for each flower color to show students what the final product may look like.
Once the first problem is complete, we ask students if they have any questions and address each one for the class.
To differentiate for older and advanced students, we ask them what other type of graph can be used to represent the same data. As shown in Figure 11.6: Which Type of Graph Should I Use?—Answer Key, the first problem on the worksheet has two correct answers. If students struggle to realize that the data can also be graphed using a pie chart, we pose the question, “What if the number of times a flower was landed on was changed to a percentage?” We've found this prompt is enough to guide students toward a pie chart. We ask a volunteer to demonstrate the “I am thinking…” process to walk through how they would determine they can use a pie chart.
After modeling the first problem, students are instructed to work with a partner and complete the second one on the worksheet using the “I am thinking…” process. This requires them to draw a graph and talk out their thinking as they are drawing. We walk around the classroom and provide assistance to student pairs. We never give the correct answer but, instead, ask guiding questions such as, “What data is the scientist collecting during the experiment?” and “Where does the independent variable go on a graph?”
Once everyone completes the second problem, we ask for a pair of students to demonstrate their “I am thinking…” process to the class. Afterwards, we ask students to work with their partners and complete the rest of the worksheet. When everyone is done, student pairs volunteer to use the “I am thinking…” strategy to share their thought processes and answers with the class. If anyone has a different answer, it may be because several of the problems have multiple correct answers. We use this opportunity to explain to students that as long as graphs and pie charts are created correctly, there are many times in math and science when there are multiple ways to get to the correct answer.
Analyzing and Interpreting Graphs
In our experience, the best way to teach students how to analyze and interpret graphs is through a lot of practice.
When data and graphs are analyzed, statements of fact are documented. For example, when analyzing the data in Figure 11.7: Temperature vs. Number of Escherichia coli Colonies, we would write the following analysis statements:
- The highest temperature where E. coli colonies grew was 31 °C. At this temperature, there were 22 colonies.
- The lowest temperature where E. coli colonies grew was 6 °C. At this temperature, there were 68 colonies.
- As the temperature increased, the number of E. coli colonies decreased.
When data and graphs are being interpreted, it means that conclusions are drawn regarding the meaning of the data, or the relationship between the variables. For example, using the graph in Figure 11.7 again, these two statements are our assumptions regarding the relationship between temperature and number of E. coli colonies:
- E. coli grows more in lower temperatures.
- Higher temperatures are not the ideal environment for E. coli colonies.
In our experience, many students of all grade levels do not know the difference between analyzing and interpreting data. To teach this contrast, we first provide each student a copy of a sample graph while also posting it on the board. Figure 11.8: Year vs. Number of Deer and Wolves is an example of a graph we use.
We explain that when graphs are analyzed, scientists write statements of fact and each statement usually includes specific data from the graph, although it's not required. We provide two examples and then ask student pairs to write two additional examples. Here are a few example analysis statements for Figure 11.8:
- In 2009, there were 11 deer and 1 wolf.
- Seventeen years later, it was 2026 and there were 10 deer and 6 wolves.
- In 2015, there were four more wolves than deer.
- When the deer population is high, the wolf population increases.
While students are writing their two analysis statements, we walk around the room to provide assistance. If students are struggling, we don't give them answers but, instead, ask guiding questions such as, “In your opinion, which year has the most surprising data? How can you analyze it?”
Once all student pairs have two additional analysis statements written on their paper, we ask volunteers to read their statements.
We then explain that when graphs are interpreted, we give meaning to the data by making assumptions or drawing conclusions of how the variables are related. We provide two examples and then ask student pairs to write two additional statements. Here are some examples:
- When the wolf population is at its highest, they are killing the most deer, causing the deer population to decrease.
- When the deer population is low, the wolves have less food so their population decreases.
- When the wolf population is decreasing, there are less predators for the prey so the deer population increases.
While students are writing their two interpretation statements, we again walk around the room to help students. To prompt their critical thinking, we don't give answers. Instead, we ask guiding questions such as, “What seems to be the relationship between the wolves and the deer?”
Once all student pairs have two additional analysis statements written on their paper, we ask volunteers to read their statements.
We often use data from local phenomena to create authentic graphs. For example, our school is near a large man-made lake named Tempe Town Lake. When we began an ecology unit, we contacted Phoenix Sky Harbor Airport, which is a 10-minute drive from Tempe Town Lake. The airport officials provided their wildlife strike data (when man-made objects, such as airplanes, hit wildlife), which we turned into a graph that could be used in a lesson. See Figure 11.9: Wildlife Strike Data Analysis and Interpretation for a copy of the worksheet we used to teach students how water attracts animals. It doubled as an opportunity to practice analyzing and interpreting graphs. The answer key is provided in Figure 11.10: Wildlife Strike Data Analysis and Interpretation—Answer Key.
See Table 11.2: Authentic Data Ideas for additional phenomena that can supply authentic data in several different areas of the world. Authentic data that cannot be obtained online most often can be acquired with a phone call. We've found that people are very accommodating when they find out that we are teachers asking for data to use in our class.
DIMENSIONAL ANALYSIS
Dimensional analysis is mathematically changing one unit of measurement into another unit of measurement where both quantities are equal (Garcia, 2019). For example, students perform dimensional analysis when they change inches into miles.
Table 11.2 Authentic Data Ideas
| Phenomenon | Authentic data | Possible data resources |
| Precipitation (snowfall, hail, rain) | Amount in a specific area | Counties |
| River or lake | Number of times its flooded or how high the water level has been in the past | State Departments of Environmental Quality or the U.S. Geological Survey |
| Fault line | Number of earthquakes in a specific timeframe or average strength of earthquakes | U.S. Geological Survey |
| Temperature | High temperatures vs. low temperatures | Counties |
| Tides | Times or height of high/low tides or spring/neap tides | National Oceanic and Atmospheric Administration |
| Garbage on a beach | Weight of plastic refuse | State Departments or the U.S. Environmental Protection Agency |
| Local invasive species | Population dynamics, including the size and average age | State Departments or the U.S. Department of the Interior |
| Air quality | AQI—Air Quality Index, including amount of ozone, pollen, and particles | State Departments of Environmental Quality |
| Tornadoes | Number or strength of tornadoes in a specific area or the speed of tornadoes | National Oceanic and Atmospheric Administration |
| Traffic accidents | Cause of traffic accidents, focusing on speed and impact with inanimate objects | State Department of Public Safety |
| Bridge inspections | Which bridge designs can withstand high winds, excessive payload, or weathering | U.S. Department of Transportation: Federal Highway Administration |
The key to performing dimensional analysis problems correctly is writing the units of measurement for every number. Students attempt to take the easy way out by simply writing numbers, but minor errors can easily be made using this shortcut.
When we introduce dimensional analysis to students, we use examples that involve money or time because these are simple concepts they theoretically learned in the primary grades (Common Core State Standards Initiative, 2019c). See Figure 11.11: Dimensional Analysis Practice for the worksheet we provide to each student.
We have a class discussion and help students to walk step-by-step through the first problem. We model how to complete it on the board. Here is an example of what that discussion might look like:
| US: | When starting a dimensional analysis problem, identify what unit of measurement you need at the end. What is the first problem on your worksheet asking you to find? |
| STUDENTS: | Dimes. |
| US: | Yes, that's correct. So, on the right side of my paper, I'm going to write dimes. Why did I put this on the right side of the paper? |
| STUDENTS: | Because this will be the answer, which goes at the end of the math problem. |
| US: | Good! We are working backwards so what should we draw to the left of ‘dimes’? |
| STUDENTS: | An equal sign. |
| US: | That is correct. While I'm writing the answer on the board, you need to copy it onto your paper. I'll walk around in a minute so you can ask me questions. OK, now we are going to go to the beginning of the math problem. We know from the problem that we are starting with $8.00, so I'm going to write 8 dollars. Then I'm going to draw a multiplication sign, which is always the type of math you do in dimensional analysis. To change dollars into dimes, I need to get rid of the dollars. I'm going to make a fraction after my multiplication sign. To cancel out the dollars, should I put dollars in the numerator or the denominator?” |
| STUDENTS: | The denominator. |
| US: | Yes! So let's write 1 dollar in the denominator. Now, how many dimes are in one dollar? |
| STUDENTS: | Ten. |
| US: | OK, so then 10 dimes goes into the numerator. Now I'm going to cross out the dollar that's after the 8 and I'm going to cross out the dollar in the denominator. They cancel each other. The last step is to multiply across so that you multiply 8 by 10. Do this now while I walk around the room, checking to see if you need help. You may work with your partner. |
As we walk around, we help struggling students by guiding them through the math problem. If they get stuck and don't know what to do, we go back to the questions we asked during the class discussion; for example, we ask, “Which unit do you need to cancel out?”
After students correctly complete the first problem, we ask them a conceptual question, such as, “The answer is 80 dimes. What does the number ‘80’ represent?” Students are provided time to discuss the answer with their partner and then we randomly call on a student to explain that the number 80 represents the number of dimes in $8. Research shows that by asking conceptual questions after students complete a math equation, they tend to understand the purpose of the equation and answer, which can lead to enhanced problem-solving skills (Thompson, Philipp, Thompson, & Boyd, 1994).
Students then complete the remaining math problems on the worksheet. The third problem requires students to switch the data in the numerator and denominator. Some students may have the math skills needed to figure this out while other students may struggle at this point. This is another time when walking around the room is imperative because we may need to guide students. If several student groups can't figure out that they need to switch the denominator and numerator, we obtain the attention of the whole class and model how to work the problem.
Once all students are done with the money problems, we move to multi-step dimensional analysis problems using time as the unit of measurement. This is the second half of Figure 11.11: Dimensional Analysis Practice.
We first model problem number five on the worksheet and ask students to copy down everything we write on the board. After setting up the answer to the problem by placing “seconds” on the right side of the paper, we ask students questions, such as, “How many seconds are in one minute?” We continue to guide them through the math problem by asking other leading questions so they recognize that their goal is to use new units to cancel existing units.
As students complete this problem correctly, they are instructed to work with their learning partner to complete the worksheet and to ask if they have any questions. We continue walking around the room, stopping to check on every student group so that all students receive support and immediate feedback. The answer key for Figure 11.11 is Figure 11.12: Dimensional Analysis Practice—Answer Key.
Table 11.3 Measurement Examples for Content-Related Dimensional Analysis Problems
| Content area | Variable examples to be measured and changed |
| Chemistry | Density, mass, moles, molar mass, volume, temperature, time |
| Physics | Velocity, speed, momentum, force, acceleration, temperature, time, wavelength, frequency, work, kinetic energy, electrical potential |
| Biology | Mass, area, growth rate, carrying capacity, population density, time, birth rate, death rate, pulse, pressure, volume |
| Earth Science | Velocity, speed, mass, area, distance, volume, density, miles per gallon, time |
| Engineering | Mass, area, temperature, speed, velocity, distance, time, fluid mechanics (i.e., chimney flow, surface waves, and ship waves), elasticity, critical load, density |
After students complete this practice worksheet, we assign dimensional analysis problems that pertain to the unit we are teaching. Table 11.3: Measurement Examples for Content-Related Dimensional Analysis Problems provides specific ideas of variables that can be measured and changed using dimensional analysis.
There are many dimensional analysis worksheets available online for every content area. Many of these online worksheets also include the answer key. When we use other teachers' worksheets that we have obtained from the Internet, we require that all student work be completed in class to prevent students from searching for the answers.
METRIC AND IMPERIAL SYSTEMS
Grade-Level Math Skills and Standards
Most science lessons require students of all ages to measure objects and phenomena, including how they change over time. For example, science labs collect data that measure distance, temperature, mass, weight, energy, force, and volume.
Which measurement system should we teach in our classes: the metric or Imperial system? The NGSS and Common Core Math Standards require that students know both the metric and Imperial systems (NGSS, 2013e). Students need to know the two systems for real-life applications. For example, NASA uses both the metric and Imperial systems (NASA, 2014).
At which grade should each of the measurement systems be introduced to students? The NGSS require that students use both measurement systems to measure objects prior to the third grade (NGSS, 2013e). Between fourth and sixth grade, the NGSS require students to learn how to convert within and between the two measurement systems.
Nevertheless, many students still do not have—or do not remember—this knowledge by the time they enter high school. We regularly teach it to our secondary classes.
Teaching the History of the Measurement Systems
To help students understand why it's important to use the same measurement system as other societies and governments, we introduce the history of the two systems. We ask students if they know the history of the Imperial system (also known as the standard system) or if they know the history of the metric system. We provide time for students to share any of their knowledge. In our experience, students who have lived in other countries are most likely to volunteer their personal stories with the class. This sharing is an excellent opportunity for us to develop a culturally responsive classroom. See Chapter 14: Strategies for Cultural Responsiveness for additional strategies to make your classroom culturally responsive.
Sometimes students provide misinformation or are missing information, so we share the history based on an Encyclopedia Britannica article (Zupko & Chisholm, 2019). Here is how we tell it:
For centuries, many countries were using their own measuring techniques. But as the world's population increased and technology advanced, people from different countries began trading with each other. But they found it difficult to trade because they weren't measuring the same object with the same unit of measurement. Think about it: How would you know if you were getting a deal or getting ripped off when someone from another country offered you 3 yayas of candy for your 2 pounds of sugar? Without knowing what a “yaya” is, you can't determine if you are making a good trade.
At this point, we stop the story and have students share out their feelings. Then we ask them how all of these different countries should solve their trading problem. Students share any ideas they come up with and then we continue with the story.
About 800 years ago, many countries decided they needed to use the same units of measurement. This is called a standardized system. For example, maybe one yaya is equal to 2 pounds and this is true everywhere you go and with everyone you trade.
After we won the American Revolution, the U.S. Constitution went into effect, which states that it's the job of Congress to determine a standard measurement system. Several famous people debated the issue, including the current president, George Washington, and the future president, John Quincy Adams. They decided they wanted to continue trading with the British people so they adopted the Imperial system to maintain a standard between the two countries.
During this time, the metric system was being established in France, but Britain had yet to adopt it. So although using the metric system was discussed, the Founding Fathers decided on the Imperial system. The metric system was finalized in France in June, 1799, just 16 years after the end of the American Revolution.
The metric system spread through Europe as France conquered other lands. When France took over a new city or country, they would require the people living there to use the metric system. And sometimes France required other countries to use the metric system in treaties. By the mid-1800s much of Europe, Latin America, Russia, Japan, and China had adopted the metric system.
I have a thinking question for you: If the rest of the world is beginning to use the metric system and the United States is using the Imperial system, what problems do you think they may have experienced? (If students struggle to realize that trade and the economy would be negatively affected, we remind them of why a standard unit of measurement was created 800 years ago.)
Many industries in both Britain and the United States knew they were going to have a problem selling their goods if they didn't also begin using the metric system. Throughout the 1900s, many industries in both countries began adopting the metric system. For example, in the United States the chemical, automobile, electronic, and power industries adopted the metric system.
Here's a second thinking question: Why is it important for you to learn both the Imperial and metric systems? We give students time to talk with their learning partners first and then call on volunteers. Correct answers may include “Some of the industries in the U.S. use the metric system while other industries use the Imperial system” and “Although we live in the U.S. where the Imperial system is the official measuring system, we may work for a company whose customer base is located outside of the U.S.”
After discussing their answers, we continue our story. “In 1965, Britain officially adopted the metric system but the United States never did. Here's another thinking question for you: What objects in the U.S. would have to be changed if the U.S. Congress officially adopted the metric system? Talk to your learning partner first and then I'll call on volunteers.” Students often list items such as road signs, cookbooks, and rulers. Then we ask, “Knowing that all of these objects in the entire United States would have to be replaced, why do you think the U.S. hasn't adopted the metric system?” We then have a discussion about who would have to pay for all of the changes. We honor every student's answer because there is no correct or incorrect answer to this question.
Now that students know the history of both systems of measurement and why they need to learn both of them, we begin teaching about measurement.
Converting in the Imperial System
We recognize that conversions within the Imperial system and metric system (and between the two systems) can be accomplished using online calculators. However, the NGSS, Common Core State Standards, and National Council of Teachers of Mathematics (NCTM) state that students need to develop an understanding of measuring units and their relationships, in addition to the ability to apply both systems to real-world situations (NCTM, 2015). In other words, the purpose of teaching measurement is to teach students how units are related to each other so they have a conceptual understanding of a measurement. This knowledge will help them to problem solve when they are required to perform measurements as adults, such as altering a recipe, designing the landscape in their backyard, or building a birdhouse.
To teach students how to convert within the Imperial system, we have them complete Figure 11.13: Practice Measuring Your Friends and Their Things. Each student receives a copy of the worksheet and various measuring tools such as a ruler, measuring tape, yardstick, electric scale, triple-beam balance, measuring spoons, and measuring cups. Students work in pairs to measure their partner's height and belongings. In the case that a partner doesn't own one of the items on the list, we provide our belongings.
The first measuring problem is done for them so we discuss this problem as an example of what they should do to convert measurements. As students are working in their pairs, we walk around to ensure they are using the measuring tools correctly, including rounding to the nearest tenth as the instructions require, and are completing the math conversions accurately.
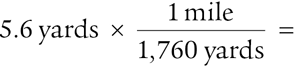
Students often struggle to know when to multiply and when to divide. We simplify this process by telling students that they will always multiply. They do have to determine if they are going to put the conversion in the numerator or the denominator. To help them, we provide the hint that if they are converting to a larger unit (1 mile is longer than 1 yard), they need to put the conversion in the denominator. Here is an example:
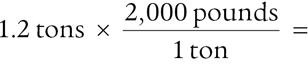
And vice versa: if they are converting to a smaller unit (1 pound is less than 1 ton), they need to put the conversion in the numerator. Here is an example:
We explain that by doing it this way, the beginning units of measurement cancel out (yards and tons based on the above examples), leaving only the new units (miles and pounds).
Once the class completes the activity, we review the answers together. The answer key is provided in Figure 11.14. Students volunteer with their partner to come to the board and write out how they found their answer. Then we challenge students to create three conversion math problems: volume, mass, and distance. They must create an answer key, too. The NGSS require students to learn about volume, mass, and distance prior to fourth grade (NGSS, 2013e). However, if students don't recall this background knowledge (or didn't attend schools that implemented the NGSS), we remind them that volume is how much space a substance occupies, mass is an object's weight on Earth (or how much matter an object contains), and distance is the measurement between two objects.
Each group is then randomly paired with another group. They switch math problems and grade each other's work. Next, groups are randomly matched again. We continue having them practice until the majority of the class can work the problems on their own without much help from us or their partners.
Converting in the Metric System
When we introduce the metric system to students, we begin by showing them how it uses a base of 10. We teach students the prefixes of kilo- through milli- because these are the most commonly used. However, there are larger and smaller prefixes, such as mega- and giga- that are larger than the kilo- prefix, and micro- and nano- that are smaller than the milli- prefix. Students naturally learn these larger and smaller prefixes as they advance through math and science classes, which can be easily learned when they have the background knowledge of the kilo- through milli- prefixes.
We begin by telling students there is only one base unit for distance (meter), one base unit for volume (liter), and one base unit for mass (gram). Then we explain how these bases can get bigger or smaller by adding a prefix. We write the prefix and the base meter on the board in the shape of a ladder so that the smallest prefix is at the bottom of the ladder and the largest prefix is at the top. Figure 11.15: Metric System Ladder is an example.
In our experience, many students use the mnemonic, “King Henry Died By Drinking Chocolate Milk” to remember the order of the prefixes. However, we've had two negative experiences with this phrase. First, students sometimes believe that it's a historical fact that chocolate milk killed King Henry! Second, students can't use this phrase to differentiate between deka- and deci- because they both begin with the letter D.
When we introduce the prefixes, we teach “King Henry Died By Drinking Chocolate Milk,” but then explain that it's not historically accurate. We also tell students that the first D word should begin with the letters da because that will help them remember that deka is first and is abbreviated da. We challenge each student to rewrite the mnemonic, giving them the responsibility of correcting the two problems that exist with the original mnemonic. We've found that students are more likely to remember the prefixes and their order when they develop their own mnemonic. An example of a student-created mnemonic is “Kangaroos Hop Daringly Because Dingos Chase Mammals.”
After everyone has written their mnemonic, we explain that you multiply by 10 for every step down the ladder. For example, if you want to convert 9 kilometers to hectometers, that requires one step down so you multiply by 10 one time, which results in 90 hectometers. And when you begin with 9 km and want to convert to dekameters, that is two steps down the ladder so you multiply by 10 two times, resulting in 900 dekameters.
Students practice these conversions by completing Part 1 of Figure 11.16: Converting Within the Metric System. Each student receives a copy of the worksheet and is assigned a learning partner. They begin by drawing their ladder at the top of the worksheet.
We instruct them to add the abbreviation for each unit of measurement and the prefixes so that their ladders look like Figure 11.17: Metric System Ladder and Abbreviations.
In our experience, students make two common errors. We draw their attention to these errors so they can avoid making them. Here are the two errors:
- Capitalization: many students don't follow the capitalization rules when they write their unit of measurement abbreviations. We point out that all of the abbreviations need to be lower case except the abbreviation for liter, which is the capital L. Scientists use the capital L to avoid confusion with the number 1 (one). That being said, yes, in the field of science, we usually abbreviate ‘liters’ with a lower case L when there is a prefix, such as milli- or deci-.
- Confusion with the abbreviations of lower case m: the abbreviation for meter is lower case m and the abbreviation for the prefix milli- is also lower case m. Many students confuse these two because they are identical. We point out that the abbreviation for milli- is never going to be by itself. It will always be paired with one of the three bases and will always appear first (mg, ml, and mm). The abbreviation for meter may be by itself, but if it is paired, it will always be the last letter (km, hm, dam, dm, cm, and mm). We also explain to students that when the two m's are combined (mm), it stands for millimeter.
In Part 1 of Figure 11.16, the first problem is already completed for them. We walk the class through the steps for completing the problem. Then, learning partners work together to solve the remaining problems in Part 1. We walk around the room, helping students who are struggling. Once everyone is done with Part 1, students change learning partners to compare answers. If any of their answers are different, they both rework the problem to determine the correct answer. We then provide the correct answers for all of the problems and ask if students have any questions.
Part 2 of Figure 11.16 requires students to move up the ladder. We ask students what the opposite of multiplication is. When they answer “division,” we explain that we are going the opposite direction on the ladder (up), so we must do the opposite of multiplication (division). This means we must divide by 10. We return to Figure 11.16 and do the first problem as a class. We then repeat the process that we performed with Part 1.
As students work these types of conversion problems, some may find mathematical shortcuts. Before moving on to Part 3, we stop the class and ask if anyone is doing the math differently. We ask these students to share their shortcuts with the class. One popular variation is to multiply (or divide) all of the steps first and then do the conversion. Here is an example:
Converting 3 km to m requires three steps down the ladder. Students first multiply 10 × 10 × 10 to get 1,000 and then multiply 3 and 1,000, which equals 3,000 m.
Another mathematical shortcut is to move the decimal point instead of multiplying and dividing. We explain that when we move down the ladder, we move the decimal point to the right every time we take a step down, and when we move up the ladder, we move the decimal point to the left every time we take a step up. Here is an example:
Converting 85 km to hm requires one step down the ladder. We remind students that when there is no decimal point in a number, it's at the end of the number, like a period goes at the end of a sentence. We draw the decimal point so that it looks like this: “85.” Then we move the decimal point one time to the right and fill in the empty place with a 0 (zero) so that the answer is 850 hm.
Here is another example:
Converting 620 ml to dal requires four steps up the ladder. We remind students that when there is no decimal point in a number, it's at the end of the number. We draw the decimal point so that it looks like this: “620.” Then we move the decimal point four times to the left and fill in the empty place with a 0 (zero) so that the answer is 0.0620 dal. We like this example because it shows students how to add decimals to the front of a number but also gives us an opportunity to explain that 0.0620 dal and .0620 (without the preceding zero) and 0.062 (without the last zero) are the same number. We instruct them to always include the preceding number because this is how professional mathematicians and scientists write numbers.
As we work through Part 3 of Figure 11.16, which includes a mixture of conversions that move up and down the ladder, we announce to students that they should use the mathematical method they find the easiest to use. Students are again paired with a learning partner, we walk around to help struggling students, and when everyone is done, students work with a new partner to compare and discuss their answers. Afterwards, we provide the answers and ask if students have any questions or if we should do any of the problems on the board. The answer key can be found in Figure 11.18: Converting Within the Metric System—Answer Key.
As a closing activity, students complete three stations in the classroom. We give each student a copy of Figure 11.19: Metric System Measuring Challenge and instruct them to draw their ladder on the top of the paper. We remind them to add their abbreviations.
The first station is located at their desk and is completed with a learning partner. Station 1 requires students to answer four thinking questions. Students first discuss with their learning partner how to solve the problems. As students are working, we walk around the room. If students are struggling, we do not give them the answer but instead we ask guiding questions, such as, “How can you use the metric system ladder to solve these problems?” Once they think of a solution, they complete the work to find the answers and then move to Station 2.
Station 2 requires some prep work on our part. Prior to the activity, we measure the length of 10 items and randomly line them up on the edge of a table. Items we've measured include a chocolate Easter bunny, candy dispenser, pencil, pencil sharpener, and toy cell phone. See Figure 11.20: Example of 10 Items to Be Measured for a picture of the items on the edge of a table as an example of how to set up Station 2.
When students arrive at Station 2, the directions tell them they may not touch or measure the items but they must determine each item's length. There is only one solution to the challenge and students must figure out what it is. The solution at Station 2 requires students to first convert the 10 measurements into the same unit. It doesn't make a difference which unit they choose; for example, they can convert them all into kilometers, meters, or decimeters. Then, finding the smallest item on the table, they assign it the smallest length. The second smallest item on the table is assigned the second smallest length, and so on until all 10 items have been assigned a specific length.
When they complete Station 2, they move to Station 3, which is where the teacher is located. To ensure we are monitoring the class for on-task behavior, we place ourselves in the room so that we have full view of Stations 1 and 2. When students approach us, we ask them to explain how they solved the problems in both stations. Then we check their answers. We circle incorrect answers and instruct students to rework those problems and to return to us when they are done, at which time we check their answers again. This continues until everyone has the correct answers. The answer key can be found in Figure 11.21: Metric System Measuring Challenge—Answer Key.
Converting Between the Metric and Imperial Systems
We begin by telling infamous stories about conversions between the metric and Imperial systems that went very badly. For example, in 1983, an Air Canada plane was developed using the metric system, the first of its kind. The refueling process hadn't yet been converted to the metric system, causing too little fuel for the plane. Approximately half-way through its flight, the airplane ran out of gas. Luckily, the pilots were able to land the plane safely and avoided all fatalities (Witkin, 1983).
Another story occurred in 1999 when NASA lost an orbiter in space because a contracted engineering team used the Imperial measurement system while NASA used the metric system. The orbiter was supposed to land on Mars but instead is probably orbiting the sun (Lloyd, 1999).
Once students understand why it's necessary to learn how to convert correctly between the two measurement systems, we ask them to share with us an item from their backpack that can be measured. A common example is a bottle of water, which has an Imperial measurement of 16.9 fluid ounces and a metric measurement of 500 ml. As students share, we ask, “Which is greater—16.9 fluid ounces or 500 ml?” Students answer that they are the same.
We explain that the purpose of today's lesson is to learn how to convert a measurement in one system to an equivalent measurement in the other system. Each student receives a copy of Figure 11.22: Metric and Imperial System Internet Search Lab, which requires students to read online articles that include one of the two systems, for example, the length and mass of the longest snakes on Earth. When technology is limited, we print the articles and provide hard copies to the students.
We work on the first problem as a class. We model how to complete the problem using the conversion table at the top of the worksheet. As students work through the Internet lab, we walk around to help those who are struggling. We check the correctness of their answers as they work. If they have an incorrect answer, we bring it to their attention and ask them to work the problem again. We watch them work the problem so if they make an error, we can easily identify where they are struggling and help them to correct it.
Students most often become confused when they are trying to determine if they will multiply or divide by the conversion. We simplify this by telling students that they will always multiply. They are responsible for determining if they are going to put the conversion in the numerator or the denominator. To help them, we provide the hint that the unit of measurement they began with goes in the denominator and the unit of measurement they want to end up with goes in the numerator. This “cancels out” the old unit and leaves only the new unit.
The answer key is available in Figure 11.23: Metric and Imperial System Internet Search Lab—Answer Key.
Table 11.4: Topics That Can Integrate Measurement into the Four NGSS Disciplines lists lesson plan ideas of how measurement can be purposefully integrated into the four NGSS disciplines.
Table 11.4 Topics That Can Integrate Measurement into the Four NGSS Disciplines
| NGSS discipline | Measurement lesson plan |
| Earth Sciences | Measure the rate of erosion as the incline changes |
| Earth Sciences | Measure porosity and permeability of different soil profiles |
| Physical Sciences | Measure the change of volume of a gas as its temperature increases and decreases |
| Physical Sciences | Measure the force exerted on objects of different masses using spring scales |
| Life Sciences | Measure the change in the mass of an object that underwent osmosis |
| Life Sciences | Measure rate of reaction with and without catalysts |
| Engineering, Technology, and Applications of Science | Calculate the pounds per square inch as the number of standard atmospheres and pascals |
| Engineering, Technology, and Applications of Science | Calculate the dimensionless quantity of the drag force of a turbine placed in the ocean to create tidal energy |
CELEBRATING PI DAY
The world celebrates Pi Day on March 14. Sometimes Pi Day lands on a weekend or while a school is on break. When this occurs, we celebrate Pi Day the school day prior to March 14.
We allow our students to bring in circle-shaped snacks to share with the class, such as pizza, donuts, cookies, and blueberries. We caution teachers to check with their administration prior to allowing food into the classroom because some districts have policies regarding what food is allowed, if any.
When teaching elementary students, we use lessons offered at www.piday.org, which is the official Pi Day website and offers K-12 lesson plans, focusing on algebra 1 & 2, geometry, and pre-calculus at the high school level. See the Technology Connections section for additional resources to celebrate Pi Day, including lesson plans for K-12 grade students.
However, when we work with seventh to twelfth grade students, we use our own lesson plan. The Common Core Math Standards require that beginning in the seventh grade, students learn how to calculate the circumference and area of a circle, which is why we use this lesson with students who are no younger than seventh grade.
We were inspired years ago when we realized how little students know about spreadsheet software applications, such as Microsoft Excel. The following lesson can be accomplished using Microsoft Excel, Apple Numbers, or Google Sheets; however, we use Microsoft Excel because it's considered by many to be the most flexible, and hence the most preferred, of the three software options (Hattersley, 2016). We provide links for online tutorials that teach how to use Apple Numbers and Google Sheets in the Technology Connections section for those teachers who don't have access to Microsoft Excel.
While students are sharing and eating their snacks for their Pi Day celebration, we use pi to determine the surface area and volume of several celestial objects. Students use Microsoft Excel as a calculator. We've been able to adapt the lesson plan when we work in schools that don't offer the Excel software. We allow students to use scientific or graphing calculators because the numbers they are going to calculate are too large for a regular calculator. However, scientific and graphing calculators only have the display capabilities for 10 digits, and the largest number in this lesson has 26 digits. Therefore, students need to know how to convert numbers into scientific notation in order to use calculators instead of spreadsheet software.
Setting Up Excel
Before beginning the lesson (which assumes that each pair of students has access to a computer or laptop), students must first format the cells on their spreadsheet. We instruct them to open Excel and follow along as we also set up our computers, which are projected on a screen that all students can view. Here are the instructions we read as we format our cells and instruct students to format theirs:
- Go to the top left corner of the Excel spreadsheet and click on the little gray triangle as shown in Figure 11.24. This will highlight and select all of the cells in the spreadsheet. See Figure 11.24 for a screenshot that shows where the little gray triangle can be found.
- Right-click anywhere on the spreadsheet so that a pop-up box appears.
- Choose the Format Cells option.
- Under Category, choose the option Number and set the decimal places to a value of 2, as shown in Figure 11.25.
- Click OK.
Teaching Excel Vocabulary
Students must also know some vocabulary before we can begin. We explain the difference between a row (the cells that are going from left to right) and a column (cells that are going up and down). Rows are titled with numbers and columns are titled with letters. A visual is provided in Figure 11.26.
When we talk about a cell, we call it by its name, which is the column first, followed by the row. As an example, the first cell in Figure 11.26 is called A1. The cell below A1 is A2 and the cell to its right is B1.
To ensure students understand how cell nomenclature works, we randomly highlight a cell on our screen that is projected for all of them to see. We ask students for the cell's name. We do this for three or four cells to provide practice because the cell names will be used when they use Excel as a calculator.
Modeling How to Use Excel as a Calculator
Students are paired with a learning partner. Each group of two receives a copy of Figure 11.27: Celebrating Pi Day in the Sky. One of the students in the pair is the scribe and is responsible for documenting the answers onto the worksheet. The other student is the computer programmer who works with Excel. To ensure learning partners have an equal experience, we instruct students to switch roles when they are halfway through the activity.
We model how to set up the spreadsheet so that students can keep track of each cell's meaning. In cell A1, we type “Celestial Object.” Then we type “sun,” “earth,” and “moon” into cells A2, A3, and A4, respectively.
In cell B1 we type “Diameter,” C1 “Divided by 2,” and D “Equals Radius.” See Figure 11.28 for a picture.
Then we model how to use the cells as a calculator. We type the diameter of the sun into cell B2. Note that the diameter is provided to students in Figure 11.27. Then we type “2” into cell C2. We want the math answer of the sun's radius to appear in D2. To do so, we tell students to first type an equal sign (=) and then the math equation they want Excel to complete (B2/2) so that D2 has “=B2/2” typed into it. Students then hit the enter key and Excel automatically completes the math problem, placing the answer into D2. The final product will look like Figure 11.28.
Students now follow the same logic to calculate the Earth's and moon's radii. We walk around the room, helping students. There are a few common errors students may make at this point.
- Students will forget to include an equal sign (=) first.
- Students will use B2 and C2 in their formula instead of B3 and C2 for Earth's radius.
- If a student's answer is given in scientific format, such as 6.2E+07, this indicates that their cells are not formatted correctly. When this happens, we help them one-on-one to execute the steps that are outlined in the section Setting Up Excel. This corrects the problem immediately.
- Students will often hit the enter key and their answer will result in a collection of hashtags (#). Excel does this when the information inside the cell is too long to display. To correct this, the cell needs to be widened. The easiest way to accomplish this is to go to the top of the spreadsheet and place the cursor on the line that separates two columns. Left-click on that line and drag it to the right to make the column wider. Figure 11.29 includes two screenshots depicting before the fix and afterwards.
To easily see what a student has typed into a cell, click on the cell and look just above the C column for the formula bar. Figure 11.30 is a screenshot for when we click on cell D2, whose equation is in the formula bar. Equations can be altered in the individual cells or in the formula bar, whichever the user prefers. We find it easier to use the formula bar when we are troubleshooting student work. Figure 11.30 includes a screenshot of the formula bar.
Once the students are done calculating the radii, we model how to calculate the sun's surface area. We first set up the spreadsheet so that all data is labeled. We walk students step-by-step to create a second section that, when complete, looks like the screenshot in Figure 11.31.
Here is the step-by-step process:
- Type the title “Celestial Object Surface Area” into cell G1.
- Type the titles “sun,” “earth,” and “moon” into cells G2, G3, and G4, respectively.
- Type “4” into cells H1 (this is the title of the column) and H2 (this is the 4 from the surface area calculation that is provided to students in Figure 11.27).
- Type the titles “Multiplied by Radius Squared” into cell I1, “Pi” into cell J1, and “Equals Surface Area” into cell K1.
- Type the equation “=H2*D2*D2” into cell I2. The cell D2 has the sun's radius. By multiplying it by itself, its square has been calculated, and by multiplying the product by H3, it's been quadrupled as the formula requires.
- Type the value of pi (3.14) into cell J2.
- Type the formula “=I2*J2” to multiply the product in cell I2 with Pi.
Students begin working with their partners to calculate the surface area for the Earth and moon. As students are working, we walk around the room to answer questions, check their answers for accuracy, and help them troubleshoot problems. The answer key is provided in Figure 11.32: Celebrating Pi Day in the Sky—Answer Key.
Students most commonly become frustrated because they don't know the keyboard symbols for multiplication (*) or division (/). We usually have to teach that the (*) means to multiply, and we type it by holding down the “shift” key while at the same time hitting the “8” key. And to type the division slash we use the key that has the question mark on it (no “shift” key is necessary).
The common non-technological error students make is writing the incorrect unit. We've noticed they write km (kilometers) as the unit for every answer on their paper. These students haven't yet made the connection that because the radius was squared to calculate the surface area, the unit of measurement should also be squared (km2). And they struggle to make the connection that the volume required the radius to be cubed so the units of measurement should be cubed too (km3). We point this out to students as we walk around, verifying their answers.
Making Graphs in Excel
Students who finish early are provided with Figure 11.33: Making Graphs in Excel. They use the step-by-step procedures to make a bar graph in Excel depicting the relative volumes of each celestial object. They draw the graph onto their copy of Figure 11.27: Celebrating Pi Day in the Sky. Figure 11.34 is an example of what a final graph should look like.
Students usually display a feeling of dismay when they don't see data for the Earth or moon. When they ask what they've done incorrectly, we explain that their graph's data is correct and ask them to brainstorm an explanation for the lack of data for the Earth and moon. They write their answer next to the graph on their worksheet. If they struggle to figure out that the Earth's and moon's volumes are too small to be seen at this scale, we ask them the guiding question, “How many moons and Earths fit inside the sun?”
DIFFERENTIATION FOR DIVERSE LEARNERS
In addition to the individual differentiation we offer with each resource, we also find there are a few general strategies that can help students with learning challenges. One way to help these students with both graphing and dimensional analysis is by providing them with a multiplication chart. This can help students identify intervals as they are making graphs and allow them to quickly multiply numbers if calculators are not available. Another strategy for these students is to ensure they are paired with a peer “buddy.” Peer buddies who work well with these students assist them in a way that is less obtrusive and can be more comfortable for the student.
ELLs may need support when analyzing and interpreting graphs. To assist them, we provide sentence frames. For example, when students are analyzing Figure 11.8: Year vs. Number of Deer and Wolves, we provide them with the following stems:
- When the number of deer was 12, the number of wolves was _____________.
- In the year _______________, the number of deer was 14 and the number of wolves was 6.
- From 2011 to 2015, the deer population ________________ (increased/decreased).
Student Handouts and Examples
- Figure 11.1: Bar Graph Example for Teaching Graphing to Fourth Grade Students (Student Handout)
- Figure 11.2: Line Graph Example for Teaching Graphing to Fifth Grade and Beyond (Student Handout)
- Figure 11.3: Example of Graphing Pretest (Student Handout)
- Figure 11.4: Example of Graphing Pretest—Answer Key
- Figure 11.5: Which Type of Graph Should I Use? (Student Handout)
- Figure 11.6: Which Type of Graph Should I Use?—Answer Key
- Figure 11.7: Temperature vs. Number of Escherichia coli Colonies
- Figure 11.8: Year vs. Number of Deer and Wolves
- Figure 11.9: Wildlife Strike Data Analysis and Interpretation (Student Handout)
- Figure 11.10: Wildlife Strike Data Analysis and Interpretation—Answer Key
- Figure 11.11: Dimensional Analysis Practice (Student Handout)
- Figure 11.12: Dimensional Analysis Practice—Answer Key
- Figure 11.13: Practice Measuring Your Friends and Their Things (Student Handout)
- Figure 11.14: Practice Measuring Your Friends and Their Things—Answer Key
- Figure 11.15: Metric System Ladder
- Figure 11.16: Converting Within the Metric System (Student Handout)
- Figure 11.17: Metric System Ladder and Abbreviations
- Figure 11.18: Converting Within the Metric System—Answer Key
- Figure 11.19: Metric System Measuring Challenge (Student Handout)
- Figure 11.20: Example of 10 Items to Be Measured
- Figure 11.21: Metric System Measuring Challenge—Answer Key
- Figure 11.22: Metric and Imperial System Internet Search Lab (Student Handout)
- Figure 11.23: Metric and Imperial System Internet Search Lab—Answer Key
- Figure 11.24: Excel—Selecting All Cells in a Spreadsheet
- Figure 11.25: Excel—Pop-up Box
- Figure 11.26: Excel—Rows vs. Columns
- Figure 11.27: Celebrating Pi Day in the Sky (Student Handout)
- Figure 11.28: Excel—Calculating Radius
- Figure 11.29: Excel—Screenshots of Before and After Cell Fix
- Figure 11.30: Excel—Screenshot of the Formula Bar
- Figure 11.31: Excel—The Sun's Surface Area
- Figure 11.32: Celebrating Pi Day in the Sky—Answer Key
- Figure 11.33: Making Graphs in Excel (Student Handout)
- Figure 11.34: Excel—Graph for Celebrating Pi Day in the Sky
What Could Go Wrong?
We've found that when many elementary students use math in science class, they can transition easily from math to science. However, when middle and high school students are required to leverage their math knowledge in our science classes, we find that many struggle to bridge what they've learned in math to solve problems in science. We remind them at the beginning of a math activity that the math we will be using was previously taught in their math classes and reassure them that although we are science teachers, we are indeed good mathematicians so they can ask us for help.
In our experience, some students feel very comfortable declaring that they aren't good at math. When we hear a student say they aren't good at math, we address it immediately. First, we remind them that there is value in having a growth mindset (see Chapter 6: Strategies for Teaching the Engineering Process for resources that help students to develop a growth mindset). We also reassure them that they have a lot of support in our class, such as their learning partners and us. And, then, we follow through by checking in with these students first and often. When they accomplish a mathematical task, we provide positive feedback, such as a high five or verbal praise.
When students measure objects, we've noted that regardless of grade level, most students will round to the nearest whole number if not instructed otherwise. We instruct them in written and oral directions what decimal they need to measure to, such as the nearest 10th or 100th.
Technology Connections
Purchasing graph paper can be an expensive investment. To provide all students with graph paper but without spending a lot of funds, we print free graph paper from the Internet. Our favorite resources are Free Online Graph Paper (http://print-graph-paper.com) and Math-Aids.Com (http://www.math-aids.com/Graph_Paper).
There are 31 Pi Day lesson plans at the We Are Teachers website, which can be found here: WeAreTeachers (https://www.weareteachers.com/pi-day-activities). These are intended mostly for elementary and middle school students. High school Pi Day lesson plans can be found at (http://web.archive.org/web/20080118155630/http://www.nvnet.org/nvhs/dept/math/pi/trig.html) for Trigonometry classes and at (http://web.archive.org/web/20080118155620/http://www.nvnet.org/nvhs/dept/math/pi/algebraii.html) for Algebra II classes. The School District of Philadelphia offers lesson plans for K-12 students at “Pi Day Activities” (http://web.archive.org/web/20070317225901/http://www.phila.k12.pa.us/offices/curriculum/supports/CIGuides/PiDayActivities2006Final(2).pdf).
There are many online tutorials for using Apple Numbers as a calculator, such as Nabtech's “Formulas and Functions in Apple Numbers 2017” (https://www.youtube.com/watch?v=qwojJ0VJyv0) and MacMost's “9 Mac Calculator Tricks” (https://macmost.com/9-mac-calculator-tricks.html). There are also plenty of tutorials for using Google Sheets as a calculator, such as GCF Global's “Google Sheets - Creating Simple Formulas” (https://edu.gcfglobal.org/en/googlespreadsheets/creating-simple-formulas/1) and Flipped Classroom Tutorials' “15 Functions in Google Sheets You NEED to Know” (https://www.youtube.com/watch?v=mRHlvRRERgs).
Figures
Figure 11.1 Bar Graph Example for Teaching Graphing to Fourth Grade Students (Student Handout)
Figure 11.2 Line Graph Example for Teaching Graphing to Fifth Grade and Beyond (Student Handout)
Figure 11.3 Example of Graphing Pretest (Student Handout)
Figure 11.4 Example of Graphing Pretest—Answer Key
Figure 11.5 Which Type of Graph Should I Use? (Student Handout)
Figure 11.6 Which Type of Graph Should I Use?—Answer Key

Figure 11.7 Temperature vs. Number of Escherichia coli Colonies

Figure 11.8 Year vs. Number of Deer and Wolves
Figure 11.9 Wildlife Strike Data Analysis and Interpretation (Student Handout)
Figure 11.10 Wildlife Strike Data Analysis and Interpretation—Answer Key
Figure 11.11 Dimensional Analysis Practice (Student Handout)
Figure 11.12 Dimensional Analysis Practice—Answer Key
Figure 11.13 Practice Measuring Your Friends and Their Things (Student Handout)
Figure 11.14 Practice Measuring Your Friends and Their Things—Answer Key

Figure 11.15 Metric System Ladder
Figure 11.16 Converting Within the Metric System (Student Handout)

Figure 11.17 Metric System Ladder and Abbreviations
Figure 11.18 Converting Within the Metric System—Answer Key
Figure 11.19 Metric System Measuring Challenge (Student Handout)

Figure 11.20 Example of 10 Items to be Measured
Figure 11.21 Metric System Measuring Challenge—Answer Key
Figure 11.22 Metric and Imperial System Internet Search Lab (Student Handout)
Figure 11.23 Metric and Imperial System Internet Search Lab—Answer Key

Figure 11.24 Excel—Selecting All Cells in a Spreadsheet

Figure 11.25 Excel—Pop-up Box

Figure 11.26 Excel—Rows vs. Columns
Figure 11.27 Celebrating Pi Day in the Sky (Student Handout)
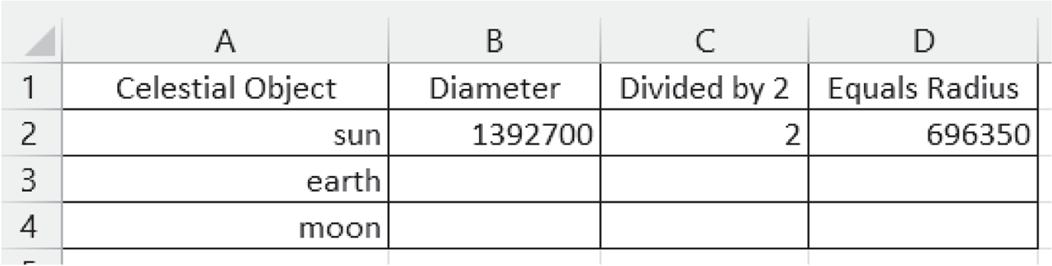
Figure 11.28 Excel—Calculating Radius

Figure 11.29 Excel—Screenshots of Before and After Cell Fix

Figure 11.30 Excel—Screenshot of the Formula Bar

Figure 11.31 Excel—The Sun's Surface Area
Figure 11.32 Celebrating Pi Day in the Sky—Answer Key
Figure 11.33 Making Graphs in Excel (Student Handout)

Figure 11.34 Excel—Graph for Celebrating Pi Day in the Sky