
 Fig 14.1 The Sun, the Moon and the tide. a) Full moon spring tide: gravitational fields in a straight line. b) New moon spring tide: gravitational fields still lined up. c) Half moon neap tide: gravitational fields in opposition to one another.
14 TIDAL HEIGHTS
Depending upon where you are sailing, the importance of tides varies from the critical to being of no significance at all. Navigators in the Bristol Channel, or the waters around south-west Normandy and the Channel Islands, are constrained by tide ranges of powerhouse proportions. These rise to 35 ft (11 m) at St Malo, and even up to 45 ft (13 m) at the approaches to Bristol. Sailors in the West Indies take little notice of the movements of the tides, even though the US authorities produce tide tables for San Juan in Puerto Rico. A glance at these shows why – the range rarely exceeds 1 ft (0.3 m).
Even quite small ranges of tide can generate strong currents. You don’t have to be in the Bay of Fundy (55 ft/17 m range of tide) or the Bristol Channel to be carried backwards by the stream. Poole Harbour has one of the lowest ranges in the central English Channel area, yet I have seen 5 knots on my log while moored to a buoy near its narrow entrance on a full spring ebb.
People unused to tides tend to be intimidated by statistics like these, and by the unfriendly appearance of the average tide table. There is no need for this. ‘Don’t panic’ is my advice. There really isn’t a lot to it. For convenience the subject divides neatly into two sections which you can absorb one at a time. These are the height of the tide and the rate and direction of its stream. We’ll deal with heights first, but before we do, let’s take a brief glance at what is making it all happen.
Tides are produced by the force of gravity. Both Sun and Moon exert a pull on the Earth. Indeed, the Moon’s pull is so strong that we and our satellite revolve around one another on a central gravitational axis. The Moon puts in most of the distance work, but its one-month orbit throws the Earth into an oscillation nonetheless. As the Earth turns ‘underneath’ the Moon, the waters on its face are dragged bodily towards the satellite, forming a ‘bump’ in the sea that is tiny in global terms but crucial to the mariner. Because of the Earth’s own oscillation there is also an equal and opposite centrifugal force that creates a similar bump in the sea on the other side of the globe. The two bumps remain almost stationary, being governed by the Moon’s one-month orbit (actually their position advances by about 40 minutes per day), and the Earth turns inside them. This means that an observer standing on the shore at a given spot will be passed by both bumps in a 24-hour period. Thus, there are two tides per day.
The Sun’s gravitational pull is also working on the water, and when this lines up with either a Moon-generated bump or its centrifugal equivalent, the force from the Sun will be additive, producing a bigger than average tide. This happens at full moon and ‘dark’ moon. At half moon, either waxing or waning, the gravities of the two bodies are working against one another. The tides, in consequence, are smaller than average at those times.
In fact, as with all terrestrial effects generated by astronomical forces, a time lapse attaches to the days when the largest and smallest tides occur. In this case it is a couple of days or so, which means that the large tides – known as springs – turn up a day or two after full moon and at new moon; ditto with the small tides, or neaps (Fig 14.1).
Notice that the term ‘spring’ has nothing to do with the season of the year. The biggest tides of all occur in spring and autumn because the equinoctial sun is nearest the equator and exerts its best pull, so perhaps this is the origin of the nomenclature. I can offer no better explanation.
Fig 14.1 The Sun, the Moon and the tide. a) Full moon spring tide: gravitational fields in a straight line. b) New moon spring tide: gravitational fields still lined up. c) Half moon neap tide: gravitational fields in opposition to one another.
 TIDE TABLES
Every maritime nation of any importance works up its own tidal predictions through its observatories. These are made generally available as official publications, but most yachtsmen prefer to acquire them as part of the universally useful nautical almanac, or from the electronic data delivered readily by most chart plotters. If you intend never to sail far from your home port, you may be able to manage with the local tide table booklet issued by most major harbour authorities for a handful of small change. If you are away cruising, you must have an up-to-date almanac.
Tide tables are almost entirely self-explanatory. They normally give the times of High and Low Water at the port in question for every day through out the year. Heights are given in feet or metres above Chart Datum which, as we have seen in Chapter 12, is also the level of Lowest Astronomical Tide.
TIMES
Times are worthy of careful attention. If you are operating within a single country these rarely present any practical problems, but if you change from one state to the next, you must remember to reset your watch or you may be an hour out in your workings. British Admiralty Tide Tables, or their almanac equivalent, give UK waters times in Universal Time (UT) as it is now officially known. Foreign ports are stated in the relevant Zone Time. Always remember to add 1 hour to the tabulated figures in summer for day light saving time (BST) if you are working with the Admiralty Tide Tables or any of the almanacs derived from these. The English-speaking almanacs even give you the date to change your watch, but they don’t advise about continental summer times. That remains a personal initiative test. Some tables issued by local authorities do this job for you and give all tides in local clock time. For example, the Eldridge Tide and Pilot on the US East Coast conveniently serves up Eastern Standard Time or Daylight Time as appropriate. Times can be something of a nightmare when dealing with the data flashing up at the touch of a button on an electronic plotter. Often, these do not specify obviously what ‘time’ they are using. You may find the answer deep in the menus, but even this is not always successful. If all else fails, note the time given, then check it against an almanac. This will show if the electronic time is BST, UT or, in foreign waters, just what the devil it really is. Having made this comparison once, it should hold good for other ports within the same time zone.
SECONDARY PORTS
You wouldn’t be able to find shelf space for an almanac with a page for the tides of every port. There are too many of them. The problem is solved by the system known as secondary ports. Any lesser port is referred to in terms of how its tidal activity differs in detail from the nearest standard port for which the tides are fully tabulated.
Different almanacs give secondary-port data in various ways, but it is normally set out with time differences in one column and height difference in the next. In some areas time and height differences remain constant for a given secondary port. Often, however, they vary depending upon whether the tide in question is a spring or a neap. Differences for such ports are given in relation to MHWS (Mean High Water Springs), MHWN (Neaps), etc.
In the greater tides of northern Europe, the tidal difference is given in relation not only to springs and neaps, but also in terms of the actual zone time of High and Low Water. This sounds complicated, but if you study the illustration for differences on London Bridge (Fig 14.2), you’ll see that it is really quite straightforward.
In practice, one rarely ends up with a time that is given in the secondary-port information. Normally you want one somewhere in between. In these cases you must interpolate. Thus, if you want the time difference at Tilbury and the time is 0600 (Fig 14.2), you are three hours into the six (0300 to 0900) given at the top of the column. The difference for Tilbury at 0300 is –55 minutes. At 0900 it is –40 minutes. The difference therefore diminishes by 15 minutes in 6 hours, which is 2½ minutes per hour. By 0600 it will have dropped by 2½ minutes multiplied by 3, or 7½ minutes, so the difference at 0600 is going to be –47½ minutes. The negative sign shows that this is subtracted from the London Bridge time to find the time at Tilbury.

Fig 14.2 Secondary port tidal differences from Reeds Nautical Almanac.
Height differences require similar interpolation in these cases. They are given at springs and neaps, but often you are halfway in between. European tables give mean spring and neap ranges on the tidal curves. If you can’t find these, or there aren’t any, it is easy enough to run your fingers down a month’s tidal heights and see how yours compares with the highest and the lowest. Once you have this information, commonsense can be applied to the problem and a surprisingly accurate answer produced in your head.
I work my secondary port tides by using a simple box diagram that in the days of my freedom I sketched on the back of a cigarette packet. Now that I’ve kicked the habit, I use a handy ring-bound pad that lives under my chart table. The diagram for the calculation above looks like this: let’s say HW London Bridge is 0600 and 6.5 m, with LW London Bridge at 1500 and 0.9 m.
| HW London Bridge (from standard port tide table) | 0600 UT | 6.5 m (half spring/neap) |
| Difference Tilbury (from almanac via interpolation data) | − 00 47.5 mins (Say 48 mins) | −0.6 m (from almanac) |
| WH Tilbury | 0512 UT | 5.9 m |
The issue of interpolating secondary ports causes more grief than any other item in the Yachtmaster syllabus. It is possible to deal with the matter graphically, and a good method is described in Reeds Nautical Almanac. In all honesty, it really is easier in practice to do it as described here, but there is no substitute for repetition. The answer is to set yourself problems to solve. This is not hard to arrange – I just produced one about Tilbury. It can provide a diverting way of passing a winter’s evening when a power cut snuffs out the TV, when conversation drags, and you are down to your last candle.
| SKIPPER’S TIPS | Different authorities, different methods |
| In the USA, but not in Canada, height differences are stated as a ratio. The figure (expressed as a decimal, e.g. 0.91) is multiplied into the tidal height given for the standard port and that is your secondary-port figure for the day. The system is simple to operate and works well for the moderate tides generally experienced. The French operate on a system of ‘coefficients’, whereby the number 20 represents a tiny neap, 45 a mean neap, 70 a mean tide, 95 a mean spring and 120, the highest number you’re likely to see, an exceptional spring. | |
TIDAL DEFINITIONS
Fig 14.3 shows the various heights of tide that must be defined. Most of these have been discussed already, but tidal range has not. The range of a tide is the amount by which that particular tide rises or falls between High Water and Low Water. The height of tide at any given moment, including High and Low Water, is the level by which the tide is standing above Chart Datum. The rise of tide is the level that the tide has reached above the Low Water figure for that particular tide.
Elevations and clearances
The charted vertical clearance of a bridge or power cable is now the clearance under it at Highest Astronomical Tide (HAT). The charted elevation of a light remains as it has always been, its height above MHWS (note that this is measured from the lantern itself, not the top of the structure). Lest this apparent complication sound like needless humbug from the cartographer, consider this: the big benefit of working depths from a charted value of lowest astronomical tide is that, even with a worst-case tidal height scenario, the negligent navigator has only to be able to read the numbers and relate them to his draught to stay safe. He will rarely find less water than the chart advertises. Running bridge heights from HAT delivers the same benefit. Even a muppet who can read and knows his air draught is thus guaranteed to avoid disappointment. The careful navigator near the limit of clearance may work the numbers and find he can scrape under. HAT figures are given at the bottom of the standard port tide tables for UK and continental ports.

Fig 14.3 Tidal definitions.
Tidal definitions
| CHART DATUM | Usually, the level of lowest Astronomical tide – the soundings on the chart are all referred to this. |
| LAT | Lowest Astronomical Tide. The lowest level to which tide heights will fall due to the effects of the Sun and Moon. |
| HAT | Highest Astronomical Tide. The highest level to which tide heights will rise due to the effects of the Sun and Moon. |
| TIDAL HEIGHT | The height at a specific moment by which the tide exceeds (or very occasionally falls below) the charted depth. |
| LOW WATER | The lowest level of a particular tide on a particular day. On a chart drawn to LAT in the UK, this will almost invariably be a positive figure, which must be added to a charted depth to find depth of water. |
| HIGH WATER | The highest level of a particular tide on a particular day. The value must be added to a charted depth to find depth of water. |
| TIDAL RANGE | The difference between High and Low Water for a specific tide. |
| MEAN LEVEL | Not used in practice very much, this is the average level of the sea’s surface. |
| NEAP TIDE | Small tides occurring twice a month, shortly following half moon. |
| MHWN/MLWN | Mean High Water Neaps/Mean Low Water Neaps. Essentially, this means the respective heights of an average neap tide. |
| SPRING TIDE | Big tides occurring twice a month shortly after full moon and new moon. |
| MHWS/MLWS | Mean High Water Springs/Mean Low Water Springs. Essentially, this means the respective heights of an average spring tide. |
| RISE OF TIDE | The height of tide at a specific moment above the Low Water of the same tide. |
| CHARTED DEPTH | The sounded depth below Chart Datum. |
| DRYING HEIGHT | The height above chart datum to which a half-tide object or area ‘dries’ above LAT. |
| DEPTH OF WATER | Height of tide plus charted depth. |
| HEIGHT OF AN OBJECT | The height above Mean High Water Springs. |
| CLEARANCE UNDER AN OBJECT | The clearance height beneath a suspended obstruction or bridge at HAT. |
INTERMEDIATE TIDAL HEIGHTS
Tide tables give only figures for High and Low Water, whether they be for standard ports or as modified by you to give data for secondary ports. This information is of primary value, but you often need to know what is going on at times between High and Low Water.
Electronic chart plotters
One of the hidden glories of the electronic chart plotter is that a good processor will access tidal height information layered into the chart. Typically, a letter ‘T’ appears on the chart at a secondary or standard port for which data is available. All you need do is hover the cursor over this and you will be shown some sort of interrogation box asking if you want to see the real business. Answer ‘yes’ and, bingo! Up comes a graph, complete with all you need to know about today’s tides, yesterday’s, tomorrow’s or any other day. Often, you can move your cursor around within the box to read out any specific time or height. The accuracy of these predictions is generally not bad, but often the graphs used are a simple sine wave such as would hold good for a port where the rule of twelfths works. In many places, this is less than perfect, so a more sophisticated graph is required. The Admiralty Tide Tables and the better almanacs supply these. Some plotters do too, but not all, so make sure you know how good yours is if you intend to rely on it. Amazingly, a really cheap mobile phone plotter App from a firm like Navionics offers full tidal height data as part of the package. Tablets do the same, in more detail. When compared with the miseries of students as late as the 1990s, sweating over a hot chart table and a secondary port calculation in the topsy-turvy world of the Solent, we live in enlightened times indeed.
PC programs
PCs and associated plotters can do everything the hardware plotter can, although a dedicated tide program will be required. Admiralty Total Tide does the lot.
These features appear to solve the age-old issue of working out the tides. Indeed they do but, as noted above, the answers they give may vary from the biblical truth according to their Lordships of the Admiralty. On my boat, I carry a bulkhead plotter and a PC plotter, plus Apps for my mobile phone and iPad. All operate independently with their own batteries and GPS receivers, so I’m well covered unless the GPS satellites stop sending signals to Planet Earth or someone jams them, yet in a typical tidal situation, all will give slightly different answers to the same question. For this reason, if for no other, we must still be masters of the actual calculations for those times when we need to be absolutely certain. And of course, as always, there remains the not unlikely contingency that the gismo will fail. Show me the experienced sailor who doesn’t carry a lead line in case his echo sounder goes off pop…
The Rule of Twelfths
The ideal theoretical tide rises and falls following the even mathematical progression known as a sine wave. What this really means is that starting from its Low Water level, the tide rises by 
 of its range in the first hour of the six that it will be coming up. In the second hour it speeds up, bringing in
 and giving a total now of
 . The third and fourth hours, the central hours of the tide, show rises each, with the rate easing away to and in the last two hours. The falling tide behaves in a similar manner. The duration of High Water and Low Water is in theory momentary, though in reality little detectable change occurs for 15 minutes on either side of the time in the tables. This is known as the stand.
In many places the tide conforms to this ideal, and here the Rule of Twelfths can be confidently employed for tide calculations. All you must do to use this is to work out the range of the tide (HW–LW), divide it into 12 equal parts, then decide how many twelfths you actually need. A useful mnemonic is ‘1–2–3–3–2–1’, which describes the number of twelfths rising or falling in their 6-hour sequences. Here is an example of the Rule of Twelfths:
LW 1500 1.0 m
HW 2100 5.8 m
What height of tide is there at 1700 hrs?
Range = 4.8 m (5.8–1.0)

 = 0.4 m (4.8/12)
At 1700, 
 of the range will have risen ( in the first hour,
 in the second).
= 1.2 m
Therefore, at 1700 there will be 1.2 m above the figure given in the tide tables for Low Water (1.0 m). Rise is added to the Low Water figure to find height, so at 1700 the height of tide will be 2.2 m above Chart Datum.
TIDAL CURVES
In the absence of any more accurate method being offered, the Rule of Twelfths can usually be used with moderate success. However, in certain areas (notably the UK, Ireland and Northern Europe generally) the tides do not conform perfectly to the sine wave principle. Sometimes the rising and falling of the waters appear eccentric in the extreme. These places are best served by a graph showing accurately what is going on.
Spring and neap curves
Notice the ‘mean range’ box at the top right-hand corner of Fig 14.4 giving spring and neap ranges, with a firm and a pecked line depicted alongside it. The tide curve with the solid line is the curve for spring tides and that with a pecked line is for neaps. You can ascertain rapidly by inspection whether today’s tide is a spring or a neap, or somewhere near. If it falls between the two, you will use an imaginary curve between the solid and the pecked ones. This can easily be done by estimation to a degree of accuracy more than adequate for safe navigation. No interpolation sums are required in practice.
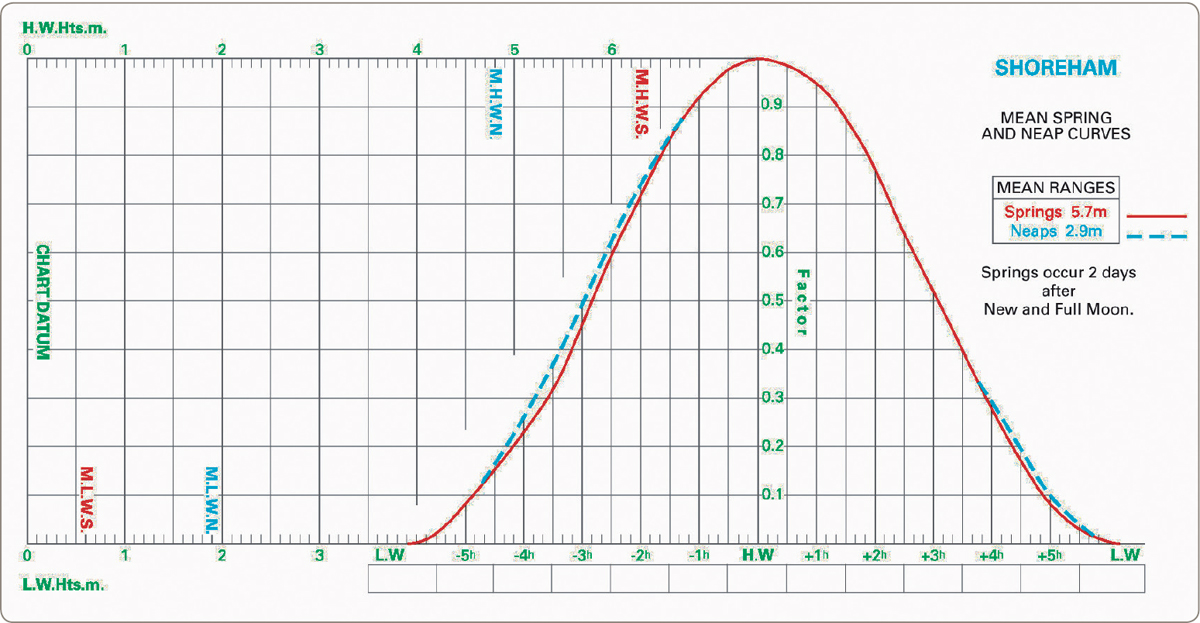
Fig 14.4 Tidal height curve for Shoreham (extract taken from Reeds Nautical Almanac).
The ‘set-up’
Whatever question you want to answer (‘question’, you notice – there are no more ‘problems’), you start out by preparing the diagram for use on a given tide. Suppose we are setting it up for a day when the figures for the morning tide were as follows:
| HW | 5.6 m | 0700 | |
| LW | 1.6 m | 1310 | range 4.0 m |
Notice straightaway that today’s range, 4.0 m, falls between the spring range of 5.7 m and the neap range of 2.9 m given in the mean range box. Now in order to ‘set up’ the diagram, draw a line (the ‘line of the day’) joining the height of Low Water at the bottom of the left-hand part of the picture with High Water at the top, and fill in the boxes beneath the curves for High Water and any other times of interest as in Fig 14.5. Once you have done this, you are ready to ask your question, which will probably be one of the following:
 At what time will there be a given height of tide?
What will be the height of tide at a given time?
Let us take the first of these and be more specific: At what time on that particular morning will the tide at Shoreham have fallen to a height of 2.8 m above Chart Datum? To find the answer you draw three straight lines, as illustrated in Fig 14.5.
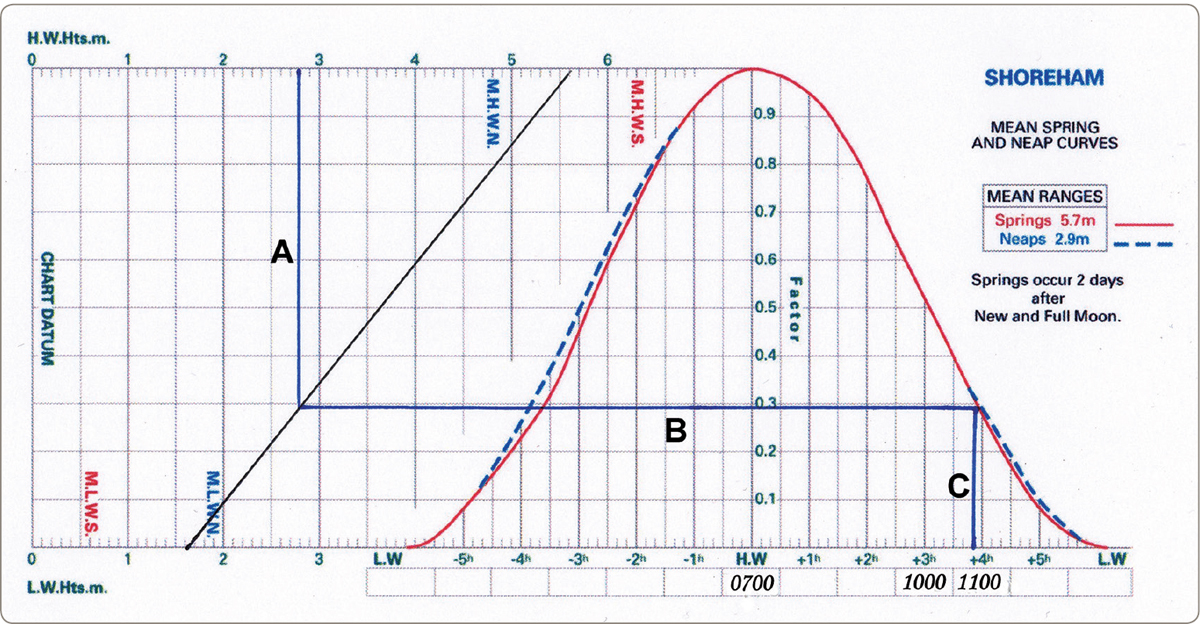
Fig 14.5 Tidal height curve in typical use (extract taken from Reeds Nautical Almanac).
1Starting at 2.8 m at the top of the diagram, drop a perpendicular A to your line of the day.
2From where line A joins the line of the day, draw a line B across to the ‘tide falling’ side of the tide curve.
3From where line B joins the tide falling curve, drop line C straight down to the time boxes, and there is the answer to your question. In this case, 1050.
The second question could be posed for the purposes of our example by simply reversing the first, in which case it would sound like this: To what height will the tide at Shoreham have fallen by about 1050?
To answer this, start (having ‘set up’ the picture as in Fig 14.5) at the other end with the time of 1050. From here you raise a perpendicular (line C) to the tide curve. Then draw in line B across the ‘line of the day’ and from there move up vertically (line A) to the height of tide scale and read off the height of 2.8 m.
You’ll have noticed by now that you don’t have to do anything to the figure for tide height that you extract from the diagram in answer to the second question. The figure of 2.8 m is the actual height of water above Chart Datum; that is all there is to it. Going in the other way, as in the first question, just enter the height of water required above any relevant charted depth and the diagram gives the time figure you are after. Once the time of day is set up, Low Water does not enter your calculations.
It takes a minute or two to set up the diagram and thereafter you can find the height of tide within seconds.
Secondary ports
The one small fly that remains kicking feebly in the ointment is the old favourite of secondary ports. The system for working these out probably can’t be improved upon. Just work out the time and height of High or Low Water for your secondary port and enter it on the diagram exactly as above.
If you are operating in the areas adjacent to and including the Solent you’ll find that, because of the tidal anomalies caused by the Isle of Wight, several extra sets of curves are supplied for the various groups of secondary ports. The only difference between these and all the other curves in the book is that, instead of working either side of High Water, they use Low Water as their point of reference. The time of Low Water is easier to predict in this region than that of the ‘double High’.
NON-ASTRONOMICAL FACTORS IN TIDE MOVEMENTS
Published tidal predictions assume a standard barometric pressure and no weather effects. Standard pressure varies between 1017 mb (English Channel in July) and 1007 (Wick in January). If in doubt, use 1013. 34 millibars over and above the standard figure will depress both High and Low Waters by 1 ft (0.3 m). If the pressure drops to 979 (34 below 1013), an extra foot of tide can be expected. It’s more common to find 17 mb delivering 0.15 m, but it’s all pro rata.
Many areas experience their own local tide surges generated by local or distant weather conditions. I remember being told to shift my berth in St Petersburg because of a westerly gale way down the Gulf of Finland. They were right, too. A couple of hours later the dock was under water.
These surges are predictable to those who know the area, but they are rarely written down. Ask, if you are in doubt, but as a general rule, prolonged onshore winds push the tide up, and a protracted period with the wind offshore will drain it away.

Tidal height calculations are a piece of cake with a modern chart plotter or a tablet App like this one.
THE ESSENCE OF A TIDAL HEIGHT QUESTION
Because of the various elements of problems involving intermediate tidal height, it is easy to lose your head over them. Then the brain switches off and you decide to sail somewhere else where there is more water, which is a shame. You might also fail your ticket if you were under examination.
The way to succeed is to extract the vital question from the whole situation. As we have noted, this usually boils down to one of two: ‘What time will there be so much water?’ or ‘How much water can I expect at a given time?’ You may want to know what time you can safely cross a bar with a predetermined clearance under your keel, or you may need reassurance that you’ll still be afloat alongside a drying wall after lunch. Possibly you are feeling your way through the fog near the top of a big tide and you want to reduce your sounded depth to a charted depth in order to relate it to your possible position on the chart. Another favourite query is how to find a suitable depth in which to anchor at half tide.
All these are best solved by means of a diagram. You can scratch a quick drawing on the back of a serviette in no time at all, yet the process will do wonders for your clarity of mind. Once you know what it is you are looking for, you have only a simple tidal curve question or a Rule of Twelfths calculation to perform. Figs 14.6 and 14.7 illustrate the points.

Fig 14.6 Height to cross a bar. Tidal height required = draught + clearance + drying height.

Fig 14.7 Finding charted depth.
Anchoring depths
Theoretically, questions arising over anchoring depths are no different from any other tidal height calculation. In practice, however, they are so simple that people tend to make them more complex than they need to.
When anchoring, one is after the maximum available shelter. This is usually so close to the shore that the chart is of little more than overall interest. It cannot indicate soundings every few boat’s lengths all round the anchorage, but it will depict the lie of the bottom, how steeply it shelves, what the holding ground may be, and whether there are rocks or other dangers to be avoided. This is the process, once you have determined the general area in which to anchor:
Fill in the tidal curve for the day, bearing in mind that the next Low Water is the critical factor.
Decide the depth you will need to remain safely afloat at Low Water. This will be the yacht’s draught + the clearance selected.
Consult the tidal curve and see how much the tide will fall between now and the next Low Water, even if the tide is rising at the moment. There is no need even to consider such matters as charted depth.
Add this figure to the depth you have decided upon for Low Water.
Sail in until you find this depth, then anchor. That is all there is to it.
Having ascertained the depth at which to drop the hook, now is the time to decide how much cable to lay.
Sort out a suitable scope (usually about three times the depth of water for chain cable), then determine what the total depth will be at the next High Water.
Consult the tidal curve to see how much the tide will rise by the time of High Water, even if the level is falling when you arrive.
Add this figure to your anchoring depth. The total will be the depth at High Water.
Alternatively, you could simply add the range of the tide (High Water minus Low Water) to the depth you aim to be floating in at Low Water (Draught+Clearance). The result should confirm your other calculation.

Tides run to great heights and depths in Northern Europe. Working with them enables a seaman to take advantage of all sorts of apparently inaccessible places. This is the approach to Morlaix in North Brittany. At High Water there is depth in plenty for any but the most extravagant superyacht to enter the lock. Photo: J Webb
USING TIDAL HEIGHT CALCULATIONS SAFELY
However slick you become at solving tide problems, you should never forget that all your results are based on predictions, not established facts. Calculate your figures as accurately as you can, then allow a margin for error. This might be affected by a sensible assessment of the potential risks involved in grounding and upon how near to the truth conditions suggest your calculation is likely to be.
Only a fool believes his calculation to the ‘nth’ decimal point, but being over-timid is a sign of inexperience. Often I have heard failed Yachtmaster candidates blustering, ‘I believe in playing safe at all times,’ in circumstances where to sail over a drying patch with a calculated metre under the keel in calm water and a rising tide would be as ‘safe’ as staying at home.
To start with, take it easy, then slowly begin to sail your boat into areas where the chart says ‘not enough water’, but the tide tables say there is. Be prudent at all times, then the nasty surprise you will surely receive one day will not be dangerous. Remember the ancient adage: ‘If you’ve never run aground, you’re not trying hard enough.’
| SKIPPER’S TIPS | A time to ground . . . |
| Take no liberties with a falling tide, especially near a lee shore. A rocky bottom will demand a greater clearance than a sandy one if you think things may be tight. You may even be prepared to chance running ashore on soft mud with a rising tide so long as the tide is rising and the wind will blow you off. | |

All calculations are based on predictions. A tide gauge tells the truth on the day.
*Note that unlike the more typical six-hourly rate of change between the varying differences, in this case the difference in time between the LW figures given in the secondary port for Tilbury indicates only five hours – between 1100 and 1600. This pair is chosen here because our time is 1500, which falls between them. The total difference figure of 25 minutes (between 50 minutes and 1 hour 15 minutes) is therefore divided by 5, not 6. Had the time of LW fallen between 1600 and 2300, the total time for the change to take effect would have been 7 hours, so the 25 minutes would have been divided by 7 to find the hourly rate of change.
**A decision must be made whether to go for 0 m or 0.1 m. You could say, ‘Because we’re halfway between springs and neaps it’s going to be 0.05’ and nobody would quarrel with you, but one must work within reasonably practical parameters. I have chosen to apply no LW height difference because that will err on the safe side of less water. Any decisions regarding how to use the information will, if need be, reflect this marginal inaccuracy. On most occasions it will be entirely irrelevant.