 LATITUDE, LONGITUDE AND THE GLOBE
12 CHARTS, PUBLICATIONS AND CHART TABLE TOOLS
In whatever form it comes – electronically on a screen, or paper on a table – a nautical chart is a two-dimensional depiction of the three-dimensional reality that is the watery face of the globe.
LATITUDE, LONGITUDE AND THE GLOBE
In order to define positions, the Earth’s surface is divided up by the universally accepted convention of latitude and longitude. Lines of latitude run parallel to one another, and to the Equator, so that in a chart oriented in the usual ‘north-up’ mode, they run across the sheet. As their organisation might imply, they are often known as ‘parallels of latitude’. The vertical, or north/south, division of the world is marked out by lines known as ‘meridians of longitude’. Meridians converge at the Poles and so are never truly parallel to one another.
Both sets of lines are labelled as degrees of a circle. The parallels number from 0° at the Equator to 90° at each Pole, and to avoid any possible ambiguity, a line of latitude is always named either ‘north’ or ‘south’. Meridians number from 0° to 180° ‘east’ and ‘west’ from Greenwich in the United Kingdom. Over the years, politicians from countries outside ‘dear old Blighty’ have muttered that this is an unacceptable state of affairs, with all its suggestion of imperial superiority. Sailors, however, have chosen to ignore all their hot air. The so-called prime meridian has to be somewhere. Time and longitude are inextricably linked. In the days when these matters were first decided, London was the home of the Royal Greenwich Observatory, which promulgated the best time signal in the world. This suited most people well enough, and so it has remained. The longitude of Greenwich is 0°. So, incidentally, is Accra in Ghana, but no one seems to mind about that. Cape Cod sits at 70° West, while Hong Kong lies in 114° East.
The arrangements for longitude work well unless you are navigating the far reaches of the central Pacific. Here, despite Kipling’s assurances that never the twain shall meet, East and West come together at the 180th meridian. This raises the question of what day it is, and the social trials generated by such a ponderous matter have caused the establishment of the rather wavy International Date Line, but I am delighted to advise that such paradoxes are no concern of the coastal and offshore navigator.
A position on the Earth is defined two-dimensionally by a latitude and a longitude. Thus, the lat/long position of the mid-Atlantic island of Madeira is given as approximately 33°N 17°W.
The degrees of both latitude and longitude are subdivided into 60 minutes and thereafter into decimal increments. It is a matter of the greatest convenience that one minute of latitude is equal to one nautical mile. In land measurements this is the equivalent of 2,027 yds, or very nearly 2 km. One-tenth of a nautical mile is known as a cable, because that was the length of a standard cable-laid hemp hawser in the fighting ships of the wooden wall navies.
Because the meridians converge at the Poles, the distance separating them varies from one parallel to the next. At the Equator, a minute of longitude is equal to a nautical mile, but if you took a stroll around the South Pole, keeping your hand on it as you went, you could cover 45° in a single stride. As a result, if you want to measure distance on a chart, always refer to the latitude scale on the side, not the longitude at top or bottom.
CHART PROJECTIONS
Certain compromises must be made by the cartographer to deal with the inconvenience caused by the world being more or less round, while the chart is necessarily flat. Generally, these arrangements distort the coastline. On world-sized maps, they can give rise to gross misconceptions about the relative size of land masses in different latitudes, but, as we shall see, there are useful trade-offs for these drawbacks.
The Mercator projection is the most usual chart form for coastal and offshore work. It is characterised by the meridians of longitude appearing as parallel equidistant lines, while the parallels of latitude are drawn further apart towards the Poles.
The overriding advantage of the Mercator projection for the navigator is that angles on the globe are the same as those measured on the chart. This means that if you draw a straight line on the chart joining your destination with your point of departure, the course to steer will not vary from one end to the other. Such a line is called a rhumb line. It forms the basis of the navigator’s assumptions for all short-and medium-range passages.
If you extend a rhumb line on a Mercator chart so that it transverses an ocean in an east-west direction, you will be doing yourself no favours because the shortest distance between two points on a sphere is a great circle. This is a section of a line that, if extrapolated round the sphere and used as a cutting edge, would carve it into two exact halves. Because the meridians are all arcing in towards the Pole, a great circle course cuts each one at a slightly different angle. On a crossing from Newfoundland to the English Channel this results in a course to steer that starts off as 069° and finishes at 093°. If you draw the rhumb line course on a Mercator chart it will be straight, but it will be a greater distance in miles because it will not be a great circle.
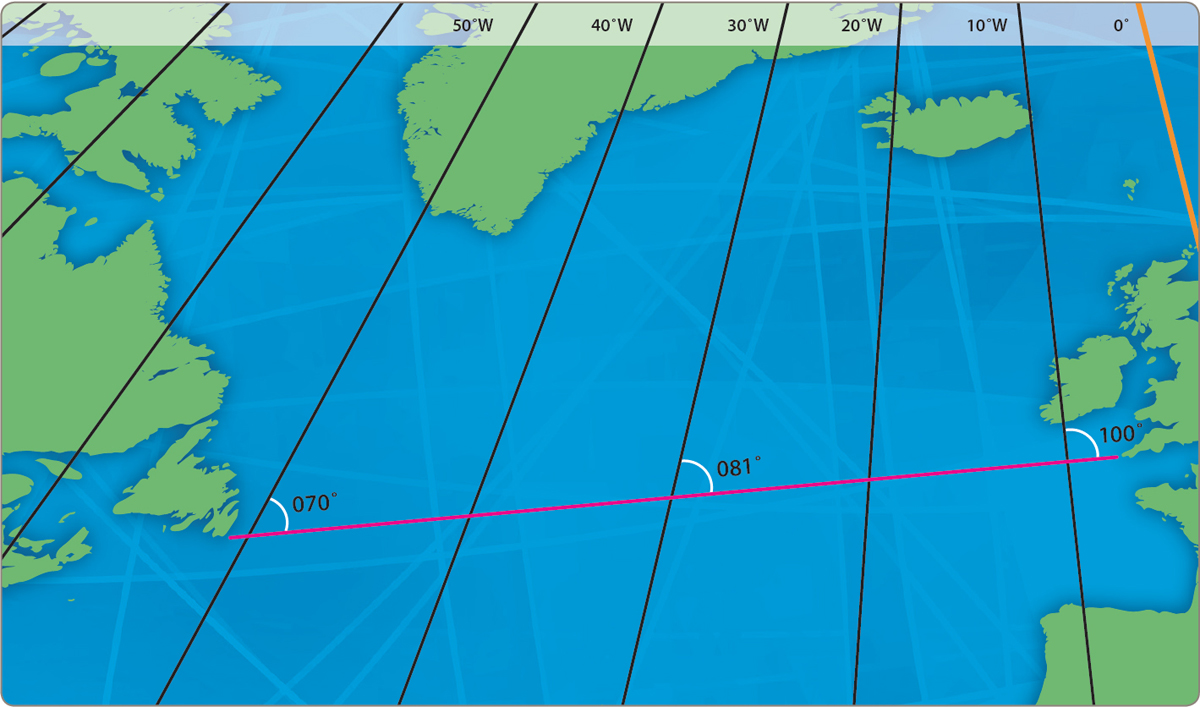
 Fig 12.1 A Gnomonic chart – a straight line on this chart is a great circle. Note how this one cuts the meridians at varying angles.
By now you are probably thinking of throwing this book in the waste-paper basket because it is boring, incomprehensible, and irrelevant. Don’t do it. You need not concern yourself at all with this business of projections if it doesn’t interest you. Most of your charts will be Mercator anyway. Just remember that if you ever need to work out a great circle course you should procure a Gnomonic chart of the ocean concerned. This magic item shows the meridians converging. If you draw a straight line on it, your line is a great circle. All you need to do now is read off the headings at various meridians and alter course accordingly when you get there, if ever you do.
Because Gnomonic charts involve no distortion, they were sometimes used in the past for harbour charts, and may still be found in use. The small scale of harbour charts is such that a heading from one side to the other needs no black trickery to remain straight. For what it’s worth, you know if the chart is Gnomonic not only because it says so, but because it will have a distance scale somewhere, to compensate for the fact that the latitude scale may be unsuitable for this purpose.
| SKIPPER’S TIPS | Mercator projections |
| The important things to remember about projections are that for short and medium-range Mercator charts, minutes of latitude equal sea miles, and that a rhumb line is not only as straight as you can rule it, it is also the shortest distance between two points. If you are using a Mercator chart of all but the smallest area, you’ll note that the size of a degree of latitude varies as you proceed north or south. In that case, use the latitude nearest your own for distance purposes. | |
DIRECTION
Having come up with a way of defining positions, the next major requirement is to translate a line drawn on the chart joining two locations into a means of knowing that your boat is travelling in the direction this dictates.
Wherever you are on the Earth, you will be situated on a meridian of longitude, or one of its subdivisions. If you look directly up it, you will be facing the North Pole. Sight down it, and the South Pole will be ahead. Turning from north to south in a clockwise direction you will traverse 180°; continuing on back to north again is a further 180°. That’s 360° in all, and this is how a course is designated. If your course line crosses the meridians (all parallel, remember, on a Mercator projection) at 30° to the right of north, your course is 030°. Due south is 180°; while anything beyond south in a clockwise direction is a greater figure still, up to 359°, when you are back to north again.
Thus, a course of due west, which is the cardinal point on the left, straight down your parallel of latitude, will be 270°. Such a course is designated 270°True, because it relates to the true North Pole which is at the axis point of the Earth’s rotation.
In practice, you will be steering a compass course. One of nature’s sorrier arrangements is that the magnetic pole to which the compass needle points is considerably displaced from the true pole. It moves with measured tread around the Canadian Arctic. Fortunately, its displacement is tabulated and appears on most charts. If you are working on your chart in degrees ‘true’, you must make the necessary corrections to your final result before giving the helmsman a course to steer, but this is easy to do and will be discussed fully in Chapter 16.
SCALE AND PASSAGE REQUIREMENTS
Charts are issued by all the major maritime nations in scales of every variety the mariner could ask for. Single sheets can cover a whole ocean, or a single small harbour. Large-scale charts contain an amazing amount of detail, while the small-scale offshore chart offers no more than is sufficient to plot your progress on passage.
Charts required for a passage
A passage chart should be used to determine overall strategy and courses to steer. Ideally you should find one that covers the whole trip, because trying to move a course from one to the next is never easy and can lead to errors at sea.
Landfall charts giving enough detail to approach the coast are required for your departure point, your destination, and any other part of your passage that may bring you close enough inshore to need them. If you are unfamiliar with the harbour of your choice, you’ll often need a large-scale harbour chart to see you up to the quay.
Clearly, it would be ideal to carry the fullest set of charts available. In reality, questions of cost and space dictate what will be shipped. Only experience can tell you what you can manage without. If in doubt, take the chart. Not having the one required on the day can involve even the most experienced skipper in inconvenience, or considerable defensive navigation. It may even debar him from a vital port in a storm.

Fig 12.2 A section of British Admiralty Chart No 3298.
CHART SYMBOLS
A great number of forms, symbols and conventions are used on charts. Fortunately, most of the important ones can be deciphered with commonsense. For the ones that cannot, or those with a specific technical meaning, you will have to refer to the information published by the relevant chart-issuing authority. The UK Hydrographic Office (UKHO) sell theirs in a booklet called Chart 5011. You really shouldn’t go to sea without this information. Charts tell you everything from the probable whereabouts of rough water to the material of the seabed. The positions of buoys and lights are noted, together with their flashing characteristics and their colour. Symbols for coastlines, conspicuous hilltops, rocks and off-lying shoals are clearly marked. The depths of the water are denoted by figures known as soundings. All you need is there but you must give yourself access to the symbols.
Soundings and contours
Depths are marked in either metres or, in North America, fathoms and feet, or simply feet. Metres are subdivided into tenths, where necessary; a fathom is equal to 6 ft (1.8 m) and in shallow waters fathoms are subdivided into fathoms and feet.
Because the sea is constantly rising and falling with the tide, some fixed level must be found to which soundings will be referred. This has wisely been decided to be the lowest depth likely to be experienced under any normal circumstances. Tidal height is affected by astronomical phenomena, mainly the relative positions of the Moon, Earth and the Sun (see Chapters 14 and 15); it is also pulled around by meteorological conditions, but to a lesser extent. The former is predictable, the latter is not, beyond a day or two in advance. The depth of water is therefore recorded at the height of the Lowest Astronomical Tide. This level is known as Chart Datum level. You would be unlucky to find significantly less water than that, except in a few exceptional places.
For your convenience, contour lines are often traced along lines of significant soundings of equal depth. This enables you to establish the general lie of the bottom at a glance. The most important depth contour is the drying line. Beyond this are areas that dry out at LAT (Lowest Astronomical Tide). The soundings have a line underneath them thus:  . This indicates that they show drying height above Chart Datum. Drying soundings stop when you reach the real shoreline, which is the contour beyond which the sea will not encroach from purely astronomical influences. In areas of large tidal activity, a low drying height may well be covered for most of the time.
| SKIPPER’S TIPS | Half-tide |
| Most chart authorities mark areas inside the drying line in a different colour to the permanently wet zones. | |
OTHER INFORMATION ON THE CHART
The scale of a chart is shown near the title, as are the units used for soundings (these are normally metres or fathoms, though occasionally they may be in feet). Make sure you take notice of this or you’ll have some surprises. Always read any ‘cautions’ noted on the chart together with information relating to local regulations.
At the bottom left-hand corner of a chart you will find a note of any corrections that have been made, dated and numbered. The chart may also feature a statement concerning the survey from which it has been drawn. The significance of this is greatest in unfrequented areas. If the survey predates about 1930, it would have been made with lead and line rather than an echo sounder. It is possible that this method will not show up an occasional isolated rock, so you should navigate with caution if the topography indicates that such a feature may be a possibility.
CHART DATUMS
Most charts carry a statement concerning the datum to which they are constructed. This is nothing to do with the Chart Datum for depth soundings referred to opposite. It is a convention concerning the pinpointing of position. Because inaccuracies caused by ignoring it are often much less than a cable’s length (200 yards), it has only become relevant with the arrival of electronic fixing aids.
Numerous datums are used worldwide. The UK was for many years OSGB36. Europe was ED, while much of the US worked to WGS84 (World Geodetic System, 1984). Today, most cartographers are lining up with WGS84. A chart will often state that this is the datum. If it is not, you will generally see Lat/Long correction factors for transferring a position derived from a satellite receiver operating to WGS84 (the general default setting). There may also be a statement about the datum to which the chart is drawn.
There are three ways of dealing with the question of varying datums: the first is to keep your wits about you, check the chart for correction factors and apply them where necessary. The second is to program your GPS to the relevant datum. With a user-friendly set, this is often the easiest option. The third choice is to expect less from your equipment. Even with the datum shifted, GPS often gives far more accuracy than any pre-electronic sailor could have hoped for. The difference is that he expected little, so he was rarely disappointed.
YACHTING CHARTS
In addition to the charts produced by government bodies, many areas of coastline are covered by specialist charts published with yachtsmen in mind. These usually look different from their official counterparts and how you feel about them is a matter of personal taste. They are often, but not always, easy to use, with much additional information. The harbour plans on Imray charts are particularly handy in a small chart library. Some are issued in book form, or in packs dealing with specific areas, offering an inexpensive way of kitting yourself out. In the Scandinavian countries, the USA and others, including parts of Great Britain, official charts are offered for sale packaged like this and priced advantageously. In addition the UKHO and many other countries offer most of their home waters coastal charts as scaled-down ‘small craft editions’ which are cheaper to buy and are conveniently available from most chandlers.
ELECTRONIC CHARTS
Electronic chart plotters, PC navigation programs and tablet / smart-phone programs all use electronic charts. Although many variants exist, these come in two essential formats.
The raster chart is to all intents and purposes a scan of its equivalent paper chart. It usually has the same boundaries. It even features the same serial number. Until recently, raster charts in Britain have been based on UKHO Admiralty charts. Now, a number of companies including Imray offer charts in Raster format, thus widening the choice. Raster charts have one huge advantage for old salts: they look the same as charts have always done. All their information is visible at any one time and no buttons need be pressed on the plotter to unlock further information. As you zoom in and out on a given chart, nothing changes except the size of the image. In other words, what you see is what you get. And what you see is generally all that most people want. The drawback is that unless the chart ‘kit’ is ‘quilted’, which is to say, melded together electronically, you have to decide physically which chart to use and switch from one to another. For many people – myself included – this presents no problems at all. They even prefer it. Others find it a nuisance, but even if the charts are quilted, the processor sometimes makes a decision about changing that fails to please the operator.
In most cases, raster charts must be used through the medium of a PC plotter.
Vector charts are built up by vectoring the survey data from which paper charts are drawn. The process is quite different from the raster scan and resulting charts don’t look at all like the paper version created from the same information. Zoom well out on a vector chart and you’ll find no detail at all, save perhaps the line of the coast. On a good one, however, you can zoom in until you have accessed every scrap of data available anywhere within the scope of that particular chart chip or CD. The process is seamless and, unless you choose to show the borders of an individual chart, with most programs you will not even be aware of them. Vector charts are used exclusively on ‘hardware’ chart plotters (dedicated units), for which they are issued on small cards or some other form of electronic storage device, but they are also available on CD-ROM for some PC-based plotter programs.
The main benefit of vector charts is accessibility to all available data, and flexibility about how much of it you choose to show (see ‘Electronic chart plotters’, Chapter 19). Much of the information remains embedded until you click on an object and enter a menu, so using the charts is not quite as simple as their raster equivalent. The data is comprehensive, however, and may go beyond the size and nature of a navigation aid all the way to a comprehensive tidal curve for a given port on a given day, any time from the Battle of Hastings until what, for all we know, may post-date Armageddon. The drawbacks are that unless you zoom well in, more details remain hidden than may be convenient, yet when you are zoomed in tight enough to access what you want, the overview is lost.
The marvels offered by these remarkable charts are explored more fully in Chapter 19.
CHART CORRECTIONS
The old saying that ‘rocks don’t move’ is, generally speaking, true enough though sandbanks may shift from one month to the next. Buoys, light houses, oilrigs and all the rest of the paraphernalia that civilisation has brought to the seas are, however, permanently under review. They are frequently moved, added to, and expunged. Keeping British leisure charts up to date is very easy today. All you need do is log on to www.ukho.gov.uk/ProductsandServices/Leisure/Pages/ADMIRALTY-Leisure.aspx. Here you’ll enjoy the remarkable experience of free down loads for all UKHO leisure charts, plus guidance of where to find updates for other cartography.
Unfortunately, to correct a full set of charts systematically and conscientiously is not a realistic proposition for many people. As a second best, if your chart is known to be not the newest available, you should check the important lights and day marks against the current list in your nautical almanac. Reeds Nautical Almanac carries these, as do some of the others. If you find yourself forced into this, you must be aware that it is a poor substitute for a properly corrected chart, and take any measures that seem appropriate to steer on the safe side of danger.

Keep the plot going even if you are surrounded by electronics.
Daily navigation warnings, many of which refer to temporary or permanent alterations in charted information, are broadcast on VHF radio as well as featured in Navtex read-outs.
Many electronic plotter suppliers now offer a correction package as a periodic update for all the charts an individual user has paid for. This service is not universal, so if you are equipping a boat with this gear, the question of chart correction will require consideration. For some systems, corrections are available on disc or as an internet download, removing one of the greatest logistical difficulties from responsible small-craft management.
THE NAUTICAL ALMANAC
If you sail in tidal waters you simply cannot go to sea without one of these. A good almanac is a mine of information on everything to do with seafaring. It covers the tides, the movements of the Sun and Moon, lists of lights, radio aids to navigation, weather forecast information radio stations, first aid, collision regulations in full detail and many other vital subjects. The original Reeds even went so far as to offer a step-by-step guide to childbirth, and if you consider this obscure you would be wrong. A number of cases are on record of babies delivered safely at sea using only this remarkable publication, a pair of scissors and some well-boiled string.
If you are only intending short, day-sailing passages you might get by for a while with just a copy of the local tide tables, but you’d be pushing your luck. Sooner or later a question will crop up for which you have no answer. It’s odds on that the almanac will tell you what to do.
PILOT BOOKS AND SAILING DIRECTIONS
Official pilot books are issued by the chart authorities to augment the information on the charts. Different national charts vary in the form and content, but the UKHO version is probably as useful as any to the English-speaking yachtsman. It gives comprehensive climatological data as well as describing the movements of currents, while the descriptions of the coastline are extremely full. At first reading, Admiralty Pilots appear rather dry, but on better acquaintance one becomes aware of a definitive style, levened occasionally with anecdote. If you have room for a copy, you should carry the relevant volume into areas strange to you.
Yachtsman’s pilots are far more readable than their official counterparts. They are generally well illustrated and they tell you what you want to know, rather than treating you as a fly on the bulkhead of a large warship. All sorts of pilots are available, to suit most tastes and all but the leanest pockets. Paying proper attention to a well-produced example will make a great deal of difference to how you feel as you approach a strange port in a hard blow.
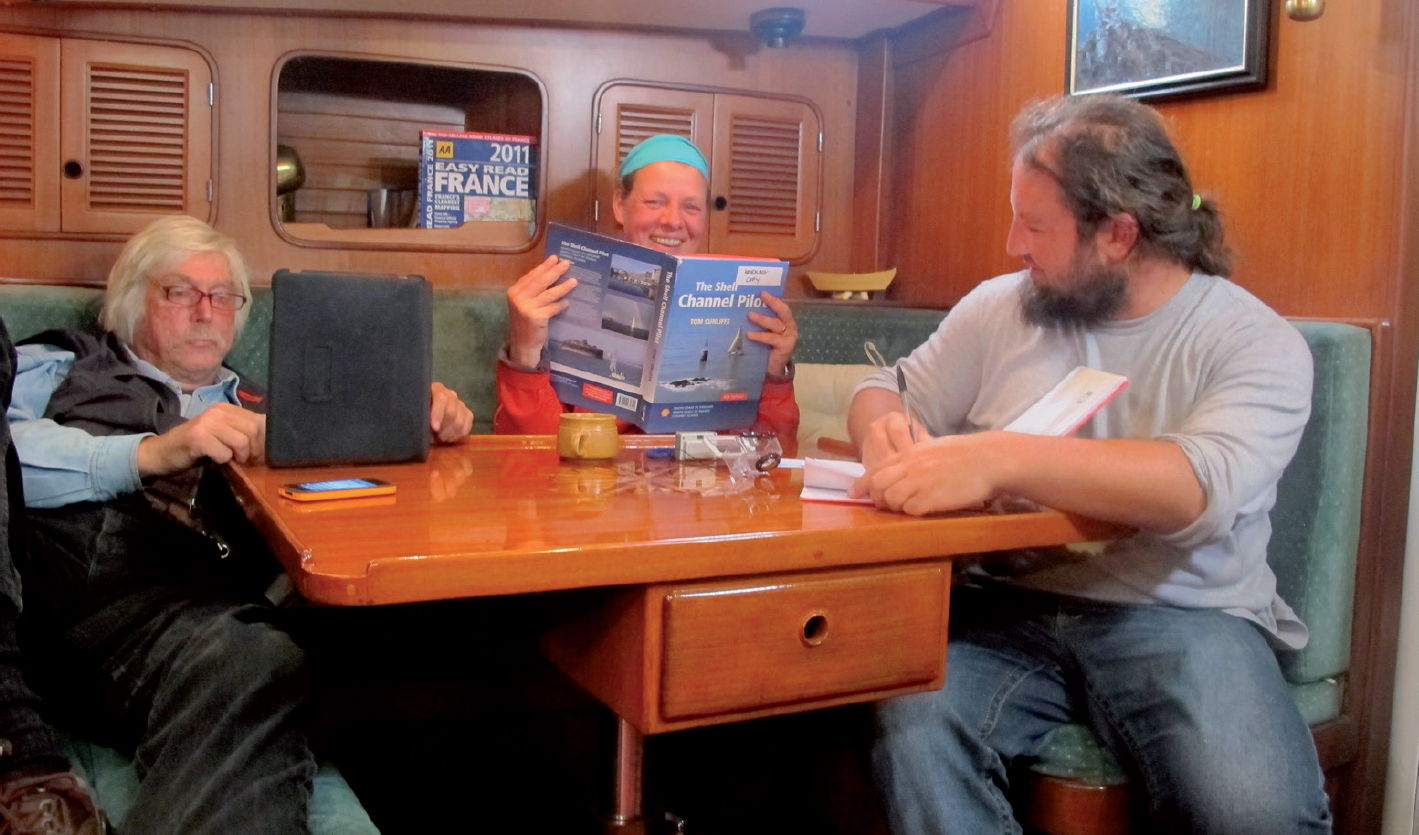
Planning a passage together in the 21st century with PC and notebook, but never forgetting the pilot book. Without this, a plan is like gin without tonic.
Other publications
If you are sailing far afield you may want to ship a list of lights and a list of radio signals. Atlases of tidal streams are available, though the information they contain is mainly duplicated in the almanac. The most convenient answer to these three issues is to buy the Admiralty DVD with Total Tide, List of Radio Signals and List of Lights. It’s not cheap but it’s the best. Generally speaking, officially published paper tide tables have also become largely redundant for the yachtsman as almanacs have improved. Today, it is more important that you have on board the instruction manuals for your electronics, unless of course you have decided to do without all that. Extracting the full benefit from a modern GPS computer is not something the average person can hope to do without the book in front of him. Just remember while you are achieving computer literacy at your chart table that there is a whole world turning in gloriously organic progress up on deck. How many hundred waypoints you can punch in at a time won’t be required knowledge when your inexperienced crew sail you under the bows of a supertanker.
CHART TABLE TOOLS
Dividers are used for comparing the length of a line on a chart, or the distance between two points, with the latitude scale at the side. The one-handed variety (with the loop at the top) is by far the best. While you are at it, buy a long pair, not one of those diminutive affairs that are attractive, but never quite big enough.
Parallel rules transfer lines to and from the compass roses on the chart. The roses are circles clearly marked in 360˚ notation and strategically situated. They usually feature an extra ‘north’ pointer, offset, to indicate the amount and the direction of any magnetic variation from the True North. Somewhere in the compass rose, you will usually find a written statement of variation, which will also advise you of any predicted changes in its value.
The problem with parallel rules on board most yachts is that they are too cumbersome for the confines of the chart table. They frequently fetch up against the fiddle just as they embark upon the last stride of their walk from course to rose. This knocks them out of true and sends you silly with frustration. It may also be the last straw that results in seasickness. The answer is to use a chart protractor. They were called ‘plotters’ until the arrival of the electronic chart plotter, but sadly this has confused the issue and the old name has been usurped by the new technology.
Chart protractors come in various patent forms. Which one you use is up to you, but the European ‘Breton Plotter’ is hard to beat for simplicity, reliability and cheapness. A chart protractor does away with the dynamic aspect of parallel rules. It is placed against a line and its own integral compass rose is orientated so that the heading or bearing can be read off. Some plotters even offer the wherewithal to read out in ‘degrees true’ or ‘degrees magnetic’.
| SKIPPER’S TIPS | Pencils |
| Pencils are a vital part of the navigator’s outfit. By far the best grade to go for is the 2B. These leave a black line that is clear to read and easily rubbed out. Keep them sharp, have a place for them, and condemn any individual who purloins one to a week of head-cleaning fatigues. The same dire retribution should await the villain who wanders away with your nice, soft eraser. | |
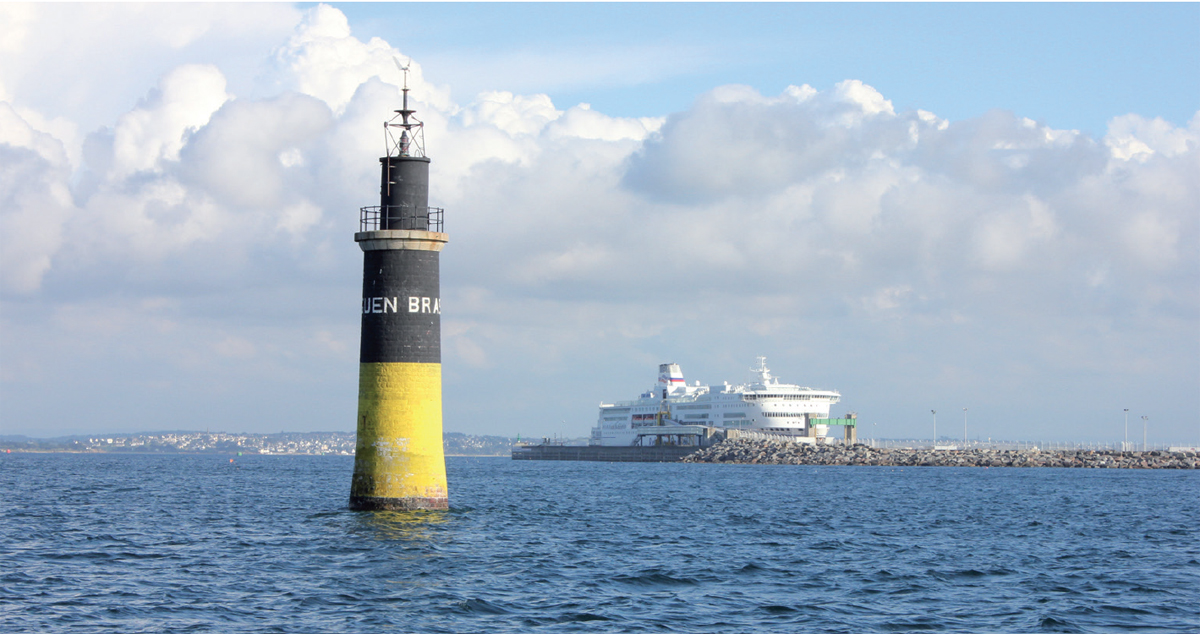
Different countries specialise in their own brand of navigation marks. This fine north cardinal beacon is in Brittany.