 TIDAL GATES
15 TIDAL STREAMS
In areas of strong tidal activity it is absolutely vital that you are aware of what is happening and that you plan to make the most of it if at all possible.
A boat sailing at 5 knots makes a good 8 miles an hour in a fair 3-knot current. With the same current running foul, her net gain drops to 2 miles an hour. If she is beating with a Vmg (Velocity made good to windward) of 3 knots, a similar tide will give her either 6 knots made good or a net gain of zero. Thus it will be seen that it is better by far to beat to windward with a fair tide than to reach against a foul one.
TIDAL GATES
Even in areas where the currents are generally weak, if there is any rise and fall of tide to speak of, places will emerge where the current becomes a significant factor. Where streams along the coast are strong in any case, salient headlands and narrow channels may produce violent currents for the mariner to contend with. Such places are known as tidal gates and it is important to time your arrival at them either for slack water if the sea is known to become dangerously rough, or for the period of fair tide.
In sea areas such as North Brittany, where the current gallops along at 4 knots even well offshore, the whole coast becomes a tidal gate. Fortunately, with such a stream running favourably, a decent boat can make a considerable distance in a fair tide, then anchor up while the stream runs foul. This enables you to take a rest, a meal, a run ashore and be ready for the next fair tide in six hours or so. ‘Tiding’ along like this is good fun, low on stress, and makes for acceptable progress. It is far better for morale than staying at sea and sailing on the spot for a quarter of a day.
Knowing the rate and direction of the tidal stream forms a vital part of cross-tide navigation, but this will be discussed fully in Chapter 22.
| SKIPPER’S TIPS | Deep and shoal water |
| As a general rule, currents flow more strongly in deep water than in shallow, where their movement is impeded by friction with the seabed. Therefore, if you are working up a shoreline against the tide it will pay you to keep well in, if there are no tactical reasons to do otherwise. If you want to win the full benefit of a fair stream, stick to the deep water. | |
TIDE-INDUCED SEA STATES
Wind blowing with the tide tends to flatten the sea, but wind against current chops it up mercilessly. In strong tides and gale conditions, particularly where the stream is whirling around a headland, dangerous seas can be generated. A shrewd observer offshore can tell when the tide has turned merely by noting the shape of the waves. Look for streaks of foam running down the backs of the short, steep seas. This is the sure sign of a weather-going current.
Tide races sometimes occur due to the shape of the land, and these are usually noted on the charts. If potentially dangerous overfalls accompany the race, small clusters of wavy lines will be grouped around the place in question. You should steer well clear of these in all but the most settled weather. Read your pilot book for more details, because such hazards vary in their intensity, but there are known locations of such notoriety that even on a flat calm day you would enter at your peril. One such is the Race at Portland Bill, halfway up the English Channel.
INFORMATION ON TIDAL STREAMS
Tidal stream atlases
The main areas of tidal influence covered by almanacs are featured in tidal stream atlases. The same data are also given in a smaller format in the almanacs themselves. Fig 15.1 is a typical illustration for the Channel Islands. You’ll notice the box stating which hour of the tide it refers to. This one is for three hours before HW Dover and is one of a series of 12, covering the whole period of any tide, from LW through to six hours after HW. The information is self-explanatory except to note that, for clarity, the Admiralty chartlet misses out the decimal points in the numbers describing the neap and spring stream rates found in among the arrows. Thus when you see ‘12.24’, you know it means 1.2 knots at neaps, and 2.4 at springs. The arrows show the direction of the tide, giving an excellent overall picture which can be read at a glance. Tidal stream charts are not only user-friendly, however, they are accurately surveyed so that you can lift the direction of an arrow to your navigation chart if need be by using your plotter.
Computation of intermediate rates
This can, of course, be done by mental interpolation and in practice it generally is. For examination purposes, or when it really matters to be as nearly right as you can be, use the ‘Computation of Rates’ diagram in the tidal stream atlas (here). To get into this, you must first find the range of tide at Dover for the tide in question. Let’s say that today’s is 5.8 m. With this information to hand, check the atlas page for the spring and neap stream rates you want. In this case, the tabulated streams are ‘Neap 1.0, Spring 2.1’. Make a pencil mark for the spring rate on the spring dotted line and vice versa for the neap. Join the two dots with a pencil line. Now enter the table on the left- or right-hand side with the range of tide for Dover you just worked out. Go across from this value until you reach your pencil line, then move up or down vertically and read off the interpolated stream rate at the top or bottom. In this case, mine was 2.0 knots. Hardly worth the trouble? Maybe, but then again, maybe not!

 Fig 15.1 A page extracted from the Admiralty Tidal Stream Atlas for the Channel Islands and adjacent coast of France.

Computation of rates table from an Admiralty Tidal Stream Atlas.
Don’t be confused because this atlas is asking for a Dover range when you might be working out a rate off Cornwall. It’s just a convenient way of coming up with a ‘factor’ for the table to work from.
Tidal diamonds
More accurate tidal predictions are to be found on many charts. British Admiralty and USA government charts deliver this in the form of ‘diamonds’. Letters of the alphabet are depicted in a diamond-shaped frame (e.g.  ) at various locations. The tidal streams they identify are tabulated in a convenient location on the chart, by reference to ‘Hours before or after High Water’ at a standard port. Some charts have a dozen or more of these diamonds, others few, or none at all. Spring and neap rates are generally given in the table.
Diamonds can be very convenient for plotting vector diagrams (Chapter 20) but bear in mind that the information they give you is good only for the point at which they are sited. Two cables away, things may be different. Where two or more diamonds are available, study the streams at each and make an intelligent assessment of the overall position from that. A certain amount of interpolation and interpretation may well prove necessary.
Current tables
In the USA, current tables are issued and published in the almanacs. They look for all the world like tide tables, except that they give the time of slack water and the times of the maximum flood and ebb current as well as their rates. Ebb information is given in italic typeface. The similarity with tide tables even extends to the ‘differences’ pages, where time differences for flood, ebb and slack are given for numerous associated locations. My own favourite is the table for Hell Gate at the northern entrance to East River, New York City. The current differences are offered for such colourful locations as ‘Bronx River’, ‘Manhattan’, ‘Off 31st Street’, and ‘Brooklyn Bridge’.
Electronic plotters
Back in 2005, when I first added a section on electronic tidal stream prediction to what was then the latest edition of this book, I noted that much work remained to be done by the software developers. I also remarked that this was a scandalous situation, since a computer, properly programmed, could eat the job for breakfast. In 2014 I am obliged to report that, while things have moved on a little, my top-of-the-line hardware plotter still cannot compete with a traditional paper chart and tidal stream atlas for ease of use and an accurate answer. The material dished up by my mobile phone Apps is similar in quality to that offered by the big plotters, but is delivered in an even odder format, which is far from friendly. The bottom line seems to be that these programs are useful, but still not a full substitute for the paper delivery that navigators have used for over a hundred years. Clearly, the software developers do not ask real navigators operating in serious tidal conditions what they need and how they’d like it delivered. It is time they did.

Calshot Spit light float in the Solent. The pilots insisted on keeping the anchor ball in place because it enabled them to see at a glance which way the tide was flowing.
Creative use of GPS in tidal stream deduction
A final source of tidal stream information is your electronic fixing system. The difference between a dead reckoning position corrected for leeway (Chapter 17) and a GPS fix is the set and drift experienced since the last plotted position. Alternatively, you can compare the GPS ‘course and speed over ground’ (COG and SOG) readouts with the compass heading and logged speed. The on-board data that the latter pair supply can only be measured through the moving water, while the GPS information is equally surely rooted to the seabed. This time, the difference is your set and drift at the moment you take the readings. A fully interfaced system (Chapter 19) will read out set and drift on demand.
If your on-board information is sound, these methods can give a highly accurate indication of what the set and drift are, or have recently been. Sadly, they cannot peek into the future which, in the end, is more generally what is required. However, comparing the known set and drift with the predictions can indicate whether a particular tide is behaving itself. Sometimes, a tide is larger than predicted and produces faster streams. Noting any regular trend may therefore prove helpful if you have time to handle the rather cumbersome process of deduction.
| SKIPPER’S TIPS | The reference hour |
| Note that if the tidal atlas, or any other source, refers you to ‘1 hour before HW Liverpool’, it means, ‘This information is good for 1½ hours before HW to ½ hour before.’ It does not mean from 1 hour before HW until HW. | |

It’s a calm day, but the water is being cut up royally as the tide swirls in through the Needles Channel in the West Solent. With a gale of wind against the tide, this can be a terrible place.
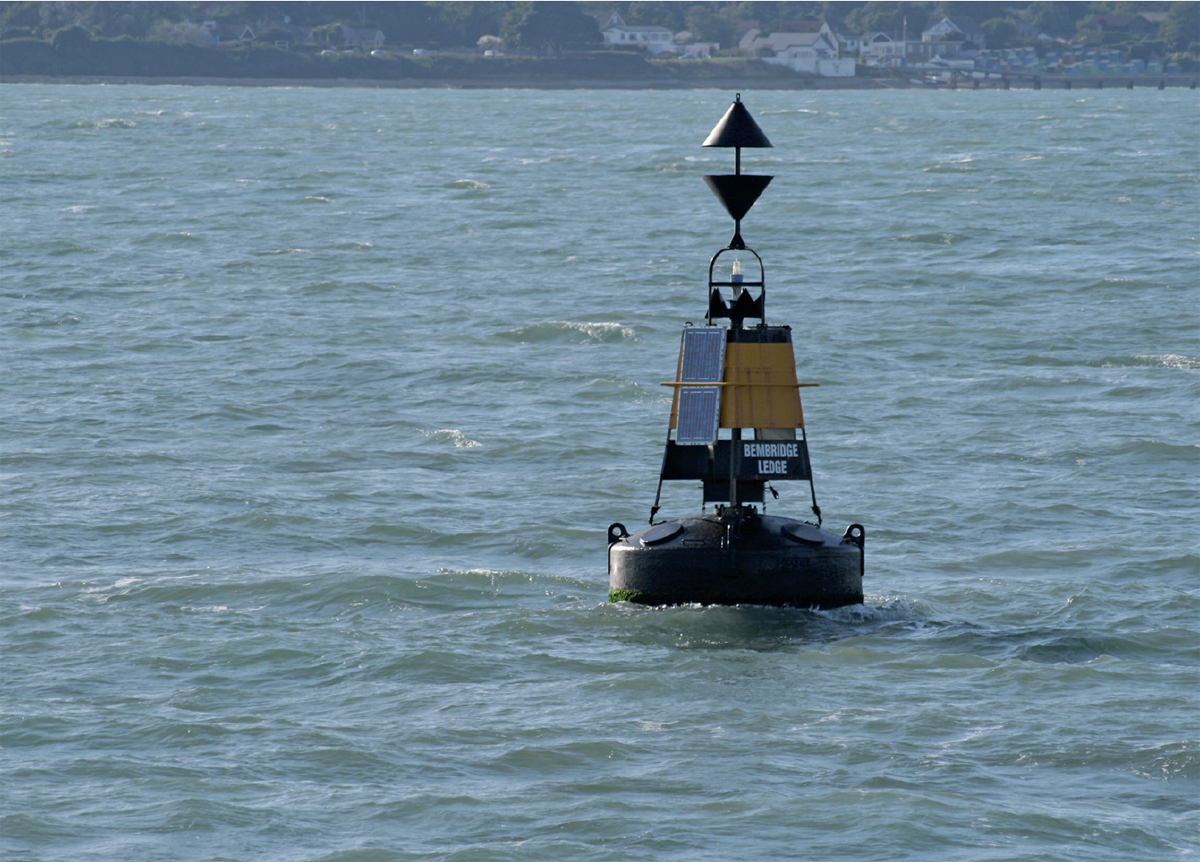
Whatever the tidal predictions say, the tide is flowing from right to left past this buoy.
Personal observation
Tide tables are all right, and GPS can be very helpful, but for accurate information you can’t beat your own eyes. Around the turn of the tide, look for direct evidence. A lobster pot marker is the best atlas in the world. If you’re moored, don’t look in the book, look over the side.
In thick fog, if you come upon a buoy, stem the tide alongside it. When the situation has become stable, read your log and your compass. The log gives you the speed of the stream, your compass offers you the reciprocal of its direction. No tide tables or GPS can beat that, but remember that your information is similar in one respect to that given by a diamond. Two hundred yards away, things may not be quite the same. Look at the terrain on the chart and make an intelligent guess, then plot your next heading, but leave a wide margin for error all the same.