20 COURSE SHAPING
Having now cracked the problem of position, the remaining question for the navigator is how to steer from there to the next destination. In practice, this is comparatively simple, despite the fact that the only time a course turns out to be exactly what an uninformed person might think it would be is when there is absolutely no current and no cross-wind. If you now read between the lines of that statement, you’ll see that the two factors that must be allowed for to convert a line joining two places on the chart into a course to steer are leeway and stream.
Fortunately for those of us who are not of a theoretical turn of mind, the situation on the chart is, at its simplest, an exact mirror of what would be happening if the scale of events were small enough for you to watch it all like a god from the clouds. In fact, you can see the correction working if you are rowing a dinghy across a flowing river (Fig 20.2). Under those circumstances the adjustment is usually made instinctively. You eyeball your destination tree on the other side, and start rowing across. As you go, you notice that your tree is moving against the trees behind it, so you choose a big one on the ridge behind the shore, and set your destination up in line with it as a transit. Once you’ve done that, the rest is easy. You must now head up into the stream so as to keep the two trees in line. If you judge your angle correctly, you’ll crab or ‘ferryglide’ across the river, steering uptide of your destination, yet arriving at it perfectly.
That is the result you are trying to achieve with the chartwork for course shaping, which is really only a pictorial way of depicting the ferryglide of the cross-river dinghy. Let’s draw it out (Fig 20.1):
 Suppose you know you are rowing twice as fast as the current. Never mind about knots, just think in terms of units.
Start out by joining your departure point a with your destination b. Give the line two arrowheads and call it your ground track.
Beginning at your starting-point a, draw in a line ac, equal to one unit, to represent the current. Mark it with three arrowheads and call it the tide vector. It is going directly downstream and it shows where you would end up after a given period if you didn’t row at all. Let’s say you would go that far in one minute.
 Fig 20.1 Rowing across a tidal stream: the theory.
Fig 20.2 Rowing across a tidal stream: the result.
Now suppose that at the end of that minute, the current could be switched off, and you have one minute to get back on the rhumb line again, making good as much ground as you can. Obviously, in one minute you will go twice as far as the current carried you, because you are going twice as fast. Take your dividers and extend them to twice the length of ac. Put one point into point c and scribe across the rhumb line with the other. Make the mark d at the intersection.
Join up cd and mark the line with a single arrowhead.
At point d you are back on track. Now switch on the current and do it again.
Of course, in reality the current runs all the time. The dynamics of the true situation are that the boat starts at a, ‘steers’ off in a direction parallel to cd on a line called ‘course to steer’, then proceeds for the designated period of time towards b never leaving the ground track, as in Fig 20.2.
Because this ‘velocity triangle’ is merely a diagrammatic construction, it doesn’t matter what units you use. You could choose nautical miles, but you’d enjoy an equally accurate result if you used milli-cubits as Noah must have done. Even the length of your thumbnail could prove useful in the absence of a pair of dividers.
It is vital that you fully understand this principle. You’ll notice that cd is a function of your boat speed, it does not join point c with the destination. If it did, the diagram would be spurious, and so would your course.
In a factual situation you should size up the picture, bear in mind that you must draw a vector diagram on the chart and choose units that will fit in acceptably to the scale of things. The bigger, the better, so long as the triangle does not become so large that it runs off the chart, or you run out of chart protractor. Many modern chart protractors have scales scribed along their edges and these can fit the bill excellently. Ideally, you would use minutes of latitude and do the whole job in real knots, but if the scale won’t fit, there is nothing to stop you using degrees of longitude for convenience instead.
If the length of the ‘leg’ is such that you will execute it either in well under, or a little over, an hour, don’t worry if your triangle ends up inside or beyond your destination. It does not matter. You’ll reach the spot just the same, because you never leave the ground track in a simple cross-tide vector.
Obviously, you extract your tide set and drift information from one of the sources mentioned in Chapter 15. Remember that tide booked as 1.3 knots 250° 3 hours before HW Dover means that from 3½ hours before until 2½ hours before HW, you get 1.3 knots at 250°. To get the figure for between 2½ and 1½ hours before HW you need to look up ‘2 hours before HW’. If your run is going to straddle a change, make a pro-rata adjustment, interpolating in your head if you are not overfussy about the result. If you really care, plot ½ hour of each tide, or whatever you predict the relevant proportions to be.
The same principles apply to legs where you expect to run two hours’ tide, or more. In these cases, plot all the tide vectors at the beginning (point a in the illustration), then join point c (the end of the compound tide vector) with your track by setting your dividers to the distance you expect to run in however many hours’ tide you have plotted. Again, you must resist the temptation to join the end of the tide vector to your destination, especially when your dividers are hovering close to it.
 COURSE TO STEER AT THE TURN OF THE TIDE
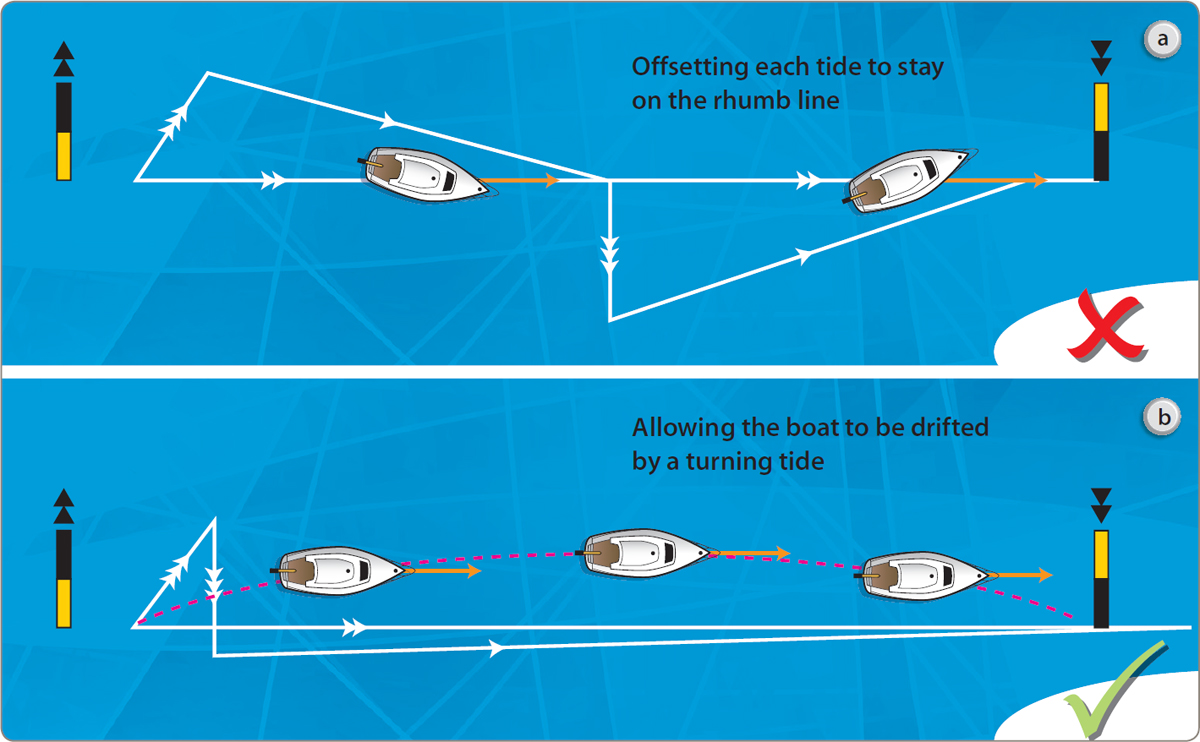
To take this case at its simplest, let’s suppose you have a two-hour leg to run and the tide makes a radical change in strength and direction halfway through it. You have two choices. You could choose to lay off for the first half of the tide in one course to steer, then alter at half time, laying off a fresh course for the new tide. If you do this, you will remain more or less on track throughout the exercise. This could be important if there are dangers to one side of it. However, Fig 20.3a shows that in order to achieve this you have sailed a measurably greater distance than if you had laid both tide lines on at the departure point and allowed the tide to have its way with you (Fig 20.3b). In the latter case, the boat’s ‘water track’ is almost straight towards her destination the whole time. Her ‘ground track’ drifts with the tide, but she doesn’t fight it, because she knows that at the end of the second hour, she will have drifted back to the rhumb line. Her off-set is minimal, she has sailed less distance through the water and she is actually further on after two hours than had she fought the tide in order to stay on the direct route.
Fig 20.3 Course to steer at the turn of the tide. If you lay off for both hours individually so as to stay on the rhumb line, you will have to sail further than if you lay off both together at the beginning. This is because one hour’s tide more or less cancels the other, so to steer into them is vain.
This example should make clear the folly of using the cross-track error function of a GPS receiver to compensate for set and drift without considering all the implications. In a simple one-hour situation, the technique can be most useful, particularly when homing in on a single-point destination in thick weather, but on a longer passage in a tide due to change it is emphatically not the best thing to do.
THE LONGER PASSAGE
Identical principles are used when setting up for a cross-tide passage of longer duration. A classic example of this would be an Irish Sea crossing from Anglesey to Dublin. The distance would be in the order of 60 miles. If you expected a reach and reckoned on a speed of 5½ knots, that would be about 11 hours for the passage.
Look up the tidal stream information for all of your 11 hours. Add up the north-going and the south-going streams, take the lesser value from the greater, and you have what is in effect a net tide vector (Fig 20.4). Plot this at your departure point, draw in your track, open the dividers to 60 miles (or whatever scale you are using) and complete the triangle. You may drift 15 miles to one side of your track by the time you are halfway there, but the next 5 hours will see you sliding back towards Dublin as surely as you can say, ‘A pint of Guinness, please.’
A classic ‘course to steer’ vector diagram. Chart extract reproduced from British Admiralty Chart No 2147.

Fig 20.4 The net vector on a passage of several hours.
LEEWAY
You’ll notice that, after initially noting its importance, we haven’t yet mentioned leeway in this discussion. The reason is that, because it is applied to the course to steer, it is dealt with as a final adjustment. If you have understood its place in the estimated position you’ll realise how to deal with it for a course to steer.
Depending on her point of sailing, your boat is going to be driven downwind by her leeway at anything from 2° or 3° to as much as 20° in heavy weather. Once you have estimated how much your leeway will be, you must steer upwind by an equivalent number of degrees to counteract it. On the chart you can arrange this by laying your protractor along the course to steer and rotating it 10° (or whatever the leeway angle may be) to windward. Do not plot this line. If you do, clarity will be compromised, but I would suggest that you log it as the course you are steering, after making a note in the log book to remind you about what you have done.
Some log books contain separate columns for course required, leeway and course steered. If you find this helpful, go for it, but don’t feel you must if the extra columns seem daunting. It is enough to log what you are really steering. Remember that when you come to plot an EP you’ll be applying leeway to the course actually steered, so that is the one that counts.
The question of when to plot a cross-tide vector and when to ‘eyeball’ it causes considerable misunderstanding among inexperienced sailors. Like most things, the best answer is to eyeball it if you can. In a cross-current, this means being able to identify some sort of transit, perhaps a natural one, either dead astern or ahead, behind your destination. This is often not possible, however, so my recommendation is to practise plotting vectors until it is second nature. Then, when you feel you need a course to steer that will allow for the tide, the job will only take a few seconds. If it absorbs five minutes, you are being a bad skipper. What is more, if you know it’s going to take that long you’ll be less inclined to do it when you need to. The answer is to follow your commonsense but to be a master of the mechanics of plotting.
CROSS-TIDE SAILING WITH GPS
Some of the more sophisticated plotter programs allow you to shape a cross-tide course using stream information from their own database. The data from which these programs work are not always of the highest quality, so care must be taken not to capitulate to the machine until you are totally confident that it is giving the right answers.
If you don’t like the whiff of things and still want to work on the plotter, try using the plotter’s ‘dividers’ to construct an old-fashioned vector diagram. On my boat’s PC program it works a treat!
Shaping a course to a waypoint with GPS and a paper chart, one has only to inspect the bearing to the waypoint and the course over ground (COG), then steer so that the two coincide. Any cross set is automatically taken care of. It’s important to keep checking the bearing, which may change if the boat drifts from the original safe heading. Make sure any new track is not taking the boat across some ghastly danger by noting the bearing on the chart.
When it’s grey and blowing like this, nobody feels like taking the trouble to shape a course, but it can matter even more when the going gets rough. If it’s just a one-hour vector and you have a chart plotter, you can be grateful that all you need do is steer so that the projected track crosses your destination.
The technique with a plotter is even easier, so long as it has a projected track function which has been turned on. All that is then needed is to steer so the vector on the screen is crossing the destination and all will be well. It’s immediately obvious if the vector passes too close to a danger on the way.
Using GPS like this is fine for short hops. In a turning tide situation (Fig 20.3), it still pays to work out the net vector because most hardware plotters can’t do this for you. A good PC will, but working up a few sums isn’t much of a hardship and it ensures that you are in charge, rather than capitulating to a machine that may or may not know what’s best.