Glossary
This list of definitions is not exhaustive but rather a personal selection driven by my experience in writing this book. Of course, you may wish to apply your own independent thinking here and find some of the definitions deserve to be challenged.
Abduction. A form of reasoning, made popular by Sherlock Holmes, in which clever guesses are used to generate a theory to account for the facts observed.
Accuracy. How close a number is to the true quantity being measured. Not to be confused with precision.
Affirming the antecedent. Same as modus ponens (see entry below).
Amalgamating. Combining observations or scores from two or more groups into a single group. If the groups are similar along an important dimension—homogeneous—this is usually the right thing to do. If they are not, it can lead to distortions of the data.
Average. This is a summary statistic, meant to characterize a set of observations. “Average” is a nontechnical term, and usually refers to the mean but could also refer to the median or mode.
Bimodal distribution. A set of observations in which two values occur more often than the others. A graph of their frequency versus their values shows two peaks, or humps, in the distribution.
Conditional probability. The probability of an event occurring given that another event occurs or has occurred. For example, the probability that it will rain today given that it rained yesterday. The word “given” is represented by a vertical line like this: |.
Contrapositive. A valid type of deduction of the form:
If A, then B
Not B
Therefore, not A
Converse error. An invalid form of deductive reasoning of the form:
If A, then B
B
Therefore, A
Correlation. A statistical measure of the degree to which two variables are related to each other, it can take any value from −1 to 1. A perfect correlation exists (correlation = 1) when one variable changes perfectly with another. A perfect negative correlation exists when one variable changes perfectly opposite the other (correlation = −1). A correlation of 0 exists when two variables are completely unrelated.
A correlation shows only that two (or more) variables are linked, not that one causes the other. Correlation does not imply causation.
A correlation is also useful in that it provides an estimate for how much of the variability in the observations is caused by the two variables being tracked. For example, a correlation of .78 between height and weight indicates that 78 percent of the differences in weight across individuals are linked to differences in height. The statistic doesn’t tell us what the remaining 22 percent of the variability is attributed to—additional experimentation would need to be conducted, but one could imagine other factors such as diet, genetics, exercise, and so on are part of that 22 percent.
Cum hoc, ergo propter hoc (with this, therefore because of this). A logical fallacy that arises from thinking that just because two things co-occur, one must have caused the other. Correlation does not imply causation.
Cumulative graph. A graph in which the quantity being measured, say sales or membership in a political party, is represented by the total to date rather than the number of new observations in a time period. This was illustrated using the cumulative sales for the iPhone [here].
Deduction. A form of reasoning in which one works from general information to a specific prediction.
Double y-axis. A graphing technique for plotting two sets of observations on the same graph, in which the values for each set are represented on two different axes (typically with different scales). This is only appropriate when the two sets of observations are measuring unlike quantities, as in the graph here. Double y-axis graphs can be misleading because the graph maker can adjust the scaling of the axes in order to make a particular point. The example used in the text was a deceptive graph made depicting practices at Planned Parenthood.
Ecological fallacy. An error in reasoning that occurs when one makes inferences about an individual based on aggregate data (such as a group mean).
Exception fallacy. An error in reasoning that occurs when one makes inferences about a group based on knowledge of a few exceptional individuals.
Extrapolation. The process of making a guess or inference about what value(s) might lie beyond a set of observed values.
Fallacy of affirming the consequent. See Converse error.
Framing. The way in which a statistic is reported—for example, the context provided or the comparison group or amalgamating used—can influence one’s interpretation of a statistic. Looking at the total number of airline accidents in 2016 versus 1936 may be misleading because there were so many more flights in 2016 versus 1936—various adjusted measures, such as accidents per 100,000 flights or accidents per 100,000 miles flown, provide a more accurate summary. One works to find the true frame for a statistic, that is the appropriate and most informative one. Calculating proportions rather than actual numbers often helps to provide the true frame.
GIGO. Garbage in, garbage out.
Incidence. The number of new cases (e.g., of a disease) reported in a specified period of time.
Inductive. A form of inferential reasoning in which a set of particular observations leads to a general statement.
Interpolation. The process of estimating what intermediate value lies between two observed values.
Inverse error. An invalid type of deductive reasoning of the form:
If A, then B
Not A
Therefore, not B
Mean. One of three measures of the average (the central tendency of a set of observations). It is calculated by taking the sum of all observations divided by the number of observations. It’s what people usually are intending when they simply say “average.” The other two kinds of averages are the median and the mode. For example, for {1, 1, 2, 4, 5, 5} the mean is (1 + 1 + 2 + 4 + 5 + 5) ÷ 6 = 3. Note that, unlike the mode, the mean isn’t necessarily a value in the original distribution.
Median. One of three measures of the average (the central tendency of a set of observations). It is the value for which half the observations are larger and half are smaller. When there is an even number of observations, statisticians may take the mean of the two middle observations. For example, for {10, 12, 16, 17, 20, 28, 32}, the median is 17. For {10, 12, 16, 20, 28, 32}, the median would be 18 (the mean of the two middle values, 16 and 20).
Mode. One of three measures of the average (the central tendency of a set of observations). It is the value that occurs most often in a distribution. For example, for {100, 112, 112, 112, 119, 131, 142, 156, 199} the mode is 112. Some distributions are bimodal or multimodal, meaning that two or more values occur an equal number of times.
Modus ponens. A valid type of deductive argument of the form:
If A, then B
A
Therefore, B
Post hoc, ergo propter hoc (after this, therefore because of this). A logical fallacy that arises from thinking that just because one thing (Y) occurs after another (X), that X caused Y. X and Y might be correlated, but that does not mean a causative relation exists.
Precision. A measure of the level of resolution of a number. The number 909 is precise to zero decimal points and has only a resolution of the nearest whole number. The number 909.35 is precise to two decimal places and has a resolution of 1/100th of a unit. Precision is not the same as accuracy—the second number is more precise, but if the true value is 909.00, the first number is more accurate.
Prevalence. The number of existing cases (e.g., of a disease).
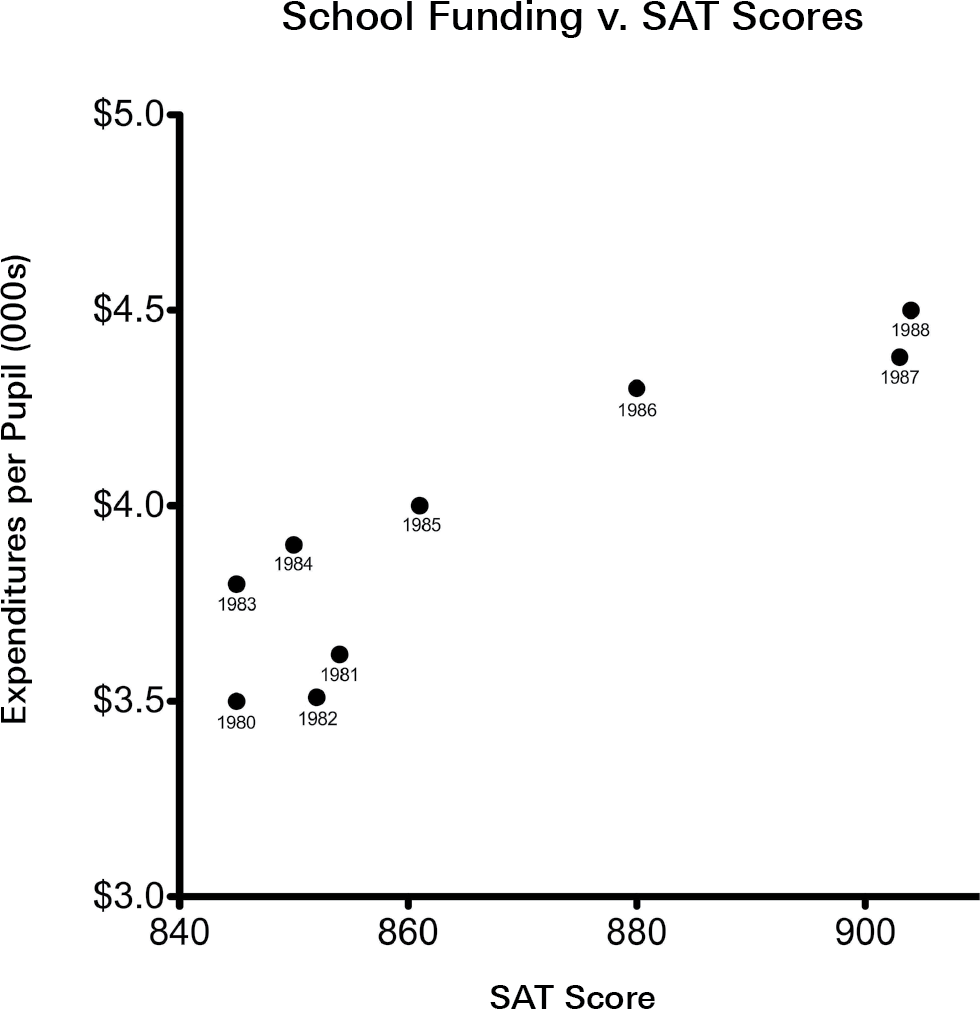
Scatter plot. A type of graph that represents all points individually. For example, opposite is a scatter plot of the data presented here.
Subdividing. Breaking up a set of observations into smaller groups. This is acceptable when there is heterogeneity within the data and the larger group is composed of entities that vary along an important dimension. But subdividing can be used deceptively to create a large number of small groups that do not differ appreciably along a variable of interest.
Syllogism. A type of logical statement in which the conclusion must necessarily follow from the premises.
Truncated axis. Starting an x- or y-axis on a value other than the lowest one possible. This can sometimes be helpful in allowing viewers to see more clearly the region of the graph in which the observations occur. But used manipulatively, it can distort the reality. The graph shown in this glossary under the entry for “scatter plot” uses two truncated axes effectively and does not give a false impression of the data. The graph shown here by Fox News does give a false impression of the data, as shown in the redrawn version here.