
Figure 3.1 International Energy Conservation Code’s map of U.S. climate zones. Copyright © 2015 by International Code Council, Inc.
Assessing design opportunities provided by the local climate is necessary for any project. Adequately understanding how a building is sited, its rural or urban context, its orientation to the sun, and the annual temperature, humidity, wind, and rainfall all help define possible passive and active sustainable design strategies.
Our planet is a complex ecosystem made up of different combinations of weather. Translating global design approaches to your location requires understanding the features of climate. To help make sense of it all, the world map originated by Koppen-Greider1 shows climate classifications based on geographic location, temperature, and precipitation. Used by atmospheric scientists, it has been and continues to be a valuable way of examining the world’s climate.
In the U.S., climate zones, based upon ranges of temperature and humidity, are used as prescriptive and performative energy compliance for residential2 and commercial buildings. Within these zones exist climate-responsive vernacular architecture. Often, these early climate-adapted buildings inspire today’s place-based design approaches to materiality, form, daylight, and ventilation of buildings.
Within the U.S., each climate zone is classified depending on its weather, latitude, and elevation, simplified as subarctic, very cold, cold, cool, mixed, warm, hot, and very hot. Across the zones there exists variation as to whether it is a dry, humid, or marine location.
Building science lies at the heart of defining the climate zones shown in Figure 3.1 and their related thermal performance expectations for residential and commercial buildings. Understanding the relationship between climate and building forms the forefront of high-performance green building.
Alternatively, the quantification of our climate has had the negative effect of dehumanizing it instead of allowing us to understand climate intuitively. Only understanding climate by the numbers could lead to builders, architects, and engineers blindly following code pathways and ignoring specific micro- and macroclimatic effects. While codes and standards exist to protect the quality of the interior environment from unhealthy and unwanted conditions, by providing mechanical means to create livable building conditions it is possible to miss the climate opportunities available for achieving greater building performance.
Figure 3.1 International Energy Conservation Code’s map of U.S. climate zones. Copyright © 2015 by International Code Council, Inc.
Two ways to categorize buildings accordingly would be either climate-rejecting or climate-adapted. The books The Design of Energy-Responsive Commercial Buildings by the Solar Energy Research Institute3 and Ken Yeang’s Ecodesign4 examine two different ways that commercial buildings are energy responsive and discuss the two extremes of how a building positions itself within its climate. A climate-rejecting building is one that primarily relies on active systems—mechanical means—to heat, cool, and ventilate the building. The climate-adapted building alternatively incorporates as many passive systems as possible to help heat, cool, and ventilate the building. Today we might call this bioclimatic or passive solar design, one that meets the human need for a comfortable interior environment tailored to the specific climate. The climate-adapted approach utilizes the available sun, wind, water, and earth to provide heating, cooling, and ventilation.
The goal of both approaches is to create a comfortable interior thermal environment. It is not an either/or situation, but more of a both/and approach to maximizing the energy responsiveness of our designs. To achieve the greatest operational efficiency within a building, mechanical systems may be the best and ideal solution. However, maximizing architecture’s role in conserving energy requires designing architectural climatic adaptions that can reduce the building’s reliance on purely mechanical solutions, creating a hybrid between the climate-rejecting and the climate-adapted building. Creating the ideal interior environment therefore requires us to understand more about how our building design behaves within the local climate. This chapter describes using BEM to gain knowledge about the weather, macro- and microclimates, and how to understand and analyze the climate when making design decisions.
Software can present you with an immense amount of information about your project. There exists a wealth of data related to weather that helps us understand the larger, macro-scale picture of a climate, including information related to the outside season temperature (both dry and wet bulb), wind direction and speed, humidity, sky cover, and radiation. However, the program you might be using is not omniscient; it is merely providing data from a weather file based on your specific geographic location.
Making an informed choice about which weather file to use is important. Studies have evaluated the impact of using different weather data to evaluate aspects of the same building. The most sensitive elements for a building’s optimal energy performance can change based on the weather file used. Understanding the composition and creation of weather information is important, and the U.S. DOE provides guidance on where to locate weather files and how to use them.5 Research shows that choosing the right weather file is important to a building’s overall performance,6 since we are designing buildings for future weather trends, not past ones.
A BEM uses weather files to describe the climatic context for our building. Weather files represent a historic picture of climate conditions for a specific location and are called Typical Meteorological Year (TMY) files. Recent freely available files are TMY3, created to document an average year based on a span from 1991–2005.7 Other TMY files, such as TMY7 or TMY15, use different timeframes for the data comprising the file and are either sourced from a third party or created manually. The weather file is a multi-year aggregation of precipitation, temperatures, radiation, and other weather data specifically meant for BEM. Since TMY files aggregate a range of years, they do not capture extreme conditions—for example, the seven feet of snow or the week of sub-zero temperatures. However, TMY files are valuable because they have been validated, cleaned up, and contain the most accurate usable data. TMY files are common, but are not the only source of weather information.
The TMY is the most widely accepted weather file for BEM, though several BEM tools also construct their own weather data. Other sources include program-specific data, third-party files, California Title 24 weather files, and real-time weather data. EnergyPlus (E+) has translated TMY files into an E+ Weather file (EPW)8 using a variety of information sources. Autodesk collects weather data for use in Green Building Studio and allows it to be exported to E+ and other platforms. The National Weather Service (NWS) collects information from 4,000 stations across the U.S. and can be parsed by any third party or used as real-time information. For California Title 24, weather files are specific to the climate zones defined for the state and read by BEM programs specific to Title 24 compliance. Information on weather data is highly diverse and takes some patience and focus, and is the specialty of some consultants and third parties.9 TMY files are good enough in many cases to simulate typical building operations using BEM; however, they do not capture all the different weather conditions a building might experience and are insufficient for evaluating future climates. It is therefore important to evaluate the file to ensure that the data are valid for the specific use intended.
One of the godfathers of BEM, Drury B. Crawley, proposed the use of the eXtreme Metrological Year (XMY).10 XMY data are not necessarily a standard downloadable file common for use in BEM. Created by knowledgeable climate scientists, engineers, or energy modelers, XMYs are used for specific research or experiments. Making such a file requires parsing through weather data and identifying extreme patterns and their variability over a variable number of years. The compiled data represents 8,760 hours per year of weather for however many years are included. XMYs often use statistical forecasting to produce changes in the mean and variance for different variables over the course of a year or period of change. Once the XMY file is ready, a BEM simulates the effects of extreme weather conditions on a building’s performance.
While XMY files are still not widespread, Drury and others11 recommend the use of multiple weather files to capture the range of a building’s performance. One suggestion is using three different climate files: one typical, one colder, and one hotter. There may never be an exact way of accurately predicting a building’s energy performance, but this variation helps us understand the range possible within these climates. Using multiple weather files can also demonstrate the potential long-term variability that exists for building operations.
The actual weather patterns of a specific climate are contained in an Actual Meteorological Year (AMY) weather file. Here, one takes the weather data from local weather stations and uses the information directly to create a simulated environment that tests a building’s energy performance in BEM. This can be most useful if you seek to understand how a design would have performed recently in a specific location, since it captures the actual local weather patterns, whereas the TMY and XMY files provide extrapolations of the weather. The disadvantage of using AMY weather data is that such files can provide inaccurate data in cases where there was a local weather anomaly, or if a recent winter or summer was particularly mild or extreme (though climate research shows that these anomalies are rapidly becoming the norm). In either case, the building design and means to heat, cool, and ventilate may not be adequate for the extreme conditions or even for longer periods of typical weather patterns. Another common use of AMY files is calibrating the energy model with actual operational data after the building has been completed.
The weather is the primary consideration for identifying passive strategies in architectural design, since it allows the architect to define different passive opportunities. A best practice is to design based on multiple climate scenarios as well as for expected reasonable extreme conditions.
Experts in BEM know that using weather files requires some customizing. Many TMY files have some fixes or errors in the weather set. TMY files are constructed through a standard methodology,12 and updates of the files occur regularly.13 Additionally, California has specific model code compliance weather files for different jurisdictions. Canada allows design teams to develop the climate zone through bin analysis to determine the data that best fits the climate they are designing around, whether that climate belongs to today or 100 years from now. Depending on the intent or climate model, energy modelers can modify the TMY files to be predictive and to fix raw data errors, effectively making a more appropriate way to simulate the building design and demonstrate compliance where necessary.
BEM’s use of weather data helps designers, architects, and engineers simulate and understand the specific climate conditions for building design. That said, simulated energy savings and peak demand reduction by energy conservation measures using the TMY3 weather data can be significantly under- or overestimated,14 and the choice of weather files will affect the building’s total energy performance. BEM, however, has the best potential to aid designers in reducing energy consumption, though it cannot itself accurately predict an actual building’s performance. BEM helps us make the best choices, not find a perfect answer.
Next, we show how leveraging macro-scale climate information contained in weather files helps to identify design opportunities related to temperature, humidity, wind, precipitation, earth, and sun. Following this, using BEM can aid in evaluating micro-scale site-specific weather conditions. The scalar climate issues aid in the identification of climate analysis and in considering the questions necessary in building design.
An understanding of a climate at the macro- and micro-scale is vital in prioritizing the possible passive energy approaches for design. A building’s specific location has the greatest influence on energy consumption, and shaping the building form to maximize architecture’s role in optimizing all the passive possibilities depends on the external climatic conditions and the local weather. The building’s enclosure mitigates the external forces to create internal climates deemed acceptable by the occupants. In doing so, the building design and its relationship to the climate can reduce the building’s overall consumption of energy, creating internal conditions through passive and mechanical systems for heating and cooling.
Where a building is located on our planet influences its design. Climate conditions and seasons vary by location, as do the people who live there. From a range of different global climates—tropical, desert, temperate, cool, and polar—the weather varies, as does the location of the sun. Near the equator the sun is overhead all of the time, whereas near the poles the sun can be absent for months on end. Additionally, social and physical preferences vary as well; not everyone on the planet may prefer the thermal comfort zone in the same way, or experience it homogeneously. These global issues of climate, location, and perception of the climate significantly affect the building design for many of the passive strategies we employ.
To affect energy consumption within the building, we need to understand the basic principles of energy itself. Basic building physics comes from several laws of thermodynamics.15 The first law of thermodynamics states that energy can be neither created nor destroyed; therefore, all the energy that can ever be already exists within the universe. This is also known as the law of conservation of energy, which states that the energy within the universe is always the same. While overall energy remains constant, energy can change forms. The second law of thermodynamics states that closed systems move to disorder over time; this is also known as the law of entropy. Entropy drives the behavior of heat flow from hot to cold. Bodies also move energy from hot to cold in the form of heat.
Therefore, the goal of an energy-efficient approach to a climate would be to capitalize on the available free energy by passively dealing with the thermal conditions of the site and climate. This includes using the sun’s energy to heat, the wind to ventilate and remove heat for cooling, water to add humidity, and the earth and materials to store or remove heat. Since temperature and humidity control thermal comfort, passive solar and bioclimatic design involves levering thermodynamic principles to conserve the energy available locally, rather than relying on importing energy from fossil-fuel sources.
The key to successful integration of this free energy is designing for how we experience comfort. Since our buildings should adjust the external climate conditions to an interior climate that is comfortable for the majority of people most of the time, how our bodies experience this interior climate requires description. What the body senses is the air temperature (dry bulb) related to the amount of moisture in the air, known as relative humidity (RH). The more moisture in the air, the higher the wet bulb temperature; this means that the apparent temperature feels warmer when the RH is higher. Wind, on the other hand, causes the evaporation of sweat and moisture from our bodies, making us feel cooler. When the air is cold, its movement can cause wind chill. In each instance, the temperature, measured via a dry bulb, is the same—it is the amount of moisture in the air or the velocity of the wind that makes it feel different.
By further using energy-modeling programs we can define project criteria, such as temperature and humidity levels, important to prioritizing design goals. The weather within any climate zone has natural variation depending on the time of day, the season, and the microclimate conditions. Analyzing and understanding this variability, quantified within the weather data used in the BEM analysis, is part of prioritizing the design approach. Evaluating these macroclimatic variables is important for architectural design to tailor a building to the local temperature, humidity, wind, precipitation, earth, and sun.
We know from experience that outside temperature varies from hot to cold and cold to hot, with a wide range in between. Many architecture students have likely had to calculate the heating and cooling degree-days (HDD and CDD) for their building’s location. I certainly didn’t think much of this as a professional until I started working on zero-energy buildings and needed to define the exact role of passive opportunities for the climate in which the building was located. Since climates vary depending on location, quantifying the HDD and CDD helps understand the amount of heating or cooling needed in your location.
Locations vary in their need for cooling or heating. For example, if you live in Minneapolis, you will need more heating and not much cooling each year. Alternatively, if you were sitting on the beach in Miami or southern California, heating is not something you are thinking about. If you fall somewhere in between, you likely require a bit of both heating or cooling to maintain a decent level of personal comfort. Identifying the primary mode of maintaining human comfort precedes identifying any specific climate opportunities.
If the outside conditions and building use allow, passive ventilation might be possible for keeping interior temperatures within the comfort zone. For instance, using the temperature per month provided by the weather file and presented as average temperature ranges (Figure 3.2, left) shows there are limited hours for natural ventilation opportunities during the year, reducing but not eliminating the need for cooling. Comparing this with the weather data from another location (Figure 3.2, right) shows that natural ventilation might potentially eliminate the need for any cooling.

Figure 3.2
Annual temperatures in Fargo, North Dakota (left) and Houston, Texas (right). Images courtesy of Integrated Environmental Solutions Limited.

Figure 3.3
Hourly dry-bulb temperatures in Fargo, North Dakota (top) and Houston, Texas (bottom). Images courtesy of Integrated Environmental Solutions Limited.
Mapping the summer temperatures per hour of the day can identify when during a season they exceed or meet desirable comfort levels. Over the course of a year, as shown in Figure 3.3, the BEM tool plots temperatures for each hour of the day. This comparison of annual temperature shows us when ventilation (green colors) is a possibility. Temperature informs us when certain passive strategies might be pertinent, but the architectural design itself should weigh all climate data together before embarking on a specific solution.
Humidity is another factor, alongside temperature, that influences our comfort level. Most importantly, maintaining humidity within specific levels in an interior environment protects our health. Conditions that are too dry or too humid can cause respiratory issues. Since humidity is related to climate, the humidity inside a building therefore needs to fall within a healthy range, aided by mechanical systems that either add or remove humidity to or from the air. While the energy burden is minimal for many types of facilities, it does influence the opportunities within some climate zones.
Specifically, within mixed climates where both dry and humid conditions exist during some seasons, designing passive systems can be a challenge. For instance, when temperature conditions might be ideal for natural ventilation, the humidity might not. Alternatively, in hot-humid climates, removing humidity from the air can be a full-time job for a mechanical system.
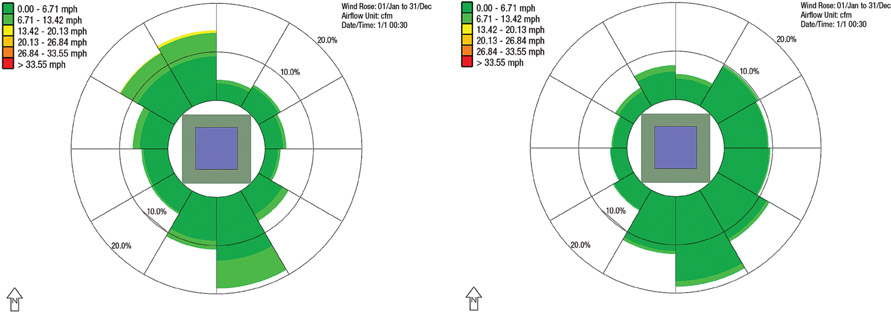
Figure 3.4
Seasonal wind roses for Fargo, North Dakota (left) and Houston, Texas (right). Images courtesy of Integrated Environmental Solutions Limited.
Wind roses report a location’s wind patterns at a macro level. These diagrams show us from which direction and at what speed the prevailing winds come. Comparing the same two locations for which we gathered temperature in Figure 3.2, one can see that at the first location seasonal wind speeds are much greater than at the second (Figure 3.4). However, the second location has a larger percentage of time when the winds come from the southeast, making ventilation again more feasible due to the wind’s lower speed and longer duration.
The goal of evaluating wind roses is to identify the desirable periods for wind penetration versus the periods in which the building requires protection from the wind. Climate consultant software can animate wind-rose patterns throughout the year. While this is fascinating to watch, it more importantly shows a designer how prevailing winds move and fluctuate for a specific climate. Other BEM tools also show wind patterns that designers can use for climate analysis.
The caveat is that these opportunities exist at the macro level. Wind patterns vary at ground level and at different locations in the terrain. Since the weather station might be at the airport or on top of a tall building, the specific application of wind data needs to be assessed locally at the micro-scale of the building site. Working with local experts or doing your own measurements can help you understand the site-specific wind conditions.
Snow, rain, and ice are important design factors, and they drive structural calculations for climates where heavy snow can be expected. Buildings are detailed specifically to keep water out and to resist damage caused by freezing. These items at first may not appear to offer any passive heating or cooling opportunities for energy savings; however, some BEM programs can calculate precipitation to determine water conservation strategies within and outside of the building. Precipitation data is included in the weather files and is an important aspect of an environmentally sustainable design approach.
Though perhaps not a specific weather element, the earth can still play a valuable role in how our building performs. Using the ground beneath our feet has the potential to increase the climate-specificity of our designs. Incorporating the earth through coupled heating or cooling systems such as geothermal, ground-source heat pump, earth tube, and labyrinth systems takes advantage of the earth’s constant temperature to passively maintain interior temperatures. Climate data logging the earth’s ground temperature is available in or can be derived from available weather files. While using a BEM to model these complex earth-coupled systems is not a typical BEM exercise, the potential for considering this information and the resulting climate opportunities does exist.
Additionally, the earth’s shape or landform exposes our building to the sun in different ways. As with a building’s orientation, which slope we choose to situate our building on will affect how the wind and sun interact with it: for example, southward-facing slopes maximize a building’s exposure to the sun. Whether winds go up the hill or down the hill will aid in determining the potential and shape of our building for ventilation.
BEM tools support our understanding of how the building interacts with the ground temperature for passive systems and helps determine how far we wish to locate our building in or above the earth. Additionally, the landform and our building’s location on a site affect how the building interacts with other climatic elements.
Along with air temperature, the sun determines many of the passive solar design opportunities within the specific climate zone. Together, temperature and sun—more specifically, solar radiation—have the biggest impact on passive strategies. Understanding how to design for the sun is the subject of numerous books and publications on passive solar design. Since this book is about the use of BEM in architectural design, the specific focus is on what the software can inform you of and how one might design based on this information.
Many three-dimensional modeling programs show us what a building looks like in relation to the sun. Called a sun-system, this feature allows the user to position the sun based on a specific location, along with inputting the year, month, day, and time of choice. From simple to complex sun systems, important to how we may choose to design our building is the ability to see where the sun is.
As is well known, the sun moves throughout the day from the east to the west and changes its height in the sky, illustrated in Figure 3.5. These are two key measurable attributes known as the sun’s azimuth and altitude. The sun’s azimuth is the measure of its location on a horizontal plane at an angle where north is 0, east is 90, south is 180, west is 270, and north is again 360 degrees. The solar altitude angle then comprises the angle of this horizontal plane to the sun’s position in the sky, ranging from 0 to a zenith of 90 degrees. Using these two metrics for your specific latitude north or south of the equator can identify the sun’s location throughout the day and over the course of the year. Once located, graphics or regulating lines representing the sun’s parallel rays help identify how the building and sun interact at a specific time or throughout a season.
Using this information in design with BEM identifies situations and periods for which the sun is required. Commonly, identifying the two extremes—the winter and summer equinoxes—helps us see the narrowest and largest ranges of the sun’s movement in the sky. This can then help us identify when we can use the sun to passively heat our building. Bracketing the months where we want our design to allow sun penetration into the building—for example, in climate zones 5A and 4A this tends to be between September and April—would enable us to design openings and apertures and locate spaces. Next would be the omission of the sun during periods when it would introduce heat when cooling is predominant. The drive to avoid this excess radiation typically occurs during the summer cooling months. Again, bracketing the months and identifying this period will help designers design shading devices. Framing the problem properly helps identify the specific range in which we can design using the sun, along with how BEM is beneficial.

Figure 3.5 Sun simulation website from the University of Nebraska-Lincoln Astronomy Department: http://astro.unl.edu/classaction/animations/coordsmotion/sunmotions.html.
Weighing the temperature, humidity, and solar radiation values related to your climate location is the first step in a BEM analysis for maximizing passive solar climate-adapted buildings. Whether your location is hot or cold, dry or moist, or has a lot or a little sun, the availability of these naturally occurring phenomena establishes a beginning for design. Without considering climate early, we default to over-reliance on mechanical systems to produce acceptable environments within our building. Furthering the responsiveness of the building to climate is our evaluation of the microclimate at the building site.
By using BEM tools we can define project criteria important to prioritizing design goals specific to our building site by evaluating the microclimate conditions. Here we can utilize some other functions of BEM tools, along with Computational Fluid Dynamics (CFD). One parameter is the context of the building site, whether urban, rural, or somewhere in between. The existing microclimate should influence where exactly we locate our building. In addition, once there, how will our building affect this microclimate?
To understand the building and microclimate reciprocity, using BEM and CFD can give us information about the available solar radiation, heat island, ventilation, and contextual shading, or reflectivity of nearby buildings. Solar radiation analysis tells us the amount of the sun’s energy that strikes a surface. Within a specific site it is possible to utilize weather data and geospatial modeling to identify the range of radiation that falls on a site, whether a greenfield or an urban context. Using CFD analysis, one can measure, visualize, and understand temperature along with the speed and direction of wind across the landscape, including the effect of adjacent buildings and our building design’s effect on the ground-level wind velocity.
Yes, asphalt and a paved urban environment make our cities hotter. This is typically called the urban heat island effect, in which the buildings and materials create their own microclimate, typically warmer than would otherwise occur naturally. While we may all intuitively know that sitting down for a picnic under a shady tree in the summer is going to be cooler than walking down a paved concrete street with the hot sun beating down, it is possible to actually measure and visualize this effect to aid our design decisions.
Research shows that the heat island of a metropolitan area with one million people can be 1–3 °C warmer than the suburban surroundings. Overnight, the effect can be even higher, by as much as 12 °C due to the thermal mass of all the people and buildings.16 These effects exacerbate peak energy demand, air-conditioning costs, air pollution, and our health. Hot urban environments can trap air pollution, irritating respiratory issues and causing vulnerable populations to be at higher risks for illness and death.17
Therefore, addressing the heat islands within urban areas is one key benefit of using BEM tools and CFD analysis to deal with air movement, reduce solar radiation, and situate our buildings within this context in the best way to promote a healthy urban environment. As a case in point, the location of green spaces and vegetation also has a positive impact on wind flows and temperature, as shown in Figure 3.6.
Design for effective natural ventilation requires understanding of how the building is sited in its context, specifically with regard to the wind’s direction and velocity. Wind movement through a site can induce convection and evaporation, and these aspects affect temperature by either displacing it or adding moisture.
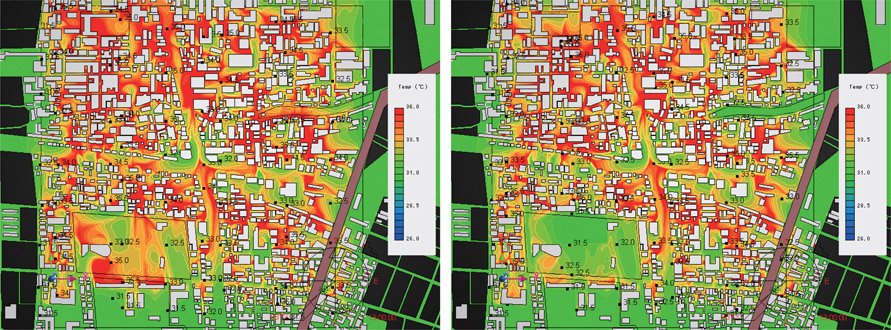
Figure 3.6 CFD thermal analysis of ground-level temperatures, comparing the temperature difference between a parking lot (left) versus a green space (right). In both images the parking lot/green space is located in the bottom left boundary. Images courtesy of Cradle CFD.
A local understanding of wind flow is important, as the denser and more vegetated an urban context, the more turbulent the flow of wind becomes. Prevailing winds are altered as they move across the landscape, through vegetation and over and around buildings. Poorly considering the building’s relationship can produce wind conditions at street level fit for neither man nor beast.
Situating the building to take advantage of wind means understanding where the wind will go and how features and landforms affect it. Hills can speed up wind velocity. Adjacent buildings can funnel or direct wind in specific directions. To evaluate all these aspects, some BEM tools or CFD analysis may be necessary. Simulations of wind direction and velocities external and internal to the building design can help properly form and shape the building to maximize architecture for natural ventilation.
Another issue possible to evaluate using BEM is the building’s site context for daylighting. Adjacent buildings can shade or reflect light on to the areas where we might locate our buildings. If we wish to maximize daylighting, then understanding how a context might shade portions of a site is important. In addition, light reflected from adjacent buildings could increase heat gains and the amount of diffuse light factored into daylighting analysis.
Modeling the context of a specific site and completing annual shading analysis will modify both the amount of sun available for heating and the nature of daylighting design possibilities. Different types of urban and rural contexts create uniquely dynamic conditions: For instance, during the winter very little exposure of a building to sunlight in a dense urban environment will make the street cold and undesirable.
Research by authors on the urban form is mostly based on Ralph Knowles’s solar envelope research from USC. Since the 1980s, Knowles has produced a range of representations of urban form based on its relationship to the sun and the shadows produced. The resulting building forms respond to the sun in a variety of ways to allow penetration and access within and around their particular site boundaries. As Knowles reflects on the solar envelope, he says that the “inter-stitium allows architects to conceive a kinetic landscape driven by the rhythms of nature.”18
Vegetation has several useful purposes. Plants can help shade the building during peak cooling periods to reduce the amount of solar radiation striking the building surface and can also shield the building from prevailing winds during the winter to protect it from cold. Vegetation can further shade the ground surface, cooling the air and its flow for ventilation.
While researchers have studied the effects of trees much more than other issues relating to the urban form,19 they are not always beneficial. Planting undesirable trees in the wrong locations can have a negative effect, blocking light and prohibiting ventilation. Planting a tree directly south of a home can actually cause a net increase in annual energy costs.
The benefits of using trees to save energy rely on the cooling effects of tree shade and evapotranspiration. Placing deciduous trees on the west or southwest side of a building in regions with hot summers and cold winters provides shade in the summer and allows solar radiation penetration for passive heating during the winter. Trees with high levels of evapotranspiration can also add small amounts of moisture to dry breezes.
Armed with a wealth of information about a specific macroclimate, we can visualize this data in relation to our building, supporting an analysis of how a building might perform. Weather analysis tools help in visualizing the information as shown above, and provide a way to analyze the results to identify design strategies.
One robust analysis tool available for furthering this is UCLA’s Climate Consultant software. Using this tool, designers can examine weather data and assess a building’s relationship to climate. The software helps to identify the specific design strategies most appropriate based on the climate. For example, Table 3.7, recreated from the Climate Consultant software, identifies the number of hours for which a building is passively at the comfort level and then the number of hours for which other active and passive elements are required to maintain the level of comfort. Most noticeable between these two hot climates is the use of evaporative cooling versus the need for dehumidification, while the use of sun shading has an almost similar effect.
Table 3.7 Summary of annual bioclimatic design strategies for two hot climates.
| Miami | Phoenix | |||
| 1A | 2B | |||
| Design Strategies: January-December | % | Hours | % | Hours |
| 1. Comfort | 14.3 | 1,252 | 16.6 | 1,451 |
| 2. Sun shading of windows | 27.2 | 2,385 | 25.6 | 2,241 |
| 3. High thermal mass | 2.9 | 257 | - | - |
| 4. High thermal mass night flushed | - | - | - | - |
| 5. Direct evaporate cooling | - | - | - | - |
| 6. Two-stage evaporate cooling | - | - | 29.3 | 2,570 |
| 7. Natural ventilation cooling | 3.1 | 273 | 7.0 | 611 |
| 8. Fan forced ventilation cooling | - | - | - | - |
| 9. Internal heat gain | 8.0 | 703 | 22.3 | 1,957 |
| 10. Passive solar direct gain low mass | - | - | - | - |
| 11. Passive solar direct gain high mass | 3.8 | 334 | 12.2 | 1,071 |
| 12. Wind protection of outdoor spaces | - | - | - | - |
| 13. Humidification only | - | - | - | - |
| 14. Dehumidification only | 16.3 | 1,427 | 0.5 | 43 |
| 15. Cooling, add dehumidification if needed | 55.9 | 4,894 | 12.7 | 1,115 |
| 16. Heating add humidification if needed | 1.6 | 139 | 14.6 | 1,280 |
As has been shown, many BEM tools can visualize the climate. Of particular help can be a single chart showing the monthly temperature, radiation, and humidity fluctuations. Graphing this information together, as in Figure 3.8, helps to show when passive strategies will work in heating and cooling the building. For instance, Climate Consultant helps to visualize annual, monthly, and hourly averages of temperature and radiation alongside the comfort zone, making it easy to understand the months requiring cooling and heating. It can also aid us in visualizing the relationship between radiation and temperatures to determine at which points during the year thermal mass and night flush systems can assist the building’s passive systems.
The graph from the weather file shows hourly information. Depending on the fidelity of the analysis required, teams could forecast the approximate times during the entire year that specific design elements could help heat and cool the building. This information is helpful within the macro-scale to identify what may or may not be appropriate. However, after this stage, it is important to look more closely at the issues of immediate concern at the building site.
While there are likely an infinite number of examples of how to incorporate climate outputs into a design model, several are discussed here. Using features of different BEM tools allows architects to visualize the sun’s radiation and to see the sun’s path and the building in the same design space. An overlay of the wind rose into the design model visualizes wind data for each hour, day, and/or month of the year. These features help an architect make basic design decisions related to climate. How we examine and interpret various aspects of climate helps the building design. Using these along with a complete BEM can also relate specific design decisions with energy savings.
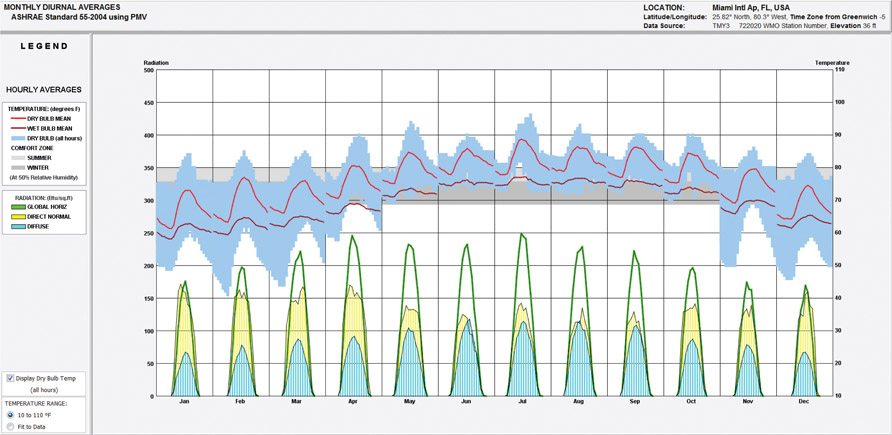
Figure 3.8 Composite output of radiation and temperature from Climate Consultant.
The presence or absence of the sun has a large impact on a building’s heating and cooling loads. The preeminent source on designing for solar radiation is Edward Mazria’s The Passive Solar Energy Book in which he outlines ways of designing buildings to relate to site, climate, material use, and the sun. The methods and data presented by Mazria are now fundamentals included in many other books and software. Most important are the passive solar systems clearly outlined as approaches to heating a building passively. The book provides information on the thermal impact of direct, indirect, and isolated gain systems, as well as 27 patterns of design that embrace the sun.20 Following these patterns and use of passive thermal heating increases the architect’s capacity to design with the sun’s energy.
Visualizing the information and collecting the data Mazria demonstrated and presented is easy to do today using BEM. Advances in computation make it easy to calculate HDDs or CDDs for a local climate, normalized as part of ASHRAE Standard 90.1 and based on climate zones. Along with temperature and humidity, the sun’s radiation values are part of the weather data we download and use in BEM.
The sun’s radiation reaches the earth and our building in three primary forms: direct radiation, diffuse radiation, and reflected radiation. Once radiation reaches the building’s surface it is reflected, absorbed, or transmitted by the material composition of what it strikes. The property of the material will dictate how much is reflected and in what way, what is absorbed, and then how it is transmitted through the material. Once absorbed, the radiation is transferred into energy as heat. The material properties that inform how radiation behaves once it is absorbed and transmitted are beyond the scope of this book, though for those interested we recommend Steven Szokolay’s Introduction to Architectural Science: The Basis of Sustainable Design (third edition).21
Visualizing the total amount of radiation on a building over the course of the day for the climate selected, as shown in Figure 3.9, is one place to start, since knowing where the majority of radiation strikes helps to prioritize the passive solar strategies. Since this precedes the building design in most cases, completing more radiation analysis is possible once a definition of the building form reaches a schematic level.
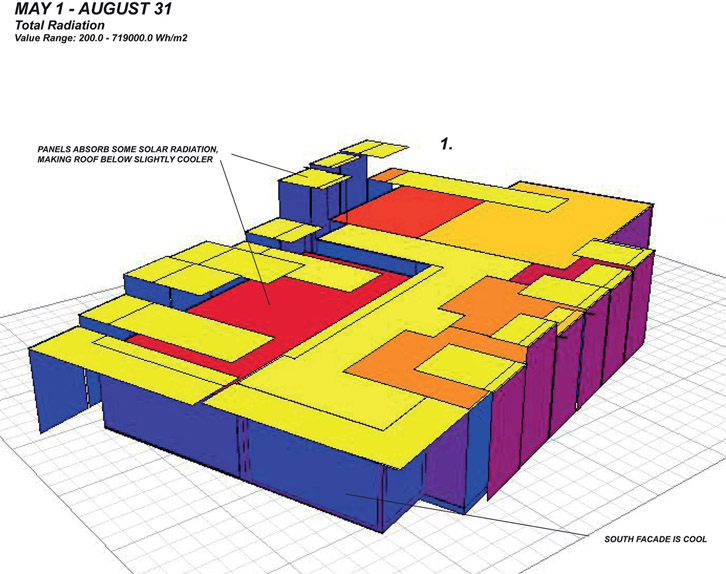
Figure 3.9
Solar radiation levels during summer months on a small commercial building. Courtesy of Michael Harpster. Timothy L. Hemsath “Energy Modeling in Conceptual Design” Fig 7.2 from Building Information Modeling: BIM in Current and Future Practice by Karen Kensek, Douglas Noble. Copyright © 2014 John Wiley & Sons, Inc.
Certain software tools can help us see how much radiation strikes the surface of a building. Vasari, IESVE, and DIVA are those familiar to us; each can show the amount of radiation that strikes a single surface or multiple surfaces. To view these data, first define the period, whether it be a single hour, day, week, month, or year, then select the surfaces to study and the geometry to include. It is vital to consider the amount of detail you wish to include, as more complex geometries and larger surface areas require more time and computational power to analyze. It is often helpful to select a part rather than the whole.
BEM tools and design modeling software help by visualizing the sun path’s azimuth and altitude. Seeing the sun’s location in relation to our building design helps us make key decisions about the site, building mass, and shape (Figure 3.10). Knowing which parts of a building design lie in sun and shadow and how these patterns change over the course of the year helps us evaluate whether they will perform as intended in our design.
Site issues might involve shadows from adjacent buildings or shadows cast by the building on adjacent neighbors. Since these issues are often faced by designers, mapping or animating the sun path and resulting shadows over the course of a day, month, or year helps to show the impact of a building’s shadow on a site. Depending on the software, a sun study produced in a short movie by animating the sun over a period of time may help show how the shadows change.
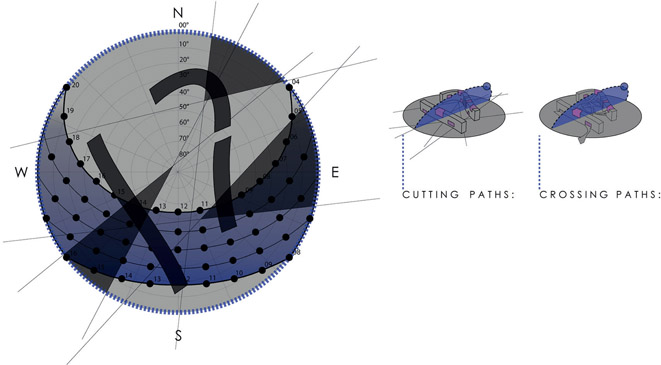
Figure 3.10
Design operations based on sun location for light and shadow. Courtesy UNL student Mallory Lane.
Understanding the sun’s effect on our building massing aids designers in determining shading, as well as in locating courtyards or roof gardens. Since different programs and spaces might be active at specific times of the day, designers can evaluate whether an outdoor space in their design would receive direct light or be in shadow, as well as judge the desirability of these spaces depending on their use and function. Shading devices for these spaces can be assessed by visualizing the sun and shadows created; for instance, if an outdoor playground is meant to be occupied during the late afternoon, shading devices to protect the children could be placed based on where the shadows would fall during the time of use.
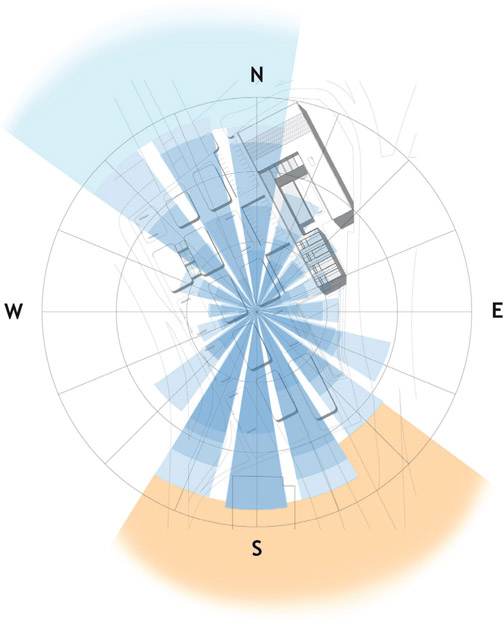
Figure 3.11
Site plan of building design with annual wind rose showing prevailing winds during summer and winter. Courtesy of UNL student Tyler Howell.
Incorporating a wind rose into the design model or drawings will show how the building can be oriented in relation to prevailing winds (Figure 3.11). Depending on the context of the building site, winds can be captured for natural ventilation, helping to passively cool the building. Locating operable windows on specific building façades in the path of desirable winds can allow for cross-ventilation. If the site is more complex in relation to adjacent buildings, the wind rose can help show where obstructions block winds from allowing effective natural ventilation. Of course, not all winds are desirable: high-velocity wind can be a problem, and we have all experienced the wind tunnel where winds are funneled down to the ground and concentrated where we are walking. While it is possible to shape buildings or create massing conditions that reduce the flow of wind, a wind rose alone might not be entirely capable of showing these effects.

Figure 3.12
CFD model of urban context and wind velocity. From Autodesk Vasari.
Instead, utilizing CFD analysis is a complex alternative. While not specifically part of BEM, using CFD analysis alongside energy simulation helps to show how air movement occurs in, around, and through a building (Figure 3.12). Various windflow modeling tools from Cradle and IES to Autodesk are available to aid in evaluating issues related to wind conditions. The challenge, much like a robust BEM model, is verifying whether the information generated is usable for the situation. Experts and specialists in this area are often necessary to adequately model airflow. While natural ventilation is not an area of expertise in this book, others have published guides on designing spaces for natural ventilation.22
A robust climate analysis and inventory of the local site conditions and their potential effects on our design decisions is a good beginning to the design of climate-adapted architecture. A fruitful outcome is to increase the energy savings through the incorporation of passive systems designed as integral building elements. An important part of climate analysis is defining the comfort model.
ASHRAE 55 has several approaches to framing interior environmental conditions to understand the effects of exterior climate conditions. Since the goal of our building is to create comfortable interior environments for people, the comfort model shows us, based on the specific standard, how many people it estimates would be comfortable in the set interior conditions. Additionally, the method used may bias the operational conditions assumed for the building, and choosing the right comfort model or evaluating several choices is important in understanding the complex behavior of the building within its climate.
Summarizing the weather’s effect on human comfort comes from the climate data within a specific location and the comfort model used. Another particularly helpful graphical tool is the creation of the psychrometric chart23 identifying where these strategies are effective to move temperature and humidity within the comfort zone.
Understanding the effects of the climatic variables related to the comfort of the interior environment lies at the heart of a hygrothermal and psychrometric analysis. One valuable tool for designers is the Center for the Built Environment’s (CBE) comfort-prediction tools. By using ASHRAE Standard 55 as a guide, designers may find that a wider temperature band will provide adequate comfort and save a significant amount of energy.24 In other cases, using this tool can assess the comfort zone for low-energy building design. Specific to ASHRAE Standard 55 is the adaptive comfort model for naturally conditioned buildings, which have no mechanical cooling system installed and no heating system in operation. The occupants within these buildings prefer a wider range of temperatures that reflect swings in the outdoor climate.25
The Chartered Institution of Building Services Engineers (CIBSE) recognizes that human comfort is key to accepting low-energy buildings that perform optimally.26 Overheating of the interior environment in naturally ventilated buildings has become a key problem for building design. The need to reduce energy consumption and deal with global climate change often limits the options available for building a comfortable and low-energy building. Recent work present in European standards found the temperature that occupants find uncomfortable changes predictably with the outdoor conditions. These issues of naturally ventilated buildings inform the CIBSE guidance presented in a Technical Memorandum on the limits of thermal comfort.27
A few BIM tools offer adaptive comfort modeling capacity and output data related to how your building design meets the comfort model and expectations. To design a climate-adapted building there are several considerations to make relative to the building’s design when considering both the macro- and microclimate. What should you ask of your climate analysis? What do you need to know about the particular climate to design a climate-adapted building?
Macroclimate analysis is common in BEM tools to quantify the variables of temperature, humidity, and wind related to your general location. Several BEM tools offer bioclimatic analysis to understand the relevant architectural design strategies possible within a specific microclimate. While BEM is helpful for many items, not all analytical approaches are computable or quantifiable. Two sources to further your knowledge on analyzing climate are Sun, Wind & Light: Architectural Design Strategies28 and Climatic Building Design: Energy-Efficient Building Principles and Practices.29 These books present several ways of looking at a site and understanding the interplay between the sun, wind, and light. Further, these books infuse a bioclimatic methodology into the design of the building in much the same way this book continues to use BEM to validate the design decisions architects make beyond understanding the location and site.
This chapter reviewed the nature of weather files used in BEM tools, explained how to visualize climate information, and suggested what questions to ask of the macro- or microclimate. Understanding climate is a step in the right direction, and the next several chapters broaden this groundwork for how climate influences building design.
What happens behind the curtain of a BEM tool? To understand this, gather climate data used in the BEM. The software is likely using a weather dataset defined
Table 3.13 Average hourly statistics for dry bulb temperatures (°C).
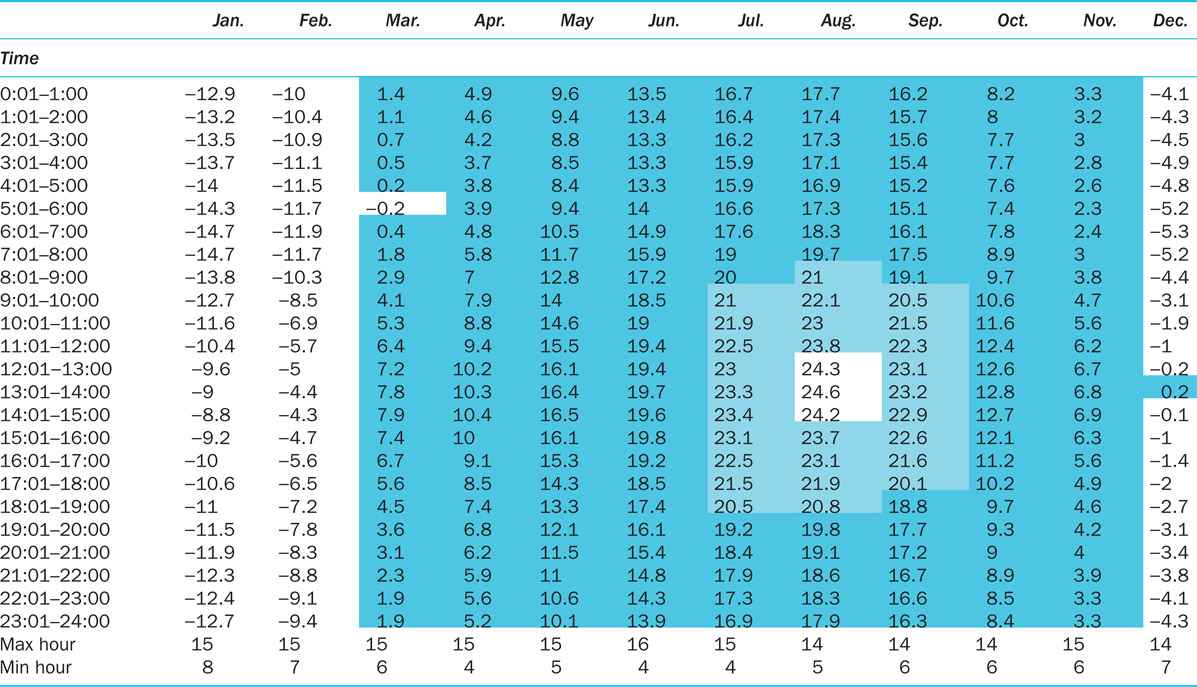
by the Climate Design Data 2009 ASHRAE Handbook. What is this exactly? Here is how to find out.
1 Markus Kottek, Jurgen Grieser, Christoph Beck, Bruno Rudolf, and Franz Rubel, “World Map of the Köppen-Geiger Climate Classification Updated,” Meteorology Z. 15, no. 3 (2009): 259–263, doi: 10.1127/0941-2948/2006/0130.
2 U.S. Department of Energy, “Residential Prescriptive Requirements, 2009 International Energy Conservation Code (IECC),” https://energycode.pnl.gov/EnergyCodeReqs.
3 Steven Ternoey, Larry Bickle, Claude Robbins, Robert Busch, and Kitt McCord, The Design of Energy-Responsive Commercial Buildings (Chichester: SERI and John Wiley & Sons, 1985).
4 Ken Yeang, Ecodesign: A Manual for Ecological Design (Chichester: John Wiley & Sons, 2006).
5 Energy Plus, “Weather Data for Simulation,” https://energyplus.net/weather/simulation.
6 Liam Buckley, “New-Trend Natural Ventilation Potential & Analytics for Various Climates in Canada,” in eSIM Conference Proceedings (2014), www.ibpsa.org/proceedings/eSimPapers/2014/1A.2.pdf.
7 S. Wilcox and W. Marion, User’s Manual for TMY3 Data Sets, NREL/TP-581-43156 (Golden, CO: National Renewable Energy Laboratory, 2008).
8 Energy Plus, “Weather Data,” https://energyplus.net/weather.
9 “Weather Underground,” www.wunderground.com; “Weather Analytics” www.weatheranalytics.com/wa.
10 Drury B. Crawley and Linda K. Lawrie, “Rethinking the TMY: Is the ‘Typical’ Meteorological Year Best for Building Performance Simulation?” in Proceedings of BS2015: 14th Conference of IBPSA, edited by Jyotirmay Mathur and Vishal Garg (Hyderabad, December 7–9, 2015), 2655–2662.
11 John G., “Weather: One of the ‘Big Uglies’ in Energy Modeling!” IES Blog, July 28, 2011, http://blog.iesve.com/index.php/2011/07/28/weather-one-of-the-in-energy-modelling.
12 National Renewable Energy Lab, “System Advisor Model (SAM): Create TMY3 File,” www.nrel.gov/analysis/sam/help/html-php/index.html?weather_create_tmy3.htm.
13 National Solar Radiation Data Base, “1991–2005 Update: Typical Meteorological Year 3,” http://rredc.nrel.gov/solar/old_data/nsrdb/1991-2005/tmy3.
14 Tianzhen Hong, Wen-Kuei Chang, and Hung-Wen Lin, “A Fresh Look at Weather Impact on Peak Electricity Demand and Energy Use of Buildings Using 30-year Actual Weather Data,” Applied Energy 111 (2013): 333–350.
15 Joseph Lstiburek, “Thermodynamics: It’s Not Rocket Science,” Building Science Insights (Building Science Corporation, May 15, 2009), http://buildingscience.com/documents/insights/bsi-021-thermodynamics-its-not-rocket-science.
16 U.S. Environmental Protection Agency, “Heat Island Effect,” www.epa.gov/heat-islands; Kazimierz Kłysik and Krzysztof Fortuniak. “Temporal and Spatial Characteristics of the Urban Heat Island of Łódź, Poland,” Atmospheric Environment 33, no. 24 (1999): 3885–3895.
17 T. Kjellstrom, S. Friel, J. Dixon, C. Corvalan, E. Rehfuess, D. Campbell-Lendrum, and J. Bartram, “Urban Environmental Health Hazards and Health Equity,” Journal of Urban Health: Bulletin of the New York Academy of Medicine 84, Suppl. 1 (2007): 86–97. http://doi.org/10.1007/s11524-007-9171-9.
18 Ralph Knowles, “The Solar Envelope: Its Meaning for Energy and Buildings,” Energy and Buildings 35 (2003): 15–25.
19 Y. Ko, “Urban Form and Residential Energy Use: A Review of Design Principles and Research Findings,” Journal of Planning Literature 28 (2013): 327–351. doi:10.1177/0885412213491499.
20 Edward Mazria, The Passive Solar Energy Book (Emmaus, PA: Rodale Press, 1979).
21 Steven Szokolay, Introduction to Architectural Science: The Basis of Sustainable Design, 3rd edn. (London: Routledge, 2014).
22 Ulrike Passe and Francine Battaglia, Designing Spaces for Natural Ventilation: An Architect’s Guide (New York: Routledge, 2015).
23 D.P. Gatley, Understanding Psychrometrics, 3rd edn. (Atlanta, GA: ASHRAE, 2013).
24 Center for the Built Environment, “CBE Thermal Comfort Tool” (May 1, 2014), www.cbe.berkeley.edu/research/thermal-tool.htm.
25 Stefano Schiavon, Tyler Hoyt, and Alberto Piccioli, “Web Application for Thermal Comfort Visualization and Calculation According to ASHRAE Standard 55,” Building Simulation 7, no. 4 (2014): 321–334. http://dx.doi.org/10.1007/s12273-013-0162-3.
26 Fergus Nicol, The Limits of Thermal Comfort: Avoiding Overheating in European Buildings, CIBSE Technical Memorandum 52 (London: Chartered Institution of Building Services Engineers, 2013).
27 Ibid.
28 G.Z. Brown and Mark DeKay, Sun, Wind & Light: Architectural Design Strategies, 3rd edn. (Hoboken, NJ: John Wiley & Sons, 2014).
29 Donald Watson and Kenneth Labs, Climatic Building Design: Energy-Efficient Building Principles and Practices (New York: McGraw-Hill, 1983).