CHAPTER 8
Geocoding
LEARNING GOALS
- Get an overview of the geocoding process.
- Geocode using ZIP Codes.
- Geocode addresses using streets.
- Use alias tables for place-name geocoding.
Introduction
Although much available data is already geocoded, in many situations you will find data in a table that you want to plot on a map. One example is the survey data from this chapter that lists street addresses, ZIP Codes, and the home states of the people surveyed. Using these location attributes, you can map (geocode) their locations. Another example is transaction data collected by organizations (and perhaps you are working for such an organization). Because transactions, such as delivery of an appliance, often occur at a location, it’s useful to map these locations to analyze the market served. Another example for transactions is surgery patients in a hospital. In this case, it’s useful to map the residences of patients to identify the service area of the hospital.
A geocode is data that identifies a unique location—a point, line, or polygon—on planet Earth. For example, the geocode 4800 Forbes Ave, Pittsburgh, PA 15213, identifies a unique point. The ZIP Code, 15213, is also a geocode identifying a unique polygon, and Pittsburgh, PA, is a geocode identifying a unique county subdivision polygon. If you have such source data, you can use ArcGIS Pro’s geocoding algorithm to map corresponding points by matching to reference data. Reference data is a feature class with existing locations—for example, street centerlines with street address attributes or ZIP Code polygons with a ZIP Code attribute.
The source data that you will geocode in the beginning of this chapter is from a survey that includes residence addresses of attendees taken by an arts organization for its annual art show. The arts organization wants to analyze locations of attendees to better target future marketing efforts. You’ll first geocode by ZIP Code only and then by street address.
The problem with geocoding is that source data suppliers (for example, survey respondents for the survey data) and data entry workers can write or type anything they want, including misspellings, abbreviations, omissions, and place-names such as “University of Pittsburgh” instead of an address. Organizations new to GIS often have typed addresses with notes included in address fields such as “333 W Pine Ave, watch out for vicious dog” that make geocoding a challenge. Consequently, exact matching of source to reference data is not possible. Instead, you must use “fuzzy matching” (a kind of matching used in computer science to make matches that are approximate instead of 100 percent accurate). For example, the address “123 Fleet St” may be on a street map, and a data entry worker may have typed “123 Fleat” for source data, with a misspelling and without the “St.” A fuzzy-matching algorithm might determine that address is close enough to the correct address and plot the residence at 123 Fleet St.
A rule-based expert software system can make fuzzy matches; ArcGIS Pro’s geocoding software is such a system. The system attempts to use the thought processes and rules that an expert would use to accomplish a complex and ambiguous task. In this case, the expert system attempts to mimic what a resourceful mail delivery person would do, using their expert knowledge to get a badly addressed piece of mail to the right address. These expert system components are used in ArcGIS Pro’s geocoding:
- Source table, with attributes of locations including geocodes (in this chapter, street addresses and ZIP Codes) to be mapped.
- Reference data, which has mapped features such as street centerlines or ZIP Code polygons and attributes such as street names that can be matched (fuzzily) to the source table’s geocodes.
- Geocoding tool, with the algorithms, rules, and user interface to perform geocoding.
- Locator, a reusable set of three or more files that include all parameter values of the tool that performs geocoding for a given kind of source data.
To account for spelling errors, an algorithm computes a Soundex key, which is a code assigned to names that sound alike (for example, “Fleet” and “Fleat” both have Soundex key F43), and identifies candidate matches on the basis of matching source and reference street addresses. (Look up “Soundex key” in your web search engine.) The algorithm starts with a score of 100 for each case and subtracts penalty points for each problem encountered. If the end score is greater than the threshold set as a parameter by default or by the user, a reference location is a candidate for matching. The candidate with the maximum score is chosen as the estimated location. If there is a tie, one of the tying locations is arbitrarily assigned as the match unless the user chooses to not accept ties (50 percent of which are incorrect).
You can geocode with any number of data types. For this chapter, you will geocode using street centerlines and ZIP Codes. People generally will disclose their ZIP Codes in surveys and get them right, so the results are complete and accurate, albeit only at the ZIP Code level. You can download a US Census Bureau ZIP Code map for the entire United States for geocoding nationwide. Often, a ZIP Code may be the only available data type and will suffice for marketing purposes. Service, product delivery, and other location-based needs require more precise locations. Street centerlines are sufficient for many purposes (but certainly not for locating in-ground natural gas and other lines during construction digging). You can easily use geocoding with ZIP Codes and street centerlines with free map layers downloaded from the Internet (see chapter 5). However, cities and states perform many other kinds of geocoding, often more precisely, using land parcel centroids with street addresses provided by many city governments. Note that Esri provides the highly accurate and current ArcGIS Online World Geocoding Service. If you are in a class, however, check with your instructor before using this service, because using the service consumes credits that must be purchased.
Dual-range maps, available from the Census Bureau’s TIGER/Line data and from vendors, are widely used for geocoding but are limited by only having house numbers on the left and right for the beginning and end of each one-block-long street segment. Consequently, addresses within blocks are linearly interpolated (for example, 150 Main St. is plotted halfway along the street segment with ranges 100 to 198 and 101 to 199) and are not exact locations.
Generally, not all source data records are matched when geocoding. A performance measure for geocoding is the percentage of source addresses that get matched and plotted using the reference data. To compute match rates, you should subtract all records in source data that are not addresses (records that are blank, do not start with a house number, are not street intersections, and so on) from the total number of addresses in the source data used as the denominator for the match rate.
Unfortunately, there is no way to judge if a match is truly correct. Organizations that critically depend on geocoding (such as 911 emergency calls for services from police, fire, and ambulance responders) review nonmatches and incorrect matches to improve their maps and procedures for obtaining correct source data from callers. The sensitivity analysis in assignment 8-3 on the book resource web page offers some insight into match accuracy. In that assignment, you loosen thresholds in matching rules (changeable through tool parameters) until matched addresses added to previously matched addresses are identified clearly as errors. In general, the default settings for locator files perform well in the sensitivity analysis.
Tutorial 8-1: ZIP Code geocoding
In this tutorial, you will geocode survey data collected by a Pittsburgh arts organization that holds an event each year attended from across the three-state region of Pennsylvania, Ohio, Maryland, and beyond. To save space on your computer’s hard drive, these exercises will use only ZIP Code polygons from the three states mentioned, plus West Virginia (the relevant region for Pittsburgh) instead of the entire country (which takes 0.5 GB of disk space for ZIP Codes).
Open the Tutorial 8-1 project
- 1.Open Tutorial8-1 from Chapter8\Tutorials, and save the project as Tutorial8-1YourName.
- 2.Use the Region bookmark. The AttendeesPARegion.csv table is the source data for geocoding, PARegionZIPPoints (center points of ZIP Code polygons) is the reference data, and PARegionZIP has corresponding ZIP Code polygons. AttendeesPARegion.csv has a numeric ZIPCode field, and reference layer PARegionZIPPoints has text GeoID10. Some ZIP Codes of the region start with “0,” which were not included in the source data’s numeric version, so the remedy was to calculate ZIPCodeNum from GeoID10 in the reference data, which is a numeric field and drops leading zeros.
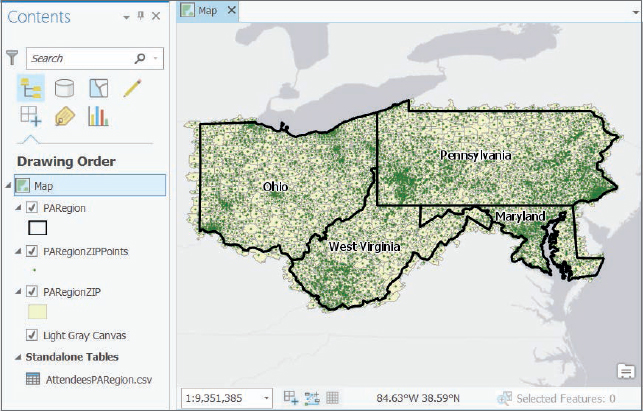
Build a ZIP Code locator
Recall that a geocoding locator is a set of files that stores parameters and other data for the geocoding process.
- 1.Search for and open the Create Address Locator tool.
- 2.Complete the tool parameters as shown.
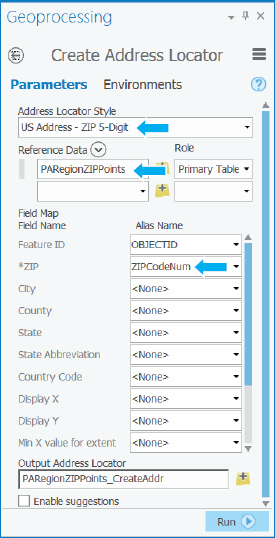
- 3.Click Run, and when the tool is finished, close the Geoprocessing pane.
- 4.Open the Catalog pane, expand Locators, right-click PARegionZIP_CreateAddressLoc, click Locator Properties, and click Geocoding options. For example, minimum match score was mentioned in the introduction to this chapter. For each matching problem detected, the geocoding algorithm subtracts penalty points from a starting score of 100. When the algorithm finishes scanning for problems, if the score is 85 or larger, as set here by default, the minimum match score rule is passed. You can change the minimum match score, minimum candidate score, and spelling sensitivity threshold scores to adjust (tune) the fuzzy-matching process and make the process more conservative or liberal. High values are conservative (fewer match errors allowed), and low values are liberal (more match errors). Throughout the tutorials, you’ll leave the properties at their defaults as seen here. You can change them in the sensitivity analysis of assignment 8-3 available on the book resource page.
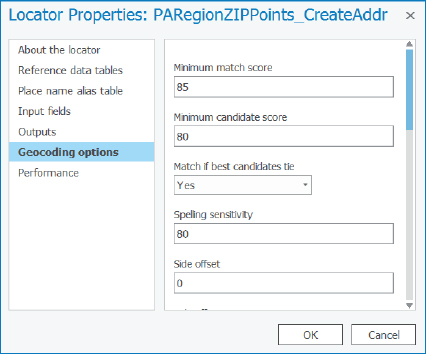
- 5.Close the Address Locator Properties window, and hide the Catalog pane.
Geocode data by ZIP Code
- 1.Open the AttendeesPARegion.csv attribute table. The table has 1,123 survey responses, and if you sort by ZIPCode and scroll down, you’ll see no records with missing ZIP Code values. Records with missing ZIP Codes were deleted.
- 2.Close the table.
- 3.Right-click AttendeesPARegion.csv, and click Geocode Addresses.
- 4.In the Geoprocessing pane, complete the tool parameters as shown.
Important note: Do not select https://geocode.arcgis.com/arcgis/rest/services/World/GeocodeServer or any other such URL for Input Address Locator unless you have permission from your instructor or employer. The organizational account that you are using would be billed for using the geocoding service, and you might be billed!
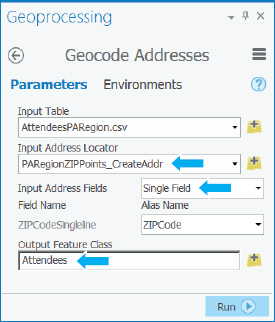
- 5.Click Run. After the tool runs, the completed pop-up window shows that only three unmatched records remain.
- 6.In the Completed pop-up, click No for start rematch process, and close the Geoprocessing tool when the rematch process finishes.
- 7.Turn off PARegionZIPPoints, and symbolize Attendees with a red circle 3, size 5 pt. Each matched source address is plotted at a ZIP Code centroid. Although only one point is visible per ZIP Code, generally many points are on top of each other.
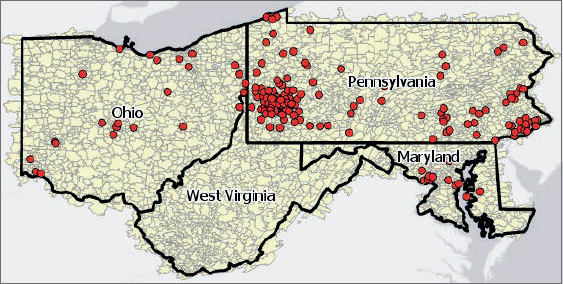
- 8.In the Contents pane, open the Attendees attribute table. For Status, use Sort Descending. Only three of the 1,123 records are unmatched with Status, U (yielding a 99.7 percent match rate). The three records have street addresses, cities, and states, so you can look up ZIP Codes at the US Post Office website (search for ZIP Code lookup in your web browser). The first unmatched record has an incorrect ZIP Code value in the survey, 15230. The value should be 15213. The other two records have correct ZIP Code values, but the reference data, PARegionZip, does not have polygons for those ZIP Codes. The US Census Bureau’s ZIP Code maps are approximations of US Postal routes, and likely the two missing ZIP Code polygons are the result of construction methods for estimating ZIP Codes (you can search for “zip code maps us census” on the Internet to read about ZIP Code construction methods).
- 9.Close the table.
Rematch attendee data by ZIP Code
The match rate, 99.7 percent, is extremely high and well above the threshold for any marketing decisionmaking or other management purposes, so the Attendees map could be used without any changes. But for practice, you’ll rematch and match to 100 percent. You’ll correct the ZIP Code in one record, and then pick approximate points for the two ZIP Codes that are not in the reference data (in practice by looking them up elsewhere).
- 1.In the Contents pane, right-click Attendees, and click Data > Rematch Addresses. The first unmatched record comes up with the incorrect ZIP Code, 15230.
- 2.In the Rematch Addresses pane, for Complete ZIP Code, type 15213, and press Tab. The new ZIP Code yields a candidate with a perfect score of 100.
- 3.Click the Match button
 . That record is matched and mapped.
 - 4.Turn off PARegionZIP, change the Basemap to Streets, and zoom into the lower-left corner of Pennsylvania and then into Pittsburgh. There is no problem if you cannot find the location indicated on the map. Any location will do for the sake of learning how to pick a point from a map for geocoding.
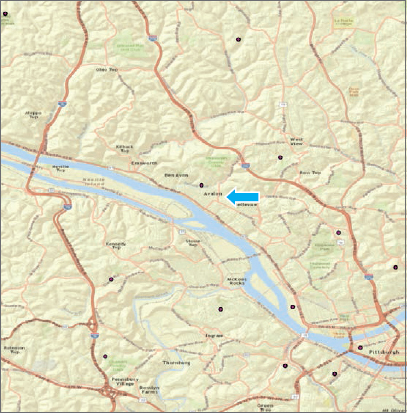
- 5.In the Rematch Addresses pane, click the Pick From Map button
 , and click the map approximately at the point directed by the arrow, as shown in the figure in step 4.
 - 6.Click the Match button. The record is matched. If your map zooms out, zoom back in to the location picked to see that the point was matched and is on the map.
- 7.Use the Region bookmark.
- 8.Similarly, match the remaining unmatched record to any location in the Scranton area in eastern Pennsylvania. This work is just for practice, so it’s not important which point you pick.
- 9.Click the Save edits button
 , and in the pop-up window, click Yes.
 - 10.Close the Rematch Addresses window, and save your project.
Symbolize using the Collect Events tool
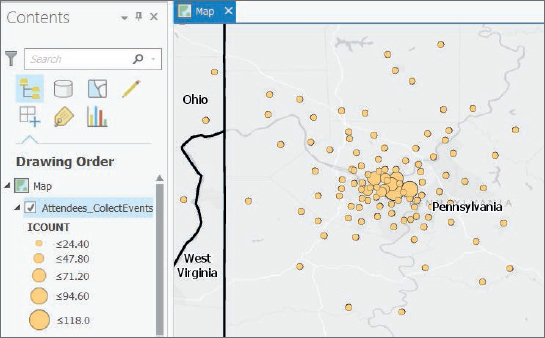
Now you have attendees’ survey data geocoded to ZIP Code centroids, generally with many attendees at center points of ZIP Codes. For symbolizing attendees, next you will count the number of attendees in each ZIP Code and plot size-graduated symbols, with symbol size increasing as the number of attendees increases. You could do this work manually in a couple of steps, but the Collect Events tool will do the job in one step.
- 1.Turn off Attendees, change the basemap back to Light Gray Canvas, and use the Region bookmark.
- 2.Search for and open the Collect Events tool.
- 3.Select Attendees for Input Incident Features, and leave the output name as the default value.
- 4.Run the tool, and close it after it finishes.
- 5.Zoom into the southwest corner of Pennsylvania where Pittsburgh is located. Although you could change the symbology of the output to better portray the spatial distribution of attendees, Collect Events has done the hard work of counting by ZIP Code and applying size-graduated symbols. Note: If the Collect Events tool fails to run, save and close your project, saving all edits. Then reopen and run the tool again.
- 6.Save your project.
Tutorial 8-2: Street address geocoding
This tutorial starts with the data from tutorial 8-1 but only includes records that have street addresses and are in Allegheny County, which includes Pittsburgh. Allegheny County is the local market for the arts event, and more detailed location data on attendees is desirable for marketing there. So you’ll geocode by street address to place a unique point on the map for each attendee in the county. You’ll use the same workflow as with ZIP Code matching: build a locator (but this time using street centerlines as the reference data), geocode the source data of survey respondents, and rematch some of the unmatched records.
Open the Tutorial 8-2 project
- 1.Open Tutorial8-2, and save the project as Tutorial8-2YourName.
- 2.Use the Allegheny County bookmark. You are seeing 92,430 blocklong street segments on your map in Allegheny County.
Build a street locator
- 1.Search for and open the Create Address Locator tool.
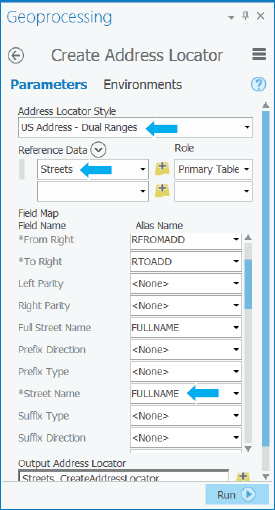
- 2.Complete the tool parameters as shown in the figure.
Note that the locator you are building is called “dual-range locator” because the address style is dual ranges. The data records of this address style have the beginning and ending house number for both sides of the street, both the even- and odd-numbered sides.
The tool automatically finds all but one of the essential fields needed for geocoding (indicated by *) from the reference data. Select FullName for Street Name. Scroll down in the field map to see that the tool found ZIPL and ZIPR, ZIP Codes on the left and right side of each street segment. Streets on the borders of ZIP Codes have different ZIP Codes, hence the left and right ZIP Code fields. Street names are unique in ZIP Codes and in cities. Allegheny County has many cities, and several of these cities may have streets with the same street name and street numbers, such as a “100 Main Street.” Including a ZIP Code in the matching process guarantees that you will find the correct Main Street and location.
- 3.Click Run, and when the tool is finished, close the Geoprocessing pane.
Geocode attendee data by street
- 1.Right-click AttendeesAlleghenyCounty.csv, and click Geocode Addresses.
- 2.Complete the tool parameters as shown.
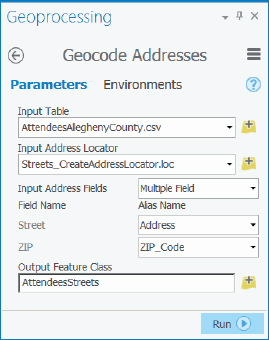
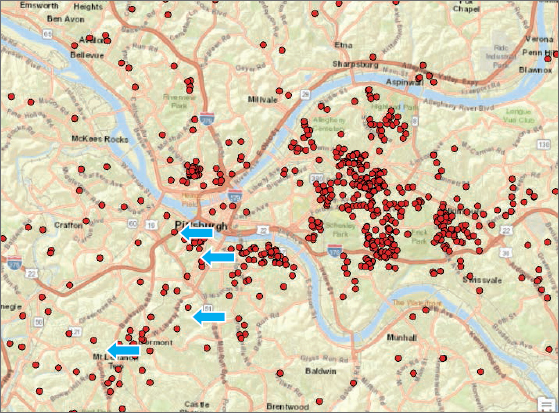
- 3.Run the tool. A total of 861 of 932 records are matched for a match rate of 92.38 percent. Note that ArcGIS software developers often tweak the geocoding algorithm with new software releases so that your match rate may be slightly different (higher).
- 4.Click No for Start rematch process, and close the geoprocessing tool.
- 5.Symbolize AttendeesStreets with a bright-red circle 3, size 5 pt.
- 6.Turn off Streets, change the basemap to Streets, and zoom into Pittsburgh. There are obvious clusters of attendees, areas that marketers could turn attention to with billboards, mailings, and so on.
Edit Streets
There are only 67 unmatched addresses to complete (your number may be slightly different depending on your version of Pro). The match is high enough now for marketing decision-making, but for practice, you’ll attempt to rematch nine unmatched records. The research for fixing unmatched addresses is already done and made available in the step 3 table, where Address is the address from the survey data; Comment is the result of research using the US Post Office’s ZIP Code lookup web page, an online mapping website, and the TIGER Streets attribute table; and Rematch is the action determined to be taken. As you go through the tutorial, you will use this workflow and table as references:
- 1.Edit the TIGER map attributes.
- 2.Rebuild the locator (to take into account the data revisions).
- 3.Proceed on a case-by case basis with the Rematching tool to skip bad addresses, edit address data, or pick from the map.
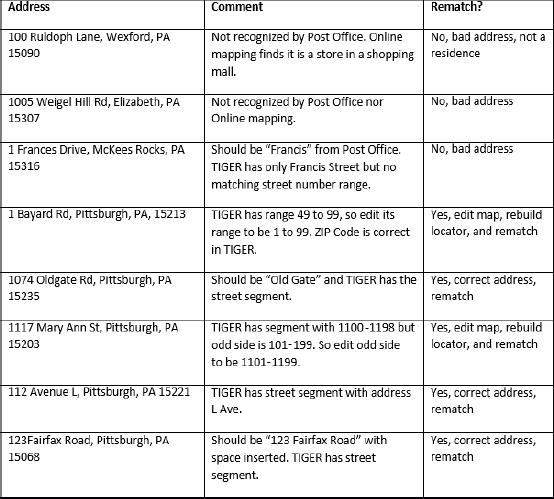
- 4.Open the Streets attribute table, and sort ascending by FullName.
- 5.Scroll to find Bayard Rd.
This road is only two blocks long. You’ll just edit the first row that has house number ranges 49 to 99 and 2 to 4. Given the survey address of 1 Bayard Rd, it’s reasonable to modify the LFromAdd field value from 49 to 1 and keep the value 99 for LToAdd. For the same row and RFromAdd and RToAdd fields, use values 2 and 98, respectively.
- 6.Make the edits just mentioned, pressing Enter after each typed change to complete entry.
- 7.Under the Edit tab, click Save > Yes.
YOUR TURN
Make edits for Mary Ann St, Pittsburgh, PA 15203 as noted in the table. Save your edits. Make sure that no streets are selected.
Rebuild the locator
Considering that you just changed the street attributes used in geocoding with the Streets reference data, you must rebuild the streets locator to incorporate the changes.
- 1.Search for and open the Rebuild Address Locator tool.
- 2.Select your Streets_CreateAddressLocator locator file, click Run, and close the tool after it finishes.
Rematch attendee data by streets
- 1.Right-click AttendeesStreets, and click Data > Rematch Addresses.
In the Rematch Addresses pane, the unmatched addresses are presented in the same order as the table you previously used. First up is 100 Rudolph Lane, which according to the research results in the table, is a bad address.
- 2.Click the next button
 .
. - 3.Because the next two records (1005 Weigel Hill Rd and 1 Frances Drive) are bad, click Next a few times until you get to 1 Bayard Rd.
This record has a perfect match score, 100, because of the street map editing you did earlier.
- 4.Click the Match button. The record gets matched, and the next unmatched record is displayed, 1074 Oldgate Rd.
- 5.Edit the value in the Street or Intersection field to insert a space between Old and Gate.
- 6.Press Tab (for a perfect match), and click the Match button. The address 1074 Old Gate Rd now has a perfect match because of your map editing.
- 7.Press the Match button to match 1117 Mary Ann St, now with a 100 score because of the street editing you did.
- 8.Click the Match button for 112 Avenue L. Although the match score is 82, less than the threshold of 85, this is clearly the correct address. The name, “Avenue L,” is confusing for the geocoding algorithm because the name “Avenue” is also a street type.
- 9.Match 123Fairfax Road by typing a space between 123 and Fairfax.
- 10.Click the Save Edits button at the bottom of the Rematch Address pane, click Yes, close the Rematch Addresses tool, and save your map.
Tutorial 8-3: Alias tables
You will likely find place-names instead of addresses for some records in a table that is supposed to have street addresses. For example, instead of typing “15 Federal St,” Pittsburgh, police commonly enter the place-name, “PNC Park,” the name of the Pittsburgh Pirates’ baseball stadium at that location. For cases with place-names, ArcGIS Pro’s geocoding algorithm can use an alias table, which you must create to have ArcGIS Pro replace aliases with street addresses. You can easily data mine unmatched records in geocoded data for place-names (sort by address and look for place-names). Then, with a number of place-names in hand, you must look up their addresses and create a table with place-names in one column, addresses in a second column, and ZIP Codes in a third column. You can use Microsoft Excel or Notepad to do this work.
Open the Tutorial 8-3 project
Suppose that the map you are about to open of Pittsburgh’s central business district (CBD) is for a food-catering service that delivers lunches to the area’s business employees. The catering service needs a master layer of its customers’ businesses to create the best routes for cutting delivery costs (you’ll solve such problems in chapter 13). In this tutorial, you will take the preliminary step of setting up delivery stops. Note that the data here has relatively few records, so you could edit the source data directly to replace place-names with correct addresses. Alias tables pay off when you have hundreds or thousands of records to geocode regularly. In those cases, automatically replacing place-names saves time and work.
- 1.Open Tutorial8-3.aprx from Chapter8\Tutorials, and save the project as Tutorial8-3YourName.aprx.
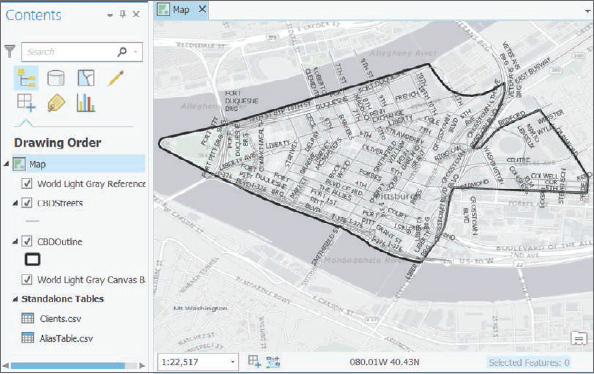
- 2.Use the Pittsburgh CBD bookmark. This map has street centerlines, the same as in Tutorial8-2, except that they have been extracted for the Pittsburgh CBD neighborhood.
YOUR TURN
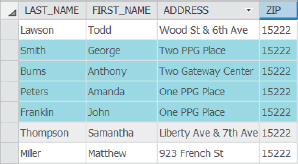
Create a dual-ranges locator, named CBDLocatorNoAlias, using CBDStreets as the reference data and Clients.csv as the source data. Remember to look down the field map and select FullName for Street Name. Then geocode Clients.csv to produce a point layer named ClientsNoAliases. A partial listing of Clients.csv is shown. The selected four records have place-names (names of buildings) instead of addresses and are the only records that will not geocode at this time, because you’re not yet using an alias table. Check to see that the four highlighted records are the only ones not matched, as shown.
Build a locator with an alias table
The figure that follows has the contents of Alias.csv. If you geocoded this table, you’d find that all three addresses match. So you can expect that geocoding with this alias table will result in 100 percent matches for the client data.

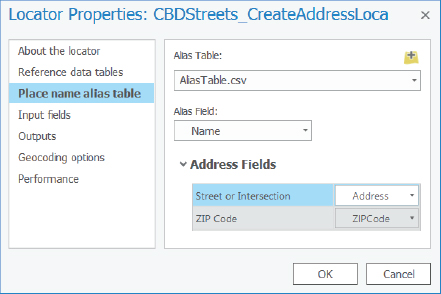
- 1.In the Catalog pane, expand Locators, right-click CBDStreets_CreateAddressLoca, and click Locator Properties.
- 2.In the left panel, select Place name alias table.
- 3.For the alias table, navigate to Chapter8\Data, select AliasTable.csv, and click OK.
- 4.Make the selection as shown, and click OK.
YOUR TURN
Geocode the Clients.csv using the CBDStreets_CreateAddressLoca locator to produce ClientsAliasTable. You’ll find that 100 percent of the clients’ records match, which is what you’d need to carry out optimal routing of deliveries. Between doing the research to rematch source records and alias tables, you can always geocode 100 percent of records that have usable addresses. When you finish, save and close your project.
Assignments
This chapter has three assignments to complete that you can download from this book’s resource web page, esri.com/gist1arcgispro:
- Assignment 8-1: Geocode grocery stores in Allegheny County.
- Assignment 8-2: Reverse geocode a random sample of points representing stops for Meals on Wheels kitchen siting.
- Assignment 8-3: Conduct a sensitivity analysis of parameters for geocoding.