CHAPTER 12
Operations management with GIS
Graffiti Mapping System
LEARNING GOALS
- Get an introduction to operations management systems.
- Create tasks to prepare data for an operations management system.
- Build a ModelBuilder model to be used in a task.
- Share web layers in ArcGIS Online for use in an Operations Dashboard for ArcGIS® operation view.
- Create an ArcGIS Online map for use in an Operations Dashboard operation view.
- Create and use an Operations Dashboard operation view.
Introduction
Up to this point, the book has dealt primarily with GIS applied to one-time projects in which spatial data is collected at one particular point in time and used in GIS to help solve a problem or shed light on an issue. For instance, the GIS in chapter 1 addressed the issue of geographic access to urgent health care clinics in parts of Pittsburgh with low-income populations. Although the GIS could be updated with new data over time, no organization or system was envisioned to continue the work.
In contrast with a one-time project, operations management applies to organizations that deliver goods and services. Operations signifies continuous work to provide goods and services to customers. Such work generates and depends on demand data for goods and services. Management refers to the oversight function for efficient, timely, and responsive delivery of demanded services. An operations management system is an information system with supporting computer applications. A significant feature of such systems is that they process and use a continuous flow of demand data, in contrast with projects and one-time data collection. Because demand data is often spatial with point locations of demands, operations management systems often include GIS.
In this chapter and chapter 13, you will build two GIS-based operations management systems for graffiti. In this chapter, you build the Graffiti Mapping System to help police identify patterns of serial graffiti artists, apprehend the artists, and prevent future graffiti. The operations management system you’ll build in chapter 13, the Graffiti Removal System, is for the public works employees who remove graffiti from public surfaces, such as buildings, walls, and bridges. The system performs optimal routing for graffiti removal at several locations during a work shift. Optimal routing determines the sequence of stops at graffiti sites to minimize travel time.
In this chapter, you’ll create tasks, a ModelBuilder model, and an Operations Dashboard operation view that police will use as their main tool to prevent graffiti. First, it may be helpful for you to review this information:
- Tasks are stored, reusable workflow guides that load commands and manage map views and layers, thereby reducing mouse clicks and overhead. Task processing and output are consistent and reliable, regardless of who does the work, because of the prepackaging and instructional steps of tasks.
- Tutorial 10-3 introduced ModelBuilder and models. A model automates a workflow consisting of two or more geoprocessing or analysis tools that become the processes of the model. Each tool/process is an algorithm that transforms inputs into outputs. Processes are strung together, with the output of one process becoming the input of another process. Therefore, instead of searching for and running tools one after the other on your own, you run a sequence of tools with one press of a button in a model.
- Operations Dashboard for ArcGIS is an app for monitoring and reporting operations data over time. An operation view has one or more maps, plus additional data displays such as statistics, charts, and queries.
The system in this chapter and the one in chapter 13 use 311 data as inputs. Increasingly, citizens of American cities request nonemergency public services using the phone number 311, which is also the name of the one-stop, gateway department for providing such services. Besides calling 311, citizens can often use a 311 website to record calls for service. The 311 system automatically sends service calls to responsible city departments such as police, public works, building inspection, and animal control to provide requested services. The reports of citizens asking for graffiti removal are a major kind of 311 data. This chapter uses 311 graffiti call data from Pittsburgh, but specific graffiti locations are random to protect data privacy.
Suppose that police determine that 12 weeks (84 days) of data is sufficient for identifying serial graffiti artists. For raw data input to the Graffiti Mapping System, assume that the Pittsburgh 311 system exports a CSV file with the most recent 84 days of graffiti data each time you need to produce a weekly map.
Included in the CSV data are the longitude and latitude of each graffiti location, seen as X and Y in the sample data that follows. Graffiti artists are not known by their actual names, but rather by monikers such as Phase III or Tommy T, as seen in the Artist attribute. Graffiti_Type_Code has code values Tag, Throw Up, and Piece, which are standard categories of graffiti. Tag is the simplest graffiti, with just the sign or moniker of a graffiti artist, generally with only one color. Throw Up is quickly painted graffiti with some graphic features in addition to a tag and generally with a few colors. Piece is complex graffiti, a “piece of art,” with several colors.

Tutorial 12-1: Create tasks for the Graffiti Mapping System
A task item is the container that has a set of related tasks. Each task has one or more steps.
You’ll create a task item named Prepare Graffiti Data for ArcGIS Online for the weekly preparation of data for the Graffiti Mapping System. The task item has two tasks, Prepare Data and Publish Web Layers, and the multiple steps in ArcGIS Pro.
The Prepare Data task has steps to enter a date in a feature class named Heading and create a feature class named Graffiti. Heading is a point feature class with a single point. The point has a date attribute, also named Heading, which stores the end date of the 84-day time window of graffiti data to be mapped. Every week, when you produce a new graffiti map, you must edit this date to be the current end date of the time window. The dashboard you’ll build will display this date so that the user can learn the vintage of the map’s data. The second step creates and symbolizes the Graffiti feature class from the 84-day XY data table provided by the city’s 311 system.
Prepare data
- 1.The Enter Date step opens the Heading attribute table and guides the user in editing the Heading date value.
- 2.The Save Edits step saves the edited date.
- 3.The Create Graffiti Feature Class step runs a ModelBuilder model that you’ll build in this tutorial named Graffiti Data Import, which adds raw CSV data as an XY event layer to the ArcGIS project, creates the Graffiti feature class with projected Web Mercator coordinates from the XY data, and symbolizes the Graffiti layer using unique values by graffiti type.
Publish web layers
- 1.The Share Web Layers step publishes the Heading and Graffiti web layers to your ArcGIS Online account. After you publish the web layers and they are added to an ArcGIS Online map, you can incorporate them into an operation view for analysis by police and other city officials who work on graffiti prevention.
- 2.The Share Heading Web Layer step publishes the Heading web layer.
- 3.The Share Graffiti Web Layer step publishes the Graffiti web layer.
You’ll build the model of the Create Graffiti Feature Class step. Then you can create the tasks and steps of the task item from start to finish with no interruptions.
Open the Tutorial 12-1 project
- 1.Open Tutorial12-1 from Chapter12\Tutorials, and save it as Tutorial12-1YourName.
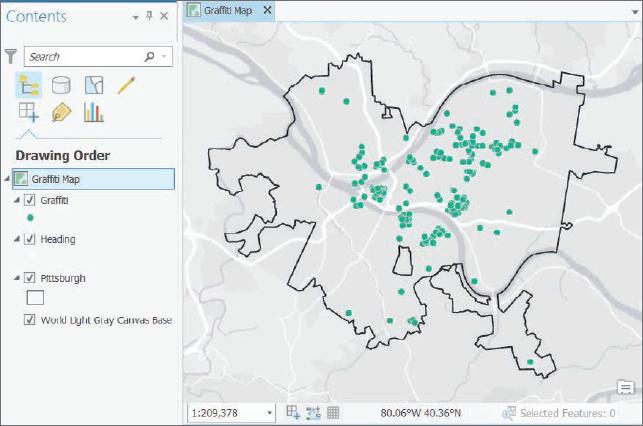
- 2.Use the Pittsburgh bookmark. You’ll build a ModelBuilder model in this exercise for creating and symbolizing a Graffiti feature class from XY event data. The opening map already has a Graffiti feature class added because the model needs an existing Graffiti feature class for its symbolization process to function. Creating a new Graffiti feature class will replace the starting Graffiti feature class and symbolize it using unique values for different types of graffiti. The current Graffiti layer in the map is symbolized with a single symbol so that you can see that the model works and changes symbology to unique values.
Build the Graffiti Data Import model
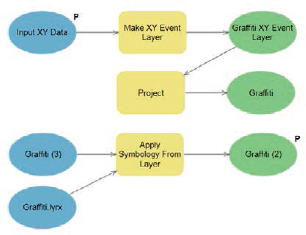
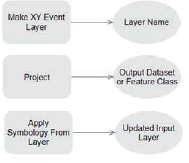
When you build a model, you search for needed geoprocessing tools and add them to the model, at which time they are called processes. The model you’ll build in this exercise, as seen in the next figure, has three processes. The first process imports the raw x,y data for a map into a map layer. The second process projects the map layer from latitude/longitude geographic coordinates to Web Mercator coordinates that are preferred for ArcGIS Online. The third process symbolizes Graffiti. Note that Graffiti, Graffiti (2), and Graffiti (3) all refer to the same feature class, Graffiti. ModelBuilder model inputs and outputs must have unique names in the model; therefore the (2) and (3) are created by ModelBuilder for Graffiti in different parts of the model.
- 1.On the Analysis tab in the Geoprocessing group, click the ModelBuilder button
 . An empty model opens in edit mode, ready for you to add tools as processes.
 - 2.On the Analysis tab, click Tools, and in the Geoprocessing pane, search for (but do not open) Make XY Event Layer.
- 3.Drag the Make XY Event Layer tool to the top of the Model window.
- 4.Similarly search for and add the Project (Data Management Tool) tool below the Make XY Event Layer tool.
- 5.Search for and add the Apply Symbology From Layer tool below the Project tool, and close the Geoprocessing pane when finished.
- 6.If needed, rearrange the tools as shown in the figure.
- 7.On the ModelBuilder tab in the Model group, click Save.
Configure the Make XY Event Layer process
- 1.In your model, double-click the Make XY Event Layer process to open its Parameters and Environments pane.
- 2.Click the Browse button on the right of the XY Table field, browse to Chapter12\Data, and double-click Graffiti20160603.txt. Graffiti20160603.txt is the raw CSV data from a 311 system. ArcGIS Pro automatically identifies and adds the X and Y Fields, X and Y, as well as the correct spatial reference of GCS_WGS_1984 (geographic, latitude and longitude). Note that Spatial Reference is for the current coordinates of the x,y data.

- 3.Click OK. The process and its input and output diagram elements now have color fill, indicating that the process is configured, valid, and ready to use.
- 4.Right-click the input, Graffiti20160603.txt, ellipse, click Rename, replace the existing name by typing Input XY Data, and press Enter.
- 5.Right-click the input again, and click Parameter. Making any input or output into a parameter allows you to search for the input data or name and locate the output when you run the model.
- 6.Rename the output ellipse Graffiti XY Event Layer.

Configure the Project process
- 1.Double-click the Project process.
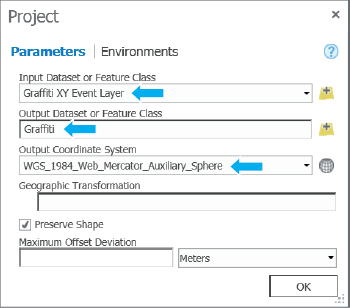
- 2.Make selections or type the selections as shown. For Output Coordinate System, click the Select Coordinate System button
 , expand the Coordinate System tree to Projected Coordinate System > World > WGS 1984 World Mercator (auxiliary sphere), and click OK.
- 3.Click OK.

Configure the Apply Symbology From Layer process
- 1.Double-click the Apply Symbology From Layer process.
- 2.For Input layer, select Graffiti.
- 3.For Symbology layer, browse to Chapter 12\Tutorials\Resources, select Graffiti.lyrx, and click OK.
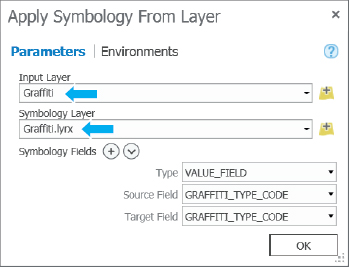
- 4.Click OK.
- 5.Right-click the output of the Apply Symbology From Layer process, Graffiti (2), and click Parameter. Making process map output a parameter allows you to rename it at run time (which you will not do in this case) and also adds the output to Graffiti Map when run from the user interface that ArcGIS Pro provides.
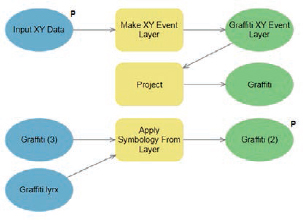
- 6.Right-click the same output, and click Add To Display. This option adds the output Graffiti layer to the map when the model is run in edit mode. You can run models, or parts of models, in edit mode to debug errors.
- 7.Save and close your model.
Rename and run the model
- 1.Open the Catalog pane, expand Toolboxes > Tutorial12.tbx, and rename Model as Graffiti Data Import.
- 2.In the Catalog pane, right-click Graffiti Data Import, and click Edit. The model opens in edit mode.
- 3.Hide or close the Catalog pane.
- 4.On the ModelBuilder tab in the Run group, click Run. After the model runs, the old Graffiti layer is replaced by the newly imported and projected Graffiti layer, and the new layer is symbolized with unique symbols by graffiti type. Also, the process elements in the model now have drop shadows, indicating that they have been run. If you need to run the model again in edit mode, you must click the Validate button in the ModelBuilder Run group, which removes the drop shadows. If you are diagnosing a model, you can run it step by step by right-clicking each process in turn and clicking Run. Often, it’s useful to add outputs to display temporarily to help diagnose problems.
- 5.Close the Model pane that has processing information. If there were any errors, they would be in red font in this window and include diagnostic information. Next, you’ll rerun the model using its user interface.
- 6.Review Graffiti Map to see that it has new data and symbolization.
- 7.Click the Graffiti Data Import tab. On the ModelBuilder tab in the Run group, click Validate.
- 8.Save and close the Graffiti Data Import model.
- 9.In the Catalog pane, right-click Graffiti Data Import, and click Open. In this model interface, the user can browse for the needed graffiti x,y data. By naming the input file with the date in YYYYMMDD format, the files can be sorted chronologically, making it easy to find the latest file.
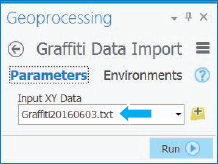
- 10.Click Run, and when the model finishes, close the Geoprocessing pane. The model runs like any other geoprocessing tool.
- 11.Save your project.
Tutorial 12-2: Create tasks to import graffiti data
Next, you will create the Prepare Graffiti Data for ArcGIS Online task item, its Prepare Data task, and the task’s three steps, Enter Date, Save Edits, and Create Graffiti Feature Class. The task item has a second task, Publish Web Layers, which you’ll create after this exercise. You must have completed tutorial 12-1 and built its Graffiti Data Import model for use in the Create Graffiti Feature Class step.
Open the Tutorial 12-2 project
- 1.Open Tutorial12-2 from Chapter12\Tutorials, and save it as Tutorial12-2YourName.
- 2.Use the Pittsburgh bookmark.
Create a new task item for preparing graffiti data
- 1.On the Insert tab in the Project group, click the Task button
 , and then click New Task Item. The Tasks and Task Designer panes open. You create new task items, tasks, and steps in Tasks and configure them in Task Designer.
 - 2.If the panes are docked, undock them, and move them so that you can see the Contents pane and map.
- 3.Type the information as shown into the text boxes on the Task Designer pane for the task item. Type your name for Author. Note that the document Tasks_Copy_And_Paste.docx in Chapter12\Tutorials\Resources has much of the text that you are instructed to type. So instead of typing, you can open the document and copy and paste to save time.

- 4.Save your project. Saving the project also saves the task item.
Create the Prepare Data task
- 1.In the Tasks pane, click the New Task button
 .
. - 2.In the Task Designer pane for Name, type a. Prepare Data and for Description, type Has steps: 1. Enter Date 2. Save Edits 3. Create Graffiti Feature Class. Ensure that you press Enter after each line of the description to arrange the description as shown in the figure.
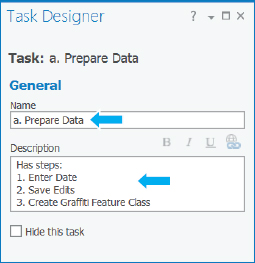
- 3.Save your project.
Create the Enter Date step
- 1.In the Tasks pane, click the New Step button
 .
. - 2.In the Task Designer pane, for Name, type Enter Date.
- 3.For the step instructions, type i. Enter a new date to replace the old date in the Heading field in the Heading attribute table. ii. Press Enter to update the Attribute field. Ensure that you press Enter after each instruction as needed to place the start of the next instruction on a new line.
- 4.For Step Behavior, click Auto Run. Auto Proceed will allow the user to run the step to edit data, and then automatically proceeds to the next step to save the edits.
- 5.In the Task Designer pane, click Actions, point to the command bar, and click the Record button as shown in the figure.

Step 7 will be recorded for automatic use when you run the task later. Notice that after clicking Record, when you point to any open user interfaces, the cursor gets a red circle with a center dot indicating that it’s ready to record a command. After recording a single step (use of a command that accomplishes something), the cursor will revert to its original form.
- 6.Move the Tasks and Task Designer panes so you can see the ArcGIS Pro window.
- 7.In the Contents pane, right-click Heading, and click Attribute Table. The cursor reverts to original form, indicating that recording is finished with a single command (Attribute Table) recorded.
- 8.In the existing row, under Heading, type End Date: June 10, 2016, and press Enter.
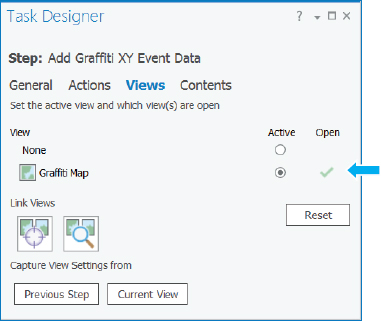
- 9.In Task Designer, click the Views tab, and ensure that Graffiti Map is active and open.
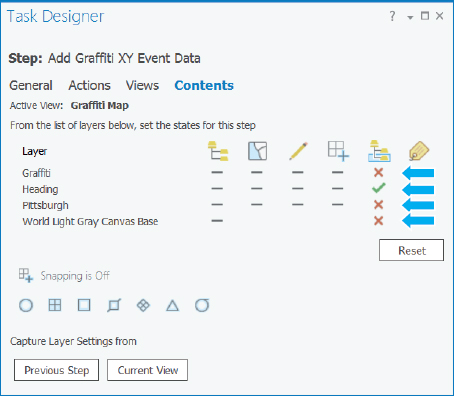
- 10.In Task Designer, click the Contents tab, and turn on layer selection for the Heading layer (click once) and turn off the other layers (click twice). This step ensures that the Heading layer is selected in the Contents pane so that the open attribute table command is applied to that layer.
- 11.Save the project.
Create the Save Edits step
- 1.In the Tasks pane, click the New Step button.
- 2.For Name, type Save Edits; for instructions, type Click Yes and close the table; and for Step Behavior, select Automatic.
- 3.Click Actions, point to the command bar, and click the Record button.
- 4.In the ArcGIS Pro window, click the Edit tab, click Save, and click Yes.
- 5.Close the Heading table, and save your project.
YOUR TURN
Try out your new task. In the Tasks pane, click the Options button  , and click Exit Designer. In the Tasks pane, point to the Prepare Data task, click the blue arrow that appears on the right, and follow your instructions to edit and save the date, entering June 12, 2016, and pressing Enter for the new date.
Create the Add Graffiti XY Event Data step
Adding this step will result in creating a new Graffiti feature class.
- 1.Click the Options button in the Tasks pane, and click Edit In Designer.
- 2.In the Tasks pane, click the New Step button.
- 3.In Task Designer, on the General tab, for Name, type Add Graffiti XY Event Data.
- 4.For Step Behavior, select Auto Run.
- 5.Click the Actions tab, point to the command bar, and click the Edit button.

- 6.For Type of Command, select Geoprocessing Tool, search for and select Graffiti Data Import, and click OK.
The Embed option of the task step exposes the model’s parameter, the input x,y data table, so that the user can browse for the current data.

- 7.Click Done, and save your project. Note that if your project is closed at some point in time, you can open it in edit mode from the Catalog pane under Tasks.
YOUR TURN
Repeat all the steps of the Prepare Data task, repeating the Enter Date and Save Edits steps, and running the new Add Graffiti XY Event Data step. First, change the symbology of Graffiti to Single Symbol so that you can see the added layer (which is the same as the existing layer) get symbolized with unique values. In the Task pane, click the Options button, and then click Exit Designer. Point to the Prepare Data task, and click the blue arrow. Edit the date to be June 3, 2016, which you will need for further work in this chapter, and save the edits. The Add Graffiti XY Event Data step runs automatically, resulting in a new Graffiti feature class in the Contents pane. Click Finish.
Share the Graffiti and Heading web layers
The key to building the operation view in Operations Dashboard later in this chapter is to keep the names of input map layers the same from week to week and run to run. You’ll use “Graffiti Your Name” for the fixed name of the name of the graffiti map layer and “Heading Your Name” for the layer with the current date. Then every time you open a corresponding map in ArcGIS Online, it will open with new data but with the same name over time so you won’t have to modify the map. The first time that you share (publish) Graffiti Your Name and Heading Your Name in ArcGIS Online, the command to use is Share As Web Layer. The second time you share these layers, and every time after that, the command is Overwrite Web Layer, which allows you to overwrite the previous versions with the new ones of the same name. So as a preliminary step, next you will use Share As Web Layer interactively. Then when you create a corresponding task, you’ll use Overwrite Web Layer.
- 1.Save your project, and close the Tasks pane.
- 2.In the Contents pane, right-click Graffiti, and click Share As Web Layer.
- 3.In the Share Web Layer pane, for Name type your name at the end of Graffiti (for example Graffiti Mary Smith), for Item Summary, type Twelve weeks of graffiti data; for Tags, type Pittsburgh and Graffiti.
- 4.Click Publish. Wait a minute or so until the web layer publishes.
- 5.Likewise, share Heading as a web layer, add your name to Name (for example, Heading Mary Smith), and for Summary, type Stores end date of graffiti data, and for Tags: Pittsburgh and Graffiti Date.
- 6.Finally, share the Pittsburgh layer by adding your name to Pittsburgh (for example, Pittsburgh Mary Smith). Then for Summary, type Pittsburgh’s boundary, and for Tags: Pittsburgh and Boundary.
Create the Publish Heading and Graffiti Web Layers task
Currently, the Tasks and Task Designer panes should be closed. You can open or edit tasks from the Catalog pane, as you’ll see next.
- 1.Open the Catalog pane, expand Tasks, right-click Prepare Graffiti Data for ArcGIS Online, and click Edit In Designer.
- 2.Click the New Task button.
- 3.In Task Designer, for Name, type b. Share Web Layers; for Description, type Has Steps: 1. Share Heading Web Layer 2. Share Graffiti Web Layer.
- 4.Save your project.
Create the Share Heading Web Layer step
- 1.In the Tasks pane, with the Share Web Layers task selected, click the New Step button.
- 2.In Task Designer, for Name, type Share Heading Web Layer. For Instructions, type i. In the Contents pane, right-click Heading Your Name, and click Overwrite Web Layer ii. Click My Content, select Heading Your Name, and click OK. iii. In the warning window, click OK. iv. Click Publish. v. When publishing finishes, close the Overwrite web layer window. For Step behavior, select Auto Run.
- 3.In the Tasks pane, click the back arrow button
 .
. - 4.Add a new step to the Share Web Layers task using steps 1 and 2 and replacing Heading Your Name with Graffiti Your Name.
- 5.Save your project.
YOUR TURN
Repeat both tasks, Prepare Data and Publish Web Layers, of the Prepare Graffiti Data for ArcGIS Online task item. First, resymbolize Graffiti with a single symbol so that you can see when the Create Graffiti Feature Class step of the Prepare Data task runs, creating Graffiti again and symbolizing it with unique values. When you run the Enter Date step of the same task, reenter June 3, 2016. When you finish, save your project, and close ArcGIS Pro.
Tutorial 12-3: Create a map for Operations Dashboard
You’ll create a map in ArcGIS Online that will be reused each time new Graffiti and Heading web layers are shared. To run this tutorial, you must have the Graffiti and web layers published in your ArcGIS Online account from tutorial 12-2. You’ll add the published web layers to a map, and then create pop-up windows and bookmarks.
Build the map
- 1.Go to ArcGIS.com, and sign in to your organizational account.
- 2.Click Map on the main toolbar.
- 3.Click the Add Content to Map button
 and then Search for Layers.
 - 4.In the Search for Layers pane, for In, select My Content, and using Find, search for and click Add for Pittsburgh Your Name, Graffiti Your Name, and Heading Your Name. Adding Pittsburgh first makes it the default extent.
- 5.Click Done Adding Layers.
- 6.Change the basemap to Light Gray Canvas. If Light Gray Canvas is not available, select another simple basemap.
- 7.In the Contents pane, expand Light Gray Canvas, click World Light Gray Canvas Reference to expose its More Options button, click the More Options button
 , and click Remove. The labels of the reference layer cluttered the map, so you removed them. Users of the map know Pittsburgh well and do not need the labels.
 - 8.In the Contents pane, drag the Graffiti Your Name layer to the top, drag Heading Your Name below Pittsburgh Your Name, and turn off Heading Your Name. This step makes the legend that you’ll build in Operations Dashboard more compact because you can cover up the bottom part that will have legends for Pittsburgh and Heading, leaving only the legend for Graffiti visible. Also, the Operations Dashboard’s pop-up window that you will build automatically shows data for the first layer in the Contents pane (Graffiti) first, and the user wants to see Graffiti data.
- 9.Save the map as Graffiti Map Your Name with tags Pittsburgh and Graffiti, and Summary of Current graffiti map of Pittsburgh.

Add and configure pop-up windows
Operations Dashboard uses the pop-up windows that you will configure in ArcGIS Online.
- 1.In the Contents pane, click Graffiti Your Name > More Options button > Configure Pop-up.
- 2.For the Pop-up title, type Graffiti.
- 3.Click Configure Attributes, select the check box on the left of Display twice to clear all attributes, and turn on these attributes: Address, ZIPCode, Date_Call, Graffiti_Type_Code, Comment, and Artist.
- 4.Use the vertical arrows on the right of the attribute table to place attributes in the order listed in step 3. To order the attributes, you can select a row to be moved up, scroll to the top of the list, and then click the up arrow.
- 5.Click OK, and click OK.
- 6.Save the map.
YOUR TURN
Click a graffiti point on the map to try out your pop-up window.
Create bookmarks
Operations Dashboard uses the bookmarks that you configure in ArcGIS Online.
- 1.Zoom in or out so that Pittsburgh fills the map.
- 2.Click the Manage bookmarks button
 > Add Bookmark, type Pittsburgh, press Enter, and close the Bookmarked Places window.
 - 3.Zoom in to the Central Business District of Pittsburgh.

- 4.Create another bookmark, this one titled Central Business District.
- 5.Use the Pittsburgh bookmark.
- 6.Save your map, and close ArcGIS Online.
Tutorial 12-4: Create an operation view using Operations Dashboard for ArcGIS
Install Operations Dashboard for ArcGIS
If you haven’t already installed Operations Dashboard for ArcGIS on your computer, you will need to install the software now.
- 1.In your web browser, search for Operations Dashboard for ArcGIS.
- 2.Open that site, and click the Get Operations Dashboard button.
- 3.Follow the instructions to complete installation.
Create a new operation view
A particular dashboard in Operations Dashboard is called an operation view. It has one or more maps and, if desired, one or more widgets. A widget provides additional information about mapped data, such as statistics, a bar chart, or query to select features of a map.
- 1.Open Operations Dashboard on your computer (Start > All Programs > ArcGIS > Operations Dashboard).
- 2.Click Create a New Operation View > Multidisplay Operation View > Create. The Add Widget gallery opens with all available widgets and the Map widget selected by default.
Configure a map widget
- 1.Click OK to add a map to the operation view.
- 2.In the Choose Map window, select Graffiti Map Your Name, and click Open.
- 3.In the Configure Map window, on the Data Sources tab, select Graffiti Your Name and Heading Your Name. Now you can use the attribute data from these two web layers for queries and other purposes.
- 4.On the Capabilities tab, select Show pop-up, Highlight, Pan to, Select, Zoom to, and Feature Pop-ups. These capabilities will be available for maps in your dashboard.
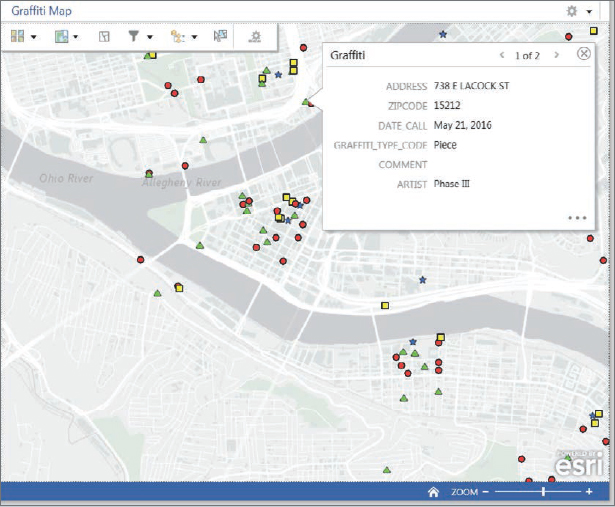
- 5.Click OK. The dashboard shows your map with the map’s name on the upper left.

- 6.Click File. The Save As option automatically opens.
- 7.For title, type Graffiti Dashboard; for summary, type Graffiti calls in the last 12 weeks, and click Save.
- 8.Click the Configure Map Tools button
 on the upper left of the dashboard window, and select Basemaps, Bookmarks, Clear Feature Selection, Layer Filters, Map Contents, and Select Features.
 - 9.Click Close.
YOUR TURN
Try out the Central Business District bookmark and pop-ups you created in ArcGIS Online for the map.
Add a List widget
You’ll use a List widget to provide the date of the map from the Heading layer.
- 1.Click Widgets, click Add Widget, click List, and click OK.
- 2.In the Configure List window, select Graffiti Map–Heading as the Data source, delete New List from Title so that Title is blank, change Max count to 1, and click OK. Heading has only one attribute, named Heading, that must display. The List widget does not display system-generated attributes such as ObjectID and Shape.

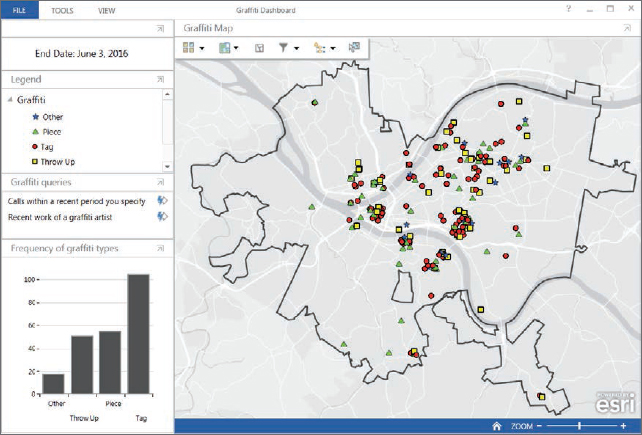
- 3.Dock the widget on the left side of the Dashboard, and adjust the corresponding pane width so that End Date: June 3, 2016 fits on one line. You’ll add more widgets and dock them on the left to fully use that space.
- 4.Save the operation view.
Add a Legend widget
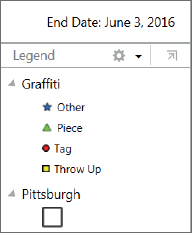
- 1.Click Widgets, click Add Widget, click Legend, and click OK.
- 2.For title type Legend, and click OK.
- 3.Drag the top of the legend under the Heading widget, and click the downward-pointing docking arrow to place the legend below the heading.
- 4.Drag the legend up to just below the date heading.
Add map queries to select graffiti calls
- 1.Click Widgets, click Add Widget, click Query, and click OK.
- 2.For Data source, select Graffiti Map Your Name–Graffiti; for title, type Graffiti queries.
- 3.Click Add. The Query Definition window opens.
- 4.Type the selections as shown.

- 5.Click Add, click OK, and click OK. When you click Add, it moves the query from the design top pane to the completed bottom pane, readying the query for use. You’ll add another query to Graffiti queries, but first you’ll use the query you just built.
- 6.Move the Query widget out of the way of the map, and click the widget’s Execute button
 .
. - 7.Use the calendar to find 5/13/2016, which is three weeks before the end date of the data (6/3/2016).
- 8.Select 5/13/2016, and click Execute. The query finds 67 graffiti calls on or after 5/13/2016.
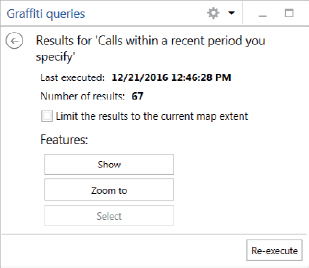
- 9.In the Query widget, click Show, and use the Central Business District bookmark if the map is not already zoomed into that area. You can now see the areas of recent graffiti activity. Because many serial criminals return to the same area, police make the right decision to patrol areas with recent graffiti activity.

- 10.Clear the selection by clicking the back arrow
 in Graffiti Queries.
 - 11.Dock the query below the legend. When rearranging widgets vertically, you can cover up the Pittsburgh and Heading elements in the legend because they do not provide useful information.
YOUR TURN
Click the Settings button for Graffiti queries, and click Configure. Click Add, and add a new query named Recent work of a graffiti artist. Add the same Date_Call query criterion that you added in the previous step 4 (ensure that you select <All types> for Type and “Is on or after” for the operator). Then while still in the Query definition window and with Date_Call still showing in Field, add a second criterion with Field changed to Artist, Operator = Contains, and Value = Tommy with the prompt Enter all or part of an artist’s name. Add the criterion. When you add the criterion, And is selected as the connector so that both criteria must be true for graffiti calls to be selected. Note that for more room to run the query, you can pop it out temporarily by clicking its Pop This Window Out button  . Execute the query with start date 5/13/2016, and artist name DKF. Show and zoom to the selected records. DKF has been active recently painting a tag five times around a Pittsburgh neighborhood. Clear the selection, use the Pittsburgh bookmark, dock the Query widget under the legend, and save your dashboard when you finish.

Add a Bar Chart widget
- 1.Click Widgets, click Add Widget, click Bar Chart, and click OK.
- 2.For Data source, select Graffiti Map Your Name–Graffiti.
- 3.Select or type the values as shown.

- 4.On the Axes tab, click Display labels and grid lines on value axis.
- 5.On the Appearance tab, for Layout, select Columns, and select a dark-gray color.
- 6.Click OK.
- 7.Dock the chart on the bottom of the left pane of widgets, and adjust the heights of the widgets.
- 8.Save your operation view.
- 9.Click Tools > Edit Operation View to take your operation view out of edit mode. Your operation view is now complete. The queries are especially helpful in learning the patterns of serial graffiti artists.
- 10.Close Operations Dashboard.
Assignments
This chapter has two assignments to complete that you can download from this book’s resources web page, esri.com/gist1arcgispro:
- Assignment 12-1: Create tasks to publish a choropleth map for the Graffiti Dashboard operation view.
- Assignment 12-2: Modify and extend the Graffiti Dashboard operation view.