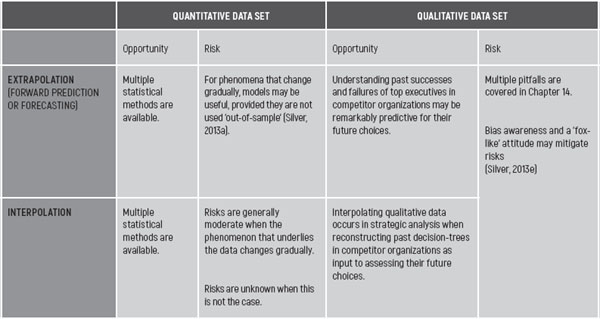
TABLE 11.1 OPPORTUNITIES AND RISKS ASSOCIATED WITH FILLING IN THE BLANKS IN INCOMPLETE DATA SETS
|
INTRODUCTION |
In the previous chapter, I focused on getting the individual input data right. Thus, I discussed at quite some length how to filter out incorrect data from the output of data collection efforts. In the previous chapter I also covered data set completeness. Implicitly it seemed the availability of enough data-points was a given. If only we could grab the rotten apples that may even be fruits of (self-)deception from the basket, we could then assemble a nice basket of data apples. This basket is in fact what we’ve been referring to as a data set. Having thus created a data set, we could actually start processing the data in an analytically sound way. There are, however, at least two questions the previous chapter does not answer:
• What if we do not have enough data in the first place?
• What if we have conflicting data in our data set, but we cannot tell which are the correct data and which are not?
Prior to discussing data set processing at large in chapter 12 , I will give some answers to the above two questions in this chapter.
|
MANAGING |
CAUSES FOR INCOMPLETE DATA SETS MAY BE INTERNAL AND EXTERNAL
Through analysing eight military intelligence failures it has been concluded that denial has a positive correlation with intelligence failure (Bruce, 2008d). Not surprisingly it pays off for companies, or countries, to protect their secrets. The absence of data serves as a prompt for analysts to fill in the data points with assumptions. The failures that have been observed resulted not so much from wrong data but from incorrect assumptions. This results in:
“…the triumph of faulty assumptions over the absence of needed information.”
In the absence of enough high-quality data, getting the analysis right becomes increasingly difficult. Understandably, when collection for whatever reason fails, analysis becomes more challenging. A country’s efforts at denial are the analyst’s worst enemy, but self-denial may be just as effective in preventing good analysis.
Causes of self-denial may vary. Creating a list of such causes isn’t likely to be exhaustive due to the analyst’s lack of the imagination. It is and remains hard to make a list of things that you have not imagined. These unimagined hindrances might include:
• Weak briefings, leading to poor collection plans.
• Poor information sharing among analysts, or between analysts and the organization at large.
• Lack of imagination concerning future competitor (or customer or consumer or supplier or NGO) plans, leading to overlooked collection topics; the most common cause is ethnocentrism (see chapter 14 ).
• analyst complacency – such as failing to collect enough data, when the first data that come in seem to validate a particular view. This is premature closing (see chapter 12 ).
Denial may thus negatively affect the analytic output; having to fill in the blanks obviously carries more risk than working with a largely complete and correct data set. Knowing the power of denial makes an even better case for a company (your company in particular) to:
• Deny critical data to the public, and to competitors where legally possible.
• Deny competitors access to your data by protecting your organization as effectively as possible against competitor intelligence collection efforts.
When, possibly as a result of denial, data are known to be missing, a characteristic strategic analysis dilemma emerges. In the case of known missing data, two approaches form the extremes of the analysts’ options:
• The overcautious approach.
• The overconfident approach.
THE OVERCAUTIOUS APPROACH
When an analyst takes an overly cautious approach, the resulting deliverable sticks to known facts, limits the analysis to a minimum and acknowledges, if not emphasizes in the deliverable, what is known to be unknown. When as a result, however, no decision can be taken by management on the matter at hand, it renders the strategic analysis function rather unhelpful. Management (often unconsciously) thinks that it pays for results rather than explanations, so being offered data rather than conclusions has its drawbacks for the analyst.
THE OVERCONFIDENT APPROACH
The over-confident approach for a strategic analysis department is to analyse “too much from too little” (Bruce, 2008e). Even when data are limited or even random, perceived known solutions to the question at hand may be favoured by the analyst. In the latter case the analyst may implicitly overrate the chance of having found a possible known solution.
In section 10.7 I described the strong human urge to recognize patterns in random data. When an analyst fails to recognize a pattern, he blames himself for not understanding the data, rather than acknowledging that the data may be random or unrelated (Heuer, 1999d). In practice, no matter how limited the data set, an analyst will go to lengths to find a recognized pattern. With the pattern a narrative and a conclusion will follow, offering management, most of all the analyst themselves, the comfort of results rather than explanations.
In analysing too much from too little, analysts may in the process also overestimate the consistency in the thinking (or the execution quality) of the outside company whose next steps they aim to predict. Decisions in companies are taken by groups of humans. Such groups are neither always consistent, nor always rationally acting in their group’s best interest. They may simply make mistakes. Luck, either good or bad, may affect the outcome of their decisions. Strategic analysis, no matter how professionally executed, will never be an exact science when it tries to predict the probabilities of fundamentally unpredictable events.
In conclusion, whether a pattern really applies will only become clear when sufficient and critical data is made available. In analysing too much from too little, the analyst may be able to initially please management with firm conclusions. The pleasure, however, may not last when conclusions later prove to be wrong. So, what to do?
THE SITUATION REPORT
When the proverbial fog of war is still thick, an analyst should stick to situation reports (McLaughlin, 2008b). Such reports emphasize what data are known rather than what those data mean, although the latter should be included as well. Situation reports should also contain add-ons – that we’ll categorize as the late, the possible and the impossible forms of add-ons – to the data set:
• Late
A timing roadmap that spells out when facts/analyses will be available to management; for example; MASINT analyses from a laboratory that may still take time to complete.
• Possible
A list of perceived critical unknown data that so far have proved impossible to find. Indicate why data have not been found and what options are being pursued to find them. Also indicate the chances of a positive outcome and, when applicable, provide the related cost.
A list of what perceived critical unknown data are unlikely to legally become available at all.
The combination of known facts, a sense of when additional data will be available and a sense of how the analyst intends to collect missing data provides management with the relevant choices they face at that moment in time. The decision-maker is thus put in a position to do exactly what she is supposed to do: make a decision. On the question at hand, management may choose to either make a decision now or to wait for more data to become available. The latter may require allocating budget to intensify collection efforts – perhaps by buying a report that may contain perceived critical, yet previously unknown data.
With both overcautious and the overconfident approach, the data set as such remains unchanged. Data-sets, however, may in some cases be expanded by an analyst, provided the expansion is well-documented and is executed methodically. In doing so, the analyst starts to fill in the blanks.
FILLING IN THE BLANKS
Filling in the blanks means that the analyst thinks he has a reliable model of the truth of the matter at hand that can be safely applied to describe the reality. With the output of his model firmly in hand he (often implicitly) believes it to be accurate. Or, at least, accurate enough to allow the model to generate data that may replace real but missing data without jeopardizing the quality of the subsequent analytical output. It is obvious that modelling phenomena that are by definition not fully understood is not without risk (Box, 2005):
“All models are wrong. Some models are useful.”
Models are at best predictive constructs of reality, but never represent reality itself. 1 Filling in the blanks as a method to combat data denial has its inevitable risks. These risks vary along two dimensions: interpolation or extrapolation, and quantitative or qualitative data sets. Table 11.1 summarizes both the opportunities and the risks of filling in the blanks. Filling in the blanks in a data set and forecasting are methodologically comparable and are for practical reasons discussed simultaneously in this section.
Consider a quantitative data set such as that given below. This data set may represent net sales of a competitor over time in (€) millions. Assume it is now July 2013. The year-to-year sales data would look like this:
|
2008 |
€174 million |
|
2009 |
€183 million |
|
2010 |
… |
|
2011 |
€196 million |
|
2012 |
€209 million |
|
2013 |
… |
|
2014 |
… |
For the interpolation of the 2010 figure it looks like a safe bet to use a linear growth model. It should be recognized that this is done in the absence of contextual data. This makes it risky: the bet may look safer than it is. In this case, the 2010 net sales are estimated at €190 million (183 + (196-183)/2, rounded off). However, the forward prediction of the net sales for 2013 and 2014 will be even less straightforward. To discuss extrapolations, I would like to take you on a trip to the wonderful world of mediocristan and extremistan, created by Nicholas Taleb (Taleb, 2007a).
DISCERNING BETWEEN MEDIOCRISTAN AND EXTREMISTAN REQUIRES CONTEXTUAL DATA
For foward-looking predictions, we first have to distinguish between mediocristan and extremistan. In mediocristan, change is gradual. A great example of mediocristan is the population size of a country. It will neither shrink by half nor double from one year to the next, lacking large-scale disasters, or fertility or migration booms. For extremistan, there is no such certainty. In extremistan, a parameter may change by any percentage up or down the next year. Share prices of some companies typically dwell in extremistan. They may shrink by half or double the next year, subject to unpredictable investor appetite – or a sudden investor dislike – for the stock. Parameters in extremistan are unpredictable as models. Company shares, like commodities, are traded on markets. Most of these markets are firmly situated in extremistan. This may relate to the fact that price developments at these markets are dominated by herd behaviour. The herd may move, but it is hard to say whether there will be movement, and if there is, when it might occur. However, once it does, the whole herd will move. This herd phenomenon I believe to be part of the human condition. It has been described by the Nineteenth Century writer Mackay (Surowiecki, 2005a). To put it mildly, Mackay did not hold the collective judgment that is driving the herd in high esteem:
“Men, it has been well said, think in herds. It will be seen that they go mad in herds, while they only recover their senses slowly, and one by one.”
It is this madness in extremistan that fundamentally makes it impossible to predict herd-related phenomena using models. Or, to use another metaphor, madness is the root cause of the proverbial black swan that may variously bring good luck or bad luck [Taleb, 2007b].
The first question for the forward prediction of the net sales of the competitor is now: will the competitor in 2013 and 2014 be in mediocristan or in extremistan? Predicting the net sales is straightforward when assuming mediocristan, but much less so when assuming extremistan. 2
Statistical tools are great, but qualitative contextual data are in these cases critical for choosing the prediction to be made, based on the assumptions and tools. The relevance of such contextual data is commonly stressed (Pollack, 2004]); (Makridakis, 1990); (Guszcza, 2012):
“Context is crucial to understanding any intelligence assessment. No matter how objective the analyst may be, he or she begins with a set of basic assumptions that create a broad perspective on an issue; this helps the analyst to sort through evidence.”
“In cases where the data are messy, incomplete, ambiguous and/or of limited quantity, considerable institutional knowledge, domain expertise and common sense is needed to effectively make sense of it.”
Another way to describe the critical need for contextual data in strategic analysis and business strategy development is to refer the soft underbelly of hard data (Mintzberg, 1998):
“Much information important for strategy making never does become hard fact.”
The message is thus that in strategic analysis, quantitative data can be reliably predicted only when qualitative contextual data are presumed to be reasonably well known and when these data are not affected by biases. 3 Too often, forward predictions are implicitly assuming mediocristan. Without elucidating the implicit assumptions, the prediction is purely like-for-like, to use the accountancy term. Unfortunately, like-for-like or mediocristan is rare in most human activities (Taleb, 2007c).
The relevance of obtaining contextual qualitative data, even for quantitative predictions, has been stressed (Silver, 2013f). As a forecaster, Silver always looks for a mix of quantitative and qualitative contextual data, with the latter being highly valued. The broader he can source qualitative contextual data, the more he is able in his forecasting profession to develop a broad consensus view. This is a smart approach in strategic analysis. Broad is here defined as ‘multi-disciplinary’, rather than as an increase in the number of different but comparable specialists being consulted.
In the latter case, when looking at, for example, forward sale predictions of listed companies, reviewing the opinions of different financial analysts working at different investment banks has clear merit. Doing so provides what could be called a ‘specialist consensus’. Alas, the financial press understandably, but still erroneously, tends to refer to this as the ‘consensus forecast’. It is not that financial analysts do not tend to take a relatively uniform view on the companies they cover. Still, in their lives they probably have accumulated relatively similar experiences (education, job environment, culture, etc.), over time. Therefore, regardless of the investment bank they work for, they all may have a similar personal bias profile (see section 10.4 ). For strategic analysis predictions, there may be less safety in numbers when reviewing a large set of financial analyst’s assessments, rather than when contextual data have been made available from a broad range of people with markedly different backgrounds and experiences.
ON FOXES AND HEDGEHOGS
In table 11.1 , inspired by Silver, I suggest the importance of always being on the lookout for fox-like forecasters (Silver, 2013e). Foxes implicitly also play a positive role in the work of Pareto. 4 The author Silver has borrowed his fox analogy via Tetlock and Tolstoy from the ancient Greek poet Archilochus:
“The fox knows many little things, but the hedgehog knows one big thing.”
In section 10.7 I already pointed to the commonalities between forecasting, extrapolations and strategic analysis of a business environment. This merits reviewing why foxes are better forecasters than hedgehogs. The fox and his antipode the hedgehog are described by Silver both in the quote below and in the intermezzo at the end of this section:
“Foxes […] believe in a plethora of little ideas and in taking a multitude of approaches toward a problem. They tend to be […] tolerant of nuance, uncertainty, complexity, and dissenting opinion. Foxes […] are gatherers.
Hedgehogs […] believe in Big Ideas – in governing principles about the world that behave as though they were physical laws and undergird virtually every interaction in society.”
In other words: the fox is pragmatic and the hedgehog is ideological and principled. Having one’s own principles and beliefs take centre stage, whilst ignoring a xenocentric view of the competitor is a recipe for trouble when filling in the blanks in a data set. This applies to filling in the blanks for both missing quantitative and missing qualitative data. The risk of a being a hedgehog not only plays a role in filling in missing data, but it unfortunately applies broadly in strategic analysis, and even beyond strategic analysis in generic decision-making (Dörner, 1996a).
Silver stresses that a fox is not only a smart gatherer, sourcing a broad a spectrum of sources, a fox also displays his pragmatism in the nature of his forecasts or deliverables and in his attitude towards those forecasts (of filled-in blanks). A fox recognizes that forecasts like hypotheses in science last until they are proven wrong. In communicating his forecast, he stresses rather than disguises this fundamental truth.
COMMUNICATING AS A FOX REQUIRES LINKING PROBABILITIES TO FILLING IN THE BLANKS
A foxy way to communicate is to offer a probable estimate in a forecast. By weighing all the evidence, chances of the following outcome materializing are x%. In military intelligence, this is common practice, but it is less common in strategic analysis of a business environment.
There are issues related to factoring out probabilities. When communicating a fixed number as a percentage, unjustifiable and thus disputable accuracy may be implicitly suggested. On the other hand, qualitative statements like ‘most likely’ or ‘likely’ may be interpreted differently by the customer of the analysis compared to the reporting analyst. Subject to customer needs, percentage ranges (for example 30-50%) may be a way out of line.
Stated probabilities not only serve as a disclaimer to refer back to when outcomes differ from forecasts, 5 but also as a reminder to decision-makers that new, critically different data may always materialize and change previously held views.
Having communicated the forecast with such a disclaimer, the fox can subsequently adapt his forecast and communicate a possibly changed update to management without losing face. This is a better practice than to mute and reject the data in order to deny them and spoil the earlier forecast – and even worse, the analyst’s credibility with it. In summary, filling in the blanks – and predicting in general – is thus a feasible process in strategic analysis, but it is not one without risks and flaws, most of which are manageable when taking the above considerations to heart.
MISSING DATA AS A BLESSING
Medina gives an elegant twist to missing data (Medina, 2008). She portrays analysis as the craft of making sense of data sets that are fraught with missing and possibly partially incorrect data. When correct, critical data are available in full, the capabilities of an analyst would not be tested. As a result, actually the analyst may lose interest in the job. In conclusion, the analyst should rejoice in missing data.
Analysts, however, do not need to worry any time soon that missing or incorrect data will no longer occur, if not prevail in typical data sets (Bruce, 2008c). Always recognize that some countries, by definition, will be impenetrable. Think of North Korea or some African countries that as nations have so clearly failed that they are countries in name only. Think also of secretive, family-owned companies, some of which have perfected denial.
Predicting the intent of state actors will remain challenging in the foreseeable future. The same is true for non-state actors like NGOs, whose plans may not always be friendly to business. Data collection in such cases will remain difficult. Think of obtaining reliable economic statistics regarding emerging countries or market sizes, or even worse, market share data, that pertain to such countries. The available data may be, and in most cases will almost certainly be, of undeterminable quality.
To properly fill in the blanks the analyst must thus take a xenocentric view. With a xenocentric view, the analyst pays particular attention to the stranger’s data, and carefully scrutinizes what the stranger will do next, and why. The better the capabilities/competencies of the stranger’s data are known, the easier it is to take their hand of cards and play it. That is: play it their way, living in their shoes and imagining having their wallet in your pocket.
INTERMEZZO: ON FOXES AND HEDGEHOGS
Table 11.2 below is reproduced in full from the literature as it so elegantly and usefully describes foxes and hedgehogs in analysis and forecasting (Silver, 2013e).
|
HOW FOXES THINK |
HOW HEDGEHOGS THINKS |
|
Multidisciplinary: Incorporate ideas from different disciplines, regardless of their origin on the political spectrum. |
Specialized: Often have spent the bulk of their careers on one or two great problems. May view the opinions of ‘outsiders’ skeptically. |
|
Adaptable: Find a new approach – or pursue multiple approaches at the same time – if they aren’t sure the original one is working. |
Stalwart: Stick to the same ‘all-in’ approach – new data is used to refine the original model. |
|
Self-critical: Sometimes willing (if rarely happy) to acknowledge mistakes in their predictions and accept the blame for them. |
Stubborn: Mistakes are blamed on bad luck or idiosyncratic circumstances – a good model had a bad day. |
|
Tolerant of complexity: See the universe as complicated, perhaps to the point of many fundamental problems being irresolvable or inherently unpredictable. |
Order-seeking: Expect that the world will be found to abide by relatively simple governing relationships once the signal is identified through the noise. |
|
Cautious: Express their predictions in probability terms and qualify their opinions. |
Confident: Rarely hedge their predictions and are reluctant to change them. |
|
Empirical: Rely more on observation than on theory. |
Ideological: Expect that solutions to many day-to-day problems are manifestations of some grander theory or struggle. |
|
Foxes are better forecasters |
Hedgehogs are weaker forecasters |
TABLE 11.2 ATTITUDES OF FOXES AND HEDGEHOGS
|
MANAGING |
The equally dreadful opposite of managing incomplete data sets is managing over-complete data sets. Over-completeness is not defined as having more data than needed. That is almost by definition the case in strategic analysis. Over-completeness is defined as having conflicting data in a data set.
OVER-COMPLETENESS IN QUANTITATIVE DATA SETS
In quantitative data sets, conflicting data may occur when, for example, two different sources report different net sales figures for what looks like the same company, and for what looks like the same financial year. In sections 10.3 to 10.5 , individual input data quality has been discussed. The first recommended step is to distinguish between probable reliabilities of the different available sources. When an original company press release is one source, and the other is a press clipping showing a different figure, the latter figure may safely be rejected and ignored. Primary sources generally outweigh secondary sources in terms of reliability.
When sources at first sight have similar reliabilities, e.g. two press clippings of expected similar reliability it is recommended to think of root causes that may explain the difference, prior to manipulating the data or randomly rejecting a source. In this rather common example, root causes for finding different figures for what looks like the same thing may include (list inevitably not exhaustive):
• Different legal entities e.g. a parent and a group figure of the same company .
• Different reporting periods (a quarter or year).
• Differences in the scope of business consolidation, for example reporting only ‘ongoing businesses’ in one source and all businesses in the other. A common difference is that net sales in the annual report of year x differs from net sales for year x reported in the annual report covering year x + 1. In such a case, in the report for year x + 1 the year x net sales figures have been restated, allowing comparison with the year x +1 figures (generally used to making the company look better, otherwise the re-statement would usually not have been executed).
• To an incongruous book year that in one of the two sources has been made to fit like-for-like with a calendar year.
• Different accountancy standards being used. Nestlé, for example, adopted new corporate accounting standards in 2012, making all Nestlé sales comparisons with the years before that essentially impossible, except when analysing it, diving into the fine print of their reports.
• Different definitions of sales. Lactalis in its limited public disclosures always reports gross sales. In a successful bid to further increase confusion, a 2012 prospectus by Lactalis to potential bond investors reported their net net sales (this is neither a typo nor a joke).
• Currency changes. One source may have translated the sales figure in a different currency (without specifying this). Another source may have used the end-of-book-year currency exchange rate, whereas yet another source has used a year-average exchange rate.
Checking one’s own assumptions as an analyst always has merits. A New Strait Times press clipping reporting $200 million net sales will probably refer to Singapore dollars, not US dollars as might have been expected. Similar discrepancies are also possible between US, Canadian, New Zealand and Australian dollars. The Cape Verde currency, to mention an exotic example, is also represented by the ‘$’ symbol. In Cape Verde, however, the symbol is put behind the number to help avoid confusion.
When there is no indicator pointing to higher reliability of the one or the other source, the ultimate way to reconcile the issue is to choose one of the two figures, to use a range bordered by the two figures, or even more pragmatically, to use the average of the two figures. There is no single best approach, apart from at all times keeping note of potential reliability issues associated with this data point.
OVER-COMPLETENESS IN QUALITATIVE DATA
For qualitative data, reconciling conflicting input data in a data set is also required. In this case, a typical example is one source postulating that company ABC will sell its business line PQR, whereas another source postulates that business line PQR is strategic to ABC.
This example also calls for a reliability assessment of both data points, taking into account the source, the channel and the analyst’s own perspective. All questions proposed in the respective sections of chapter 10 will be needed. A good analyst will intuitively review his own assessment biases, as described in section 10.4 , to ensure the comparative reliability assessment of both sources is done without inadvertent personal or cultural bias.
By the end of this section, the quality assurance tests of the individual data points or raw materials have been completed. Let us revisit the glass production metaphor we used earlier. Begin with the assumption that batches of input data or raw materials that did not meet the test have been rejected. The data set is sufficiently complete. Missing blanks data in the set have, where needed, been filled in by sufficiently high quality replacement raw materials. Superfluous, conflicting data inputs have been removed. The processing can begin; the oven can be fired. During processing, however, analysis may still run into issues, even with tested individual input data and with a data set that is neither incomplete nor over-complete. The next chapter describes some common issues in data processing and how to prevent them from happening in your analysis.