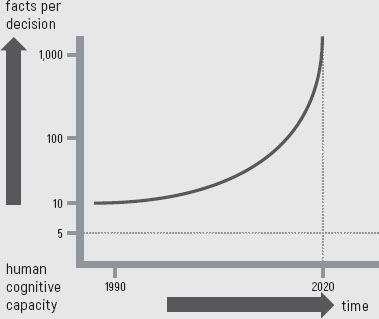
DIAGRAM 12.1 THE EXPONENTIAL INCREASE IN OVER TIME OF DATA AVAILABLE PER DECISION
|
INTRODUCTION |
Behaviour and psychology are intrinsically human, no matter what environment an individual works in. That is great news. This very fact allows for the psychology of human biases to be studied, regardless of the professional field those being examined are active in. A lot of work has been dedicated to the study of biases in relation to military intelligence (Clark, 2007d). In this chapter, I attempt to both summarize these experiences, as well as to apply them to the world of business. Biases are a real and present danger in analysis. In my view, the awareness of biases is invaluable in helping the analyst avoid falling prey to biased thinking.
So much for the good news; there is some bad news as well. I urge you not to overestimate the value of reading this section if you are professionally employed as analyst, either in business or in the military. Being aware, or not aware, of cognitive biases is unfortunately not related to being able to deliver better assessments (Heuer, 1999d). Below I’ve provided a quote by one of the fathers of intelligence analysis, which also illustrates that awareness of is not the same as immunity to biases (Jervis, 2010a):
“The main difference between professional scholars or intelligence officers on the one hand, and all other people on the other hand, is that the former are supposed to have had more training in techniques of guarding against their own intellectual frailties.”
|
WEIGHING DATA |
We all have vivid memories of particular moments in our lives. The actual memory may range from your wedding day to a near-miss car crash. Whatever it was, you still remember it as if it was yesterday. This is great fun in your daily life, but it also may affect your views when you are working in data analysis. This is because the vividness with which you experienced collecting data may tend to affect your judgment as to how relevant a particular data point is in comparison to other data collection which may not have generated such vivid memories. The bias that may thus creep into your analysis is called ‘vividness weighing’. Consider this observation about the potential distorting influence of vividness weighting (Clark, 2007d):
“The phenomenon that evidence that is [experienced] directly is the most convincing.”
Vividness weighting can in three related ways distort a balanced weighing of all data in a data set:
• Personal experience resulting in a personal impression of a case.
• Mixing up persuasiveness with data quality.
• Treating an individual case as separate from a class of similar cases.
In each of these situations, the result is an unbalanced assessment of the question at hand. Below I will discuss these three scenarios in a bit more detail.
PERSONAL EXPERIENCE
Vividness weighing may both affect the individual analyst or the strategic analysis function at large, as well as the decision-maker. An uncomfortable but common situation is that the analyst feels that his decision-maker/customer suffers from vividness weighting.
Think of a solid and thorough analysis on anticipated moves by a competitor. The analysis has been sent as a report to the CEO. Think of a CEO who has personally met his counterpart in this competitor organization. Guess what? No matter how intentionally deceiving the counterpart has been, in the CEO’s mind the counterpart’s message will be seen as the data point with the highest reliability in data sets on this competitor. Strong and dynamic leaders are particularly vulnerable to deception. Think of characters like Roosevelt, Churchill and Kissinger (Clark, 2007d). This is exactly the sort of personality profile many a supervisory board member may consider for their CEO. Once a Churchill-type character has made up their mind, it will take very strong evidence indeed to make them change it. An extra complication is the asymmetric power relationship between the CEO and the analyst. Who is the analyst to speak up against a larger-than-life leader?
After the Cold War ended, many studies reflected on why US President Ronald Reagan, who had dubbed his Soviet adversary ‘the evil empire’ only a few years earlier, had come to amicable terms with his Soviet counterpart, Mikhail Gorbachev. Vividly obtained impressions apparently had been key in bringing about this change, more than just intelligence assessment (Yarhi-Milo, 2014c):
“Reagan, like Shultz [Foreign Secretary George Shultz], would base his judgment on his interactions with Gorbachev and Shevardnadze.
Gorbachev’s behaviour in Washington would loom larger in their minds than any number of intelligence briefings.”
Reagan proved right, regardless of what hawkish CIA briefings told him. Gorbachev wanted genuine change. Together they ended the Cold War. No matter how deceptive and dangerous the vividness bias may be, an analyst should remain humble. Admiral Stansfield Turner, director of the CIA under US President Carter, remarked (Yarhi-Milo, 2014c):
“Sometimes they [decision-makers] have better information than you do.
I mean, whenever I briefed President Carter, I always had to keep in the back of my mind that ‘he met Brezhnev last week’.
I’d never met with Brezhnev, so if I nterpreted what Brezhnev was going to do tomorrow differently than he interpreted what
Brezhnev might do tomorrow, I had to give him credit that may he understood Brezhnev better than me.”
Humility is not the same as complacency. Strategic analysis should always be vigilant and provide business leaders with a second opinion that is based on an objective analysis of (other) facts.
I will discuss the relevance of this in greater detail in chapter 16 . It relates to leadership in business who requires an overdose of optimism in a leader’s character. Optimism and success may breed overconfidence. The result is that an overconfident leader that has vividly experienced a phenomenon will all too easily extrapolate the applicability and ramifications of this phenomenon beyond the boundaries of its actual validity over time or on all occasions. Such a leader is all hedgehog, no fox, to return to the metaphor of chapter 11 . When the hedgehog raises its prickly head, bad decision-making is just around the corner. Analysis of spectacular business failures indeed revealed lack of doubt among top executives as a root cause (Surowiecki, 2005d):
“The remarkable tendency for CEOs and executives […] to believe that they are absolutely right, and the tendency to overestimate the quality of managerial talent by relying on track record, especially in situations that differ markedly from the present […]”
If anything is vividly experienced by a senior leader, it is the leader’s own career, which has allowed for the building of that track record. Obviously, some CEOs are more benevolent than others. Even when the CEO encourages an analyst to speak their mind, the analyst, mindful of the hierarchy, may at times still be excused for approaching the invitation with due caution. A smart jester may bank on being granted absolution when he made jokes about the CEO’s strategy, but the harshest jokes consistently had to be on themselves, if they didn’t want to end up in misery or worse.
The remedy is to be a foxy analyst and hold tight to one’s self-confidence. The analyst now knows that the CEO may, at that moment, have an unbalanced view of the competitor. In response, it would be prudent to lie low. They collect all new incoming factual data about the competitor. When they’re right, as facts gradually emerge showing that the CEO had been deceived, they dutifully report all facts as they come in. No manipulating is allowed at any time, and certainly not when it will impact trust with a top executive! The CEO will, over time, see the facts and will undoubtedly draw their own conclusions, adapting their view to a more balanced one. Analysts should never try to say ‘I told you so,’ but if the urge is too strong, consider thinking it – if that is any relief. If not, the analyst should consider becoming a CEO themselves.
Obviously, an unbalanced view in and of itself is not detrimental, but actions based on an unbalanced view – which has not yet been adapted by thoughtful intervention by the strategic analysis function – may be so.
For an analyst in this situation, the first strophe of the Serenity Prayer by Reinhold Niebuhr, first written in 1943, may be helpful:
“God, give me grace to accept with serenity the things that cannot be changed, Courage to change the things which should be changed, and the Wisdom to distinguish the one from the other.”
Putting one’s faith in a prayer is by no means an excuse for an analyst or a strategic analysis function to throw up their hands and step back. It is, however, essential to realize that responsibility and authority are connected. Taking the right decisions is at the end of the day management’s responsibility and theirs alone. They are authorized by their board to do this. Management also has the sole responsibility to act on balanced data, even when the strategic analysis function does not perceive the data to be balanced. Providing them with the right data to take decisions is the function’s overriding responsibility. For this the function is authorized to use a budget. Mixing up the function’s responsibility with that of the decision-makers is useless. It only unnecessarily increases stress within the function.
PERSUASIVENESS VERSUS DATA CORRECTNESS/QUALITY
As was discussed above, the impact of personally experiencing a conversation with a competitor’s representative may, even unconsciously, increase the relative value attached to a given data point in a data set on this competitor. This is a sub-set of a more general phenomenon. Metadata quality may generally affect, (increase or decrease) the relative value of data points in a data set, or of single conclusions in a range of conclusions.
Metadata can include the source. Source-related weighing is covered in the next section, as it is not related to vividness. Experience-related metadata in the mind of the analyst or the decision-maker are stored in a way that directly links to the form in which data are presented. Persuasiveness, and by implication the vividness of the experience, links clearly with the format of reporting (Clark, 2007d). The following sequence shows how, for the same data, different presenting formats increase in persuasiveness:
• Statistics
• Abstract (general) text
• Concrete (specific, focused, exemplary) text
• Static images
• Videos with moving images
Professional service companies, think of advertising agencies, investment banks and management consultancies, understand the above better than anyone. All too often, your firm’s management may be offered a briefing, or contract a professional services provider to brief them on the business environment. Imagine that in the same meeting the in-house function is also scheduled to present it own strategic analysis findings and recommendations. It’s highly likely that your company’s in-house strategic analysts have analysed more data and have produced a more balanced and objectively more correct view than the outsider. Still, the threat of arrogance is an ever-present danger. Professional service companies may have HUMINT access to other companies that is denied to competitors analysts so, they may have more, and possibly unique, sources.
The professional service company, however, will almost certainly outperform the in-house analysts in terms of their aura of expertise, perceived impact and overall persuasiveness. Using slick slides with strong imagery, and leveraging overconfidence as presentation power and being a fresh new, outside source (see next section), they will, at the end of the joint session, likely have captured 90+% of top management’s confidence and buy-in. This may even be the case when the professional services company has been working from a weaker data set.
The good news is that even when the in-house strategic analysis function feels that it has been overshadowed, outperformed and generally bulldozed by the professional service provider, isn’t necessarily a show-stopper or an issue that cannot be resolved. Chapter 15 (on reporting) provides tips on persuasive reporting, including the importance of using impactful imagery at all times. Moreover, the function should remember that the professional service firm may bring to the table less-than-desirable attributes in the mind of top management. Such attributes may include exceedingly high cost, arrogance, etc. Management’s expectations for these competing advisors – the in-house analysts and the outside consultants – can be very different in such meetings. That, however, is never an excuse for the in-house function to deliver a less-than-stellar presentation. Training in presentation skills is always advisable for a corporate strategic analysis function.
It is advisable, however, to remain cautious in this context. Professional service providers usually share data most openly when they pitch for a project. The quality of the pitch determines whether they win an order. Facts or opinions shared in such pitches tend to be neither balanced nor neutral. That is understandable: the pitch serves a purpose other than neutrally informing management – namely, the firm’s pursuit of a lucrative consulting contract. It is certainly in the in-house function’s interest to make management aware of whatever incorrect or incomplete data may have been provided by the third party. There is no loss of face here; this is just regular strategic analysis function hygiene.
TREATING AN INDIVIDUAL CASE AS SEPARATE FROM A CLASS OF SIMILAR CASES
There is a common human psychological inclination to equate the particulars of an individual case – that often has been vividly experienced – with that of a class of more or less similar cases. This leads to ignoring the statistics available for a group of cases when generating an estimate on an individual case (Kahneman, 2011g).
This bias applies, for example, in the medical profession. Medical professionals, rather than consulting an expert-system database with image analysis techniques, prefer to judge every individual patient’s X-ray images themselves. Their reasoning is that ‘every case is different’. In doing so, they rely solely on the vividness of their personal impressions of a particular case, rather than on a much more neutral, statistically balanced approach with objectively proven better results. Strategy analysts, especially those with many flight hours under their belts, face the same risk. Even when you have seen a lot, it still requires an open mind to see the particulars of an individual case, just as it requires an open mind to prevent conflating the characteristics of a bigger group of cases with a unique specific case.
‘This company will never issue new shares’ may be an analyst’s opinion based on a vividly remembered discussion with a top executive in that company. Still, in 9 out 10 cases, companies in the same liquidity stress situation as the company in question did eventually issue new shares. Weighing the vividness of the particular case heavily biases the analysis. The odds are stacked against the analyst and against the existing shareholders: the new shares may already be at the printer’s.
In summary: to protect themselves against vividness weighing, analysts should ask themselves whether personal impressions, persuasive presentations or over-rating the importance of individual cases have affected how appropriately they have weighted the data in their data set. In section 12.12 the related issue of having too small a sample size to justify conclusions is covered.
|
WEIGHING DATA |
Different sources may, consciously or not, be valued differently by the analyst or the decision-maker. This may lead the analyst or, even worse, the decision-maker to attach more or less value to what could even be precisely the same data provided by different sources. It gets even more complicated when different sources provide conflicting data.
US intelligence officers and senior Bush Administration officials, to cite a difficult example, had strongly differing opinions on the quality of the sources pertaining to Iraq’s WMD programme, prior to the invasion of Iraq in 2003 (Pollack 2004):
“The worst fights were those over sources. The Administration gave greatest credence to accounts that presented the most lurid picture of Iraqi activities.”
The above quote demonstrates the underlying data set assessment bias that mattered most in this example. This is unfortunately a common bias in strategic analysis and in military intelligence: implicitly or explicitly cherry-picking data that suits what the analyst or the decision-maker wants to see (see chapter 17 ). The sources listed in table 12.1 are ranked, from top to bottom, by perceived decreasing value in both strategic analysis for business or military intelligence (Clark, 2007d).
In the boxes of table 12.1 , common considerations are given that may be behind the perceived differences in value attached to different sources.
|
SOURCE |
STRATEGIC ANALYST |
DECISION-MAKER |
|
Results of the decision-maker’s own collection efforts |
Maintaining a job contract has priority over downgrading the data the decision-maker collected (see chapter 17 on Yesmanship). |
Nobody beats me in understanding my business. |
|
Top-notch professional service firm |
When you filter out the jargon and correct for the glossiness, you only see data from a common fee-based syndicate subscription we also have Gov’t. example: US failure to predict the Iranian Revolution in 1979, with the US relying on the Shah’s own biased security service (Bruce, 2008c) |
Have worked with these guys for years – they really understand my challenges in this business. |
|
Hard to obtain HUMINT (Mercado, 2009a) |
Talking to that person was a real hit (ignoring the fact that the person may not have had a complete picture). |
We have inside sources, disregard open sources (Johnston, 2005c) Military intelligence example: Indian nuclear test as surprise to US (Bruce, 2008c). |
|
Any strong narrative that dresses up the bare data |
The story is so good, I identify with the logic and thus ‘buy’ the data: it is too persuasive to be doubted (Lovallo, 2010a). |
(Same view as the strategic analyst). |
|
Anything expensive |
Have to visibly use this material to justify this expenditure; so better take it serious. |
Should be good, can’t tolerate the thought we wasted money. |
|
Fee-based syndicate OSINT |
This is what everyone who matters in this industry already has, so it will not offer a competitive edge. |
This is what the experts say. |
|
Free OSINT |
This is the base, anyone has it; it will not make a difference. |
No major feelings on this. |
TABLE 12.1 PERCEIVED VALUE OF DIFFERENT SOURCES FOR WHAT COULD BE THE SAME DATA (FROM HIGHEST IN THE UPPER ROW TO LOWEST IN THE BOTTOM ROW)
There are different columns for the analyst and the decision-maker for the upper two sources. In the previous section, it was made clear that relative weighing differences may not only occur in the mind of an analyst or in that of a decision-maker. It may also happen simultaneously with both parties, but with different weighting as a result. Inevitably, when that happens, the process and outcome of the analysis gets more political.
The moral of table 12.1 is that the awareness of these often-implicit considerations assists in reaching a more balanced view on weighing sources before conclusions are drawn.
|
WEIGHING DATA |
Analysts have a tendency to rank the most recent data as the most highly valued in a given data set (Clark, 2007d). This boils down to mixing up actuality with relevance and/or value. Analysts are not alone in this behaviour, (Tversky, 1973). Tversky’s study amongst other things covers the topic of favouring the most recent data in a data set. It refers to research on the occurrence and severity of floods:
“Men on flood plains appear to be very much prisoners of their experience. Recently experienced events appear to set an upper bound to the size of loss with which managers believe to be concerned.”
What applies to the population living on a flood plain also applies to financial traders. Research on trading decisions by the University of Chicago points in the same direction (Fenton-O’Creevy, 2000),(De Bondt, 1985). The outcomes of experiments demonstrate, to put it simply, that stock price fluctuations that result from buying/selling decisions are disproportionally affected by recent news and under-proportionally by fundamental underlying values of the stock (e.g., dividend pay-out). This is a clear example of mistaking the noise for the signal.
Psychological barriers apparently compel humans to imagine more than what was recently experienced – to favour the most recent data and/or to overweigh highly memorable events. These barriers have also been referred to as the saliency bias (Lovallo, 2010a).
Such barriers may be a root cause (next to convenience) for a rather visible phenomenon in strategic analysis outputs purchased or obtained from multiple third-party service providers. Rarely do such third-party reports look back more than a few years in, for instance, the history of a company that is being discussed. This statement holds true regardless of whether it concerns quantitative or qualitative data. Most reports are all about recent results and recent transactions. Mixing up actuality with relevance leads to not looking back long enough during collection in the first place. This inevitably results in a higher risk of compiling an incomplete data set. The question is whether the root cause for this is the authors of such short-term view reports. The blame may lie more plausibly with the customers who order them. In management, anything older than a few years, and certainly anything older than the tenure the manager herself has in their current job seems ancient history. It is usually ignored. Management is, so to speak, very much in the moment. With employee job tenures gradually declining in most countries, corporate institutional memory is rapidly dwindling.
Strategic analysis, I believe, needs to take a different view, when time and budget reasonably permit. In the case of qualitative data, taking a long-term view is most relevant when reviewing family- or privately-owned companies. Such companies tend to be less dynamic and less prone to management or strategy changes than their listed and often larger equivalents. Developing an accurate picture of the competences and intent of family-owned companies may require studying a relatively long historical track record. These companies may be seen to have slow dynamics, with just few critical data points available per year. In such cases, a long history is required to reach a balanced data set that allows for solid strategic analysis or for well-reasoned forecasts.
In the case of listed companies, it is rarely necessary to look back more than five to seven years. The maximum relevant time span to look back may be the tenure of the current CEO, when that period is longer than five to seven years. Especially large market cap-listed companies could be viewed as having high dynamics, where more critical data points are available per year. In these cases, a shorter history is sufficient to reach a balanced data set for strategic analysis.
Overvaluing recent evidence is most risky when reviewing the fundamentals of financial performance of a company that operates in a profoundly cyclical industry. This is especially true when the business cycle tends to have a long cycle time (over three years). The risk is to mix up the noise of day-to-day changes with the signal of the longer-term business cycle.
In summary, when in strategic analysis it comes to choosing a historical time-window for data collection that is long enough to avoid valuing only the recent data, qualitative contextual data matters most. In chapter 11 , on managing incomplete data sets, you’ll recall that we placed significant emphasis on contextual qualitative data. This should not come as a surprise, as ensuring a sufficient timeframe for data collection in strategic analysis can help you avoid an unintentionally incomplete data set.
|
WEIGHING DATA |
Several challenges accompany the first data that come in on a new issue:
• The first data that come in may be overvalued in the subsequent analysis.
• The first data usually neither form the true nor the complete story.
• The decision-maker may receive some bits and pieces of data prior to the strategic analysis function and may already have made up his mind.
OVERVALUING THE DATA THAT FIRST COME IN ON AN ISSUE
An analyst may have the reflex to take the first data that come in on a new matter – through whatever channel – as an anchor. Additional data that trickle in later on this topic will be viewed against it. Once the first data trigger an impression, the impression tends to persist; even when later data justify modifying or changing such a first impression (Heuer, 1999k). This is again a common psychological phenomenon, once humans believe they have seen a pattern in the first data, it is hard to erase the weight they place on that impression. That’s why in human contact making a good first impression is critical. This potential bias has some similarities with the potential bias of ‘premature closing’ which will be discussed later in this chapter.
THE FIRST DATA USUALLY NEITHER FORM THE TRUE NOR THE COMPLETE STORY
The issue here is that, especially in breaking news events, the first report is not likely to capture the true story in its entirety (Stewart, 2013). In quickly making sense of myriad detailed data on a breaking event, Stewart recommends trying to look for a pattern as quickly as possible. This recommendation doesn’t need to be pushed: it is what humans naturally do. The analyst’s challenge is to look for a pattern without overvaluing the first data.
Questions that may help to do so include:
• Which data that have come in match with a possible hypothesis x, what with hypothesis y? What data necessitate rejection of hypothesis x or y?
• Which of these hypotheses most likely applies?
• If that hypothesis applies, what evidence that normally is also present in such case now appears to be lacking?
• What does this event have in common with earlier events in a similar context?
Analysts develop such patterns as the result of analysing multiple breaking events – be they security issues, or management briefings/situation reports on competitors or customers.
MANAGEMENT SEES THE NEWS BEFORE THE ANALYST
Breaking news may have reached the decision-maker’s desk (or electronic device) earlier than the analyst’s. The article or broadcast story, as is often the case with first news, may provide data points that neither are fully correct nor fully complete… but the decision-maker has by now received and absorbed it. She may start to make up her mind on the topic (also see below on premature closing) (Cooper, 2005b).
News services and the internet at large pose an ongoing challenge to in-house analysts in a company that strives for a balanced picture. Decision-makers, should they wish to, may become their own analyst. An analyst trying to change a decision-maker’s first impression once it is formed is pulling the wrong string. My suggestion is not to try to change that impression. Make the decision-maker change his own mind by feeding him more balanced facts once they are available. It may take more time. Still, this is the more effective form of change management. Let the manager himself change his view rather than having the analyst try to push him to do so.
Having breaking news come in first to an analyst may create an urge to distribute it – with perhaps a dose of tentative ‘what does it mean’? This has its risks. It may lead to drawing unbalanced conclusions based on erroneous first impressions. These first reports that might later prove wrong may in time hurt the credibility of the strategic analysis function. The first report, as we’ve said, is never the true story. Rather, it’s best to avoid competing for speed and stick to objectivity and balance in reporting.
|
CHALLENGES |
“On the big issues, the experts are very rarely right.” This quote is taken from Peter Wright’s book Spycatcher . This book was upon its release in 1987 – still during the cold war – as controversial as this quote is provocative (Wright, 1987). The book was initially published in Australia, as the UK Government had banned its publication. Wright, a former MI5 counter-intelligence officer, points to the complex relation between experts and military intelligence. As is so often the case, what is true for military intelligence is true for strategic analysis in business; the relevant issues may be different, but not the human dynamics. Wright’s bold assertion may be exaggerated but it holds some truth. Experts, to their deserved credit, are generally useful and tend to be great sources in strategic analysis work. Experts can interpret (combinations of) data that only people with an in-depth knowledge of a subject can. Such interpretations may create new insights that the analyst could never have obtained otherwise. Experts, however, often not only introduce knowledge but also bias (Clark, 2007d). In this section, the usefulness of experts is taken for granted. It is the biases that I wish to focus on next. Knowing the biases, analysts can work with experts even more effectively. A foxy analyst works with many experts rather than with one expert alone, if only to get as balanced an assessment as possibe of what data in a data set may mean.
Common issues in working with experts include:
• Meeting an expert but working with a hedgehog.
• Underestimating the capabilities of other parties.
• Overestimating predictability, even with a good track record of prediction.
• Overestimating the value of expertise in meaningful decision-making.
• Self-fulfilling expert prophecies.
I will now briefly cover, each of these issues.
MEETING AN EXPERT BUT FACING A HEDGEHOG
There are beautiful historic examples to illuminate this bias (Jeffery, 2011c). Jeffery describes how MI6 (formerly the Secret Intelligence Service) before the First World War had inserted well-placed agents into German naval circles. As a result, the UK Admiralty started receiving valuable technical intelligence on innovative German navy concepts. Unfortunately…
“The impact of this work was less than might have been hoped. […] the resistance which much of this reporting encountered in the Admiralty, where the preconceived ideas of some experts led them to question intelligence which stressed the great importance of German developments in torpedoes, submarines, mines and aircraft.”
If, 25 years later, the German naval warfare was to have one edge, it was their submarine fleet.
Analysts themselves may also start to consider themselves subject matter experts. This too has its risks as it may result in hedgehog attitudes. This has been referred to as the ‘mindset trap’ (George, 2008a):
“The more expert the analyst, the more prone an analyst becomes to the ‘mindset’ trap – that is, believing that his or her view of the problem is the best explanation for all behaviour. Yet as many intelligence failures have demonstrated, intelligence experts can become too complacent about their knowledge and too resistant to alternative explanations and thus miss important changes in the international environment or in the attitudes of […] adversaries”
George urges analysts to not become complacent, but rather to keep on testing multiple analyses. Car maker Henry Ford, himself possibly a hedgehog, uttered more generic reservations on experts (Freedman, 2013d):
“If ever I wanted to kill opposition by unfair means I would endow the opposition with experts.”
The lesson from Ford’s quote is that the analysis customer himself is a hedgehog; consider not adopting an expert hedgehog as your ally if you’d like to get your message across more clearly and credibly. Experts have a habit of either really liking or really hating each other. Indifference seems less common. In the former case, the confirmatory bias may come in to play, leading to groupthink (see chapter 17 ). In the latter case, nothing gets accomplished. Think before using experts as a (personal) source – love them or hate them, success in decision-making is not guaranteed.
UNDERESTIMATING THE CAPABILITIES OF OTHER PARTIES
This bias could very well be characterized by the sentiment: “I am an expert; if I can’t do it it can’t be done.” To illustrate this bias, I am pleased to introduce the British Second World War scientific military intelligence manager Reginald V. Jones. Similar to during the First World War submarine example, the Second World War, Jones had serious trouble persuading the British rocket experts that the highly innovative German V-2 rocket – the first ballistic missile ever – could actually work (Jones, 1978b).
Again, innovative German military engineering, even when developed for dreadful purposes, was underrated by less-than-capable experts.
In response, Jones defined the ‘principle of impotence’. When a scientist has performed an experiment and failed to achieve a result, the erroneous but comforting expert conclusion is often that ‘it can’t be done’ rather than ‘I couldn’t do it’. In strategic analysis, the fact that your company failed to launch an innovative concept in a difficult market does not mean that a competitor may not be able to do so successfully. Granted, that may be the strongly-held opinion of the marketing director who failed to get the product sold in this market in the first place).
OVERESTIMATING PREDICTABILITY, EVEN WITH A GOOD PREDICTION TRACK RECORD
Taleb doesn’t claim to be an expert (Taleb, 2007c). He does, however, offer opinions on a broad range of topics, not the least on prediction. In that context, he provocatively suggests a segmentation of selected disciplines where experts, in his opinion, do indeed exist and other disciplines where those claiming expertise are by definition suspect (Taleb, 2007f). According to Taleb, individuals who tend to be legitimate experts include chess masters, astronomers, accountants, physicists and mathematicians, as long as they don’t do empirical work. So-called authorities who tend not to be bona fide experts include stockbrokers, councilors, economists, financial forecasters, personnel recruiters, clinical psychologists and intelligence analysts.
Taleb’s central thesis is that experts can only reliably predict matters in mediocristan, the quiet country defined in chapter 11 . As soon as a discipline enters extremistan, on the other hand, forward predictive expertise is suspect if not a downright illegitimate.
There are indeed worrying results of empirical research in which expert predictions were tested against the reality that later emerged. In predicting future political events, experts had barely done better than random guesswork, regardless of their occupation, experience or sub-field (Silver, 2013e); (Peterson, 2008). Interestingly enough, some experts did better than others. An inverse proportionality seemed to exist between experts who were cited most frequently in the media and the quality of their predictions. This research led to the segmentation of forecasters into hedgehogs and foxes, as was presented in chapter 11 .
Taleb could have written the mandatory disclaimer in consumer advertisements for financial services like investment funds: ‘Returns obtained in the past do not provide a guarantee for the future.’ What is true for investment services is just as true for experts’ or anyone else’s predictions of the future. A strong track record of successful past predictions may not, in itself, be an indicator of the upfront credibility of new predictions by the same (expert) source for events that are yet to come. Doing so in and of itself is a bias – when an expert insists upon the reliability of a prediction about future events based solely on her previously-good track record, it is called the ‘Champion Bias’ (Lovallo, 2010a). Having an expert with, a good track record may be a relief to an analyst, but strategic analysis for business is not about an analyst’s personal sense of comfort and relief. Former Intel CEO Andy Grove put it well in a quote that is directly applicable to strategic analysis (Grove, 1996b):
“Success breeds Complacency; complacency breeds failure; only the paranoid survive.”
OVERESTIMATING THE VALUE OF EXPERTISE IN DECISION-MAKING
This bias is illustrated well in a spectacular business failure by one of the best companies in the FMCG space: the 1985 introduction of New Coke. Long-time American business executive Donald R. Keough was president of the Coca-Cola Company through the New Coke disaster. Following that dreadful experience, he is understandably reluctant to praise experts and their vaunted advice. In his book The Ten Commandments for Business Failure , experts have earned a chapter (Keough, 2008b). Keough postulates that when failure is the objective…
“Put all your faith in experts and consultants.”
He suggests, with a potential bias, that all the blame for the New Coke disaster was due to an unquestioning (albeit surely uncomfortable for the illustrious old brand) reliance on so-called experts’ assurances about how well the new-tasting Coke would be accepted by consumers. As we now know, the New Coke debacle went down in history as one of the biggest business fiascoes of all time..
In retrospect, it’s clear now that Keough and his leadership team should have asked the inverse analysis question, “Why shouldn’t, rather than why should, a great company like Coca-Cola launch New Coke?”
DECEIVING BY NARRATIVE
Experts might better be defined not as people with extraordinary subject matter, but rather as people who are able to come up with a superior, more credible narrative than non-experts, even when data availability is limited (Guszcza, 2012). Here’s one way to look at the power of senior-level business experts’ story-telling abilities:
“Their seniority lends them an air of authority, and indeed part of their success might be attributable to their charisma and ability to convince their colleagues with their narrative accounts.”
The above narrative skills may explain why some experts are highly appreciated in the media. An interesting question is whether the better storytellers, who may appear prominently in the media, have less success with their strategic business predictions, as mentioned earlier in this chapter. The implication would seem to be that more capable storytellers, due to their persuasive strengths, tend to be more self-confident. As a result, even if they start out as a fox they may end up as a hedgehog. This speculation might be an avenue for further research. For the analyst, the conclusion is that however good the experts’ narrative is, the self-proclaimed expert will always remain foxy.
SELF-FULFILLING EXPERT PROPHECIES
There is another relevant bias that relates to expert predictions. This bias deals with the self-fulfilling nature of some of their predictions. 1 When an expert inspires a herd of people to follow him – based on an irresistibly appealing prediction – that prediction may, through sheer power of persuasion, actually come to pass.
Moreover, the relationship between experts and analysts may vary culturally. This adds a final dimension to consider in this section. In Japanese culture, 2 and possibly German/Austrian culture, experts are, or at least have been, treated with more respect than, for example, in the Anglo-Saxon culture, where business success may well be valued higher than subject knowledge. Foxiness works in all cultures. So does respecting experts when they deserve it.
|
MIXING UP DATA |
MORE DATA DOES NOT MEAN BETTER DATA – ONLY FEW ARE EITHER USED OR NEEDED
Intuitively one would suspect that, in theory, more data should lead to better predictions (Silver, 2013h). Empirical evidence, however, suggests otherwise (Makridakis, 1990):
“More information merely seems to increase our confidence that we are right without necessarily improving the accuracy of our decisions.”
Analysts, by nature, tend to overestimate the number of data points that they should ideally use in an analysis. Even in a large data set, only a limited amount of data are really used to reach conclusions (Heuer, 1999j). Moreover, data over-abundance has its intrinsic practical limitations. It is easy for strategic analysts – and any of us, really – to not see the forest for the trees. Data overload has in the past elegantly been referred to as (Wohlstetter, 1965b).
“[an] embarrassing riches of data.”
Wohlstetter also refers to the signal and the noise in data. 3 Signals are data that point to a competitor’s (or customer’s or supplier’s) planned or already-executed action, or to a latent or explicit customer need that your company may be able to serve in a better way than your competitors. Think of noise as extraneous data points that may distract you from making sense of the data that truly matter to your work.
As you focus on customer needs, try to separate relevant signals from confusing noise by asking ‘Essential Questions’ (Frank, 2011c). The proposed questions focus on asking what might go wrong.
So, noise is defined as the background clutter data that may be irrelevant, inconsistent and/or pointing in the wrong direction. At the very least, noise is distracting. In the cases of Pearl Harbor and the Cuban Missile Crisis, the signals were there. They were, however, hidden amidst an abundance of noise. Some noise had deliberately been sent by the adversary, some simply was there, but some had also been inadvertently created within the US intelligence community itself. Inadequate modelling of Japanese and Soviet behaviour prevented analysts from better distinguishing the important signals from the overwhelming amount of noise. The same applies to the tragedy of 9/11 (Bruce, 2008c).
The flow of the intelligence assessment – fortunately for the world – worked well in the Cuba Missile Crisis (Wohlstetter, 1965c). The intelligence chief with final responsibility for the assessment was Lieu-tenant-General J.F. Carroll, head of the US Defense Intelligence Agency (DIA). From a staggeringly overabundant data set he ultimately synthesized a hypothesis based on only three or four (!) data points of evidence. This nicely corroborates the above statement that analysts, regardless of how many data they have, actually use a small number of data-points. Carroll had this hypothesis tested by having aerial reconnaissance flights scheduled over an area that he postulated to be a possible Soviet rocket-launching base in Cuba. The photos proved him right: a Soviet rocket launch base was indeed under construction. The photos also proved a point that is even more important to this book. Carroll possessed a great skill – the ability to filter critical data out of noise and the persuasiveness to make the relevant intelligence customer (President John F. Kennedy) decisively act upon them.
For an analyst, the lesson is that even when one has abundant data, a small, crisply focused sub-set is generally all that’s necessary. This scary fact may resonate with you as reader. If you are fair to yourself, ask how many data you really use to draw a conclusion, irrespective of how many data you have or can get.
Filter the critical data out of the abundance and ensure to use these critical data. This brings me to the question, what are critical data?
Today, having many data does not equate to having actionable data (Frank, 2011b):
“At some point in almost any business project, you’ll be confronted with far more data than you need. The data you want, however, should lead to clear, actionable information with no ambiguity.”
The challenge of extracting good data from a large data set also matters in another civilian area that only require critical data: administration of justice. The parallels with strategic analysis and the administration of justice may look less obvious at first sight. Yet, in the latter, the defense attorney may also face a tremendous data set. Some data points may incriminate the accused; others may be noise and thus irrelevant. If only the defense attorney can find a single critical data point in the evidence, she can seed reasonable doubt of guilt in the minds of the jury. 4
This is why it matters to identify the critical data in your data set (Bruce, 2008e). Critical data, in line with the criminal-justice example, are those pieces of evidence in a data set that when removed make a theory crumble to pieces. Such data may also be called ‘diagnostic’. A warning is needed here. It is great to have distinguished critical, diagnostic data in a data set. However, when attempting to build a theory on only a few data points, the analyst needs to be sure of the quality of these selected points, otherwise critical analytic failures are just around the corner.
Analysts should not overestimate their ability to filter critical data out of a data set (Makridakis, 1990). In empirical research, subjects too often use the irrelevant data in a data set, overlooking those that matter the most.
Examples of critical data being overlooked due to information overload have been vividly described (Gladwell, 2005). One particularly striking example concerns predicting the duration of a couple’s marriage. Knowing a couple for a long time does not make us better predictors of the chances of divorce. No matter how much we think we know from observing a couple’s behaviour, we have only seen what they wanted to show and heard what they wanted us to hear.
A selective information reduction strategy of only monitoring and categorizing occurrence and frequency of the couple’s standardized facial expressions when they have a conversation on a topic of potential mutual conflict proves to be a much better predictor of the marriage’s longevity. This is due to the fact that human facial expressions cannot be controlled – they are reliable indicators of underlying emotion – whereas speech can be as deceptive as it is smooth. What people say is actually a weak indicator. It is information overload, whereas the facial expressions people generate are a strong indicator. When love has faded, people may unintentionally and perhaps even unknowingly show it, even when they still verbally express their passion.
In strategic analysis in business, the ideal situation is to know the strong indicators predictive value that cannot be intentionally distorted. Once the critical data are known, the task is to subsequently filter those indicators – or critical, or diagnostic data – out of the data overload.
In chapter 13 I offer a tool for defining and assessing multiple hypotheses. This tool assists in uncovering diagnostic data. For diagnostic data and for diagnostic data alone, this can help you work through various input data quality assessment questions provided in section 10.3 . For an analyst, a sceptical mind is a joy forever.
HAVING MORE DATA MAY NOT MEAN HAVING MORE DIFFERENT SOURCES
There is an additional warning that relates to data quantity. This bias relates to so-called ‘cumulative redundant evidence’ (Clark, 2007d). Let’s assume that two sources provide largely or completely overlapping data. The analyst may receive these multiple, overlapping data-sets from a single sender… and that sender may be hard at work trying to intentionally deceive the world. The sender, however, is also being quoted by different, often reliable sources. When separate sources deliver the same message, they may erroneously build the analyst’s confidence in the data. In strategic analysis, it is obviously great to be confident, but it is infinitely better to be right.
TODAY’S DATA QUANTITY REQUIRES FILTERING TOOLS TO EXTRACT CRITICAL DATA
Critical data matters. The ablity to filter critical data out of large data sets has been described as the essence of intelligence (Wolf, 1998):
“Intelligence is essentially a banal trade of sifting through huge amounts of random information in a search for a single enlightening gem or an illuminating link.”
In Wolf’s DDR days, in East Germany, the sifting was accomplished by the allocation of massive human resources to the task. In strategic analysis in the world of business, that is not economically feasible. It wasn’t in the DDR days either, but that’s beside the point of this book. What to do?
In a remarkably prescient article, Luhn in 1958 pointed out that information overload was a key issue in business decision-making (Luhn, 1958). After all, many data did not automatically mean good or actionable data. Luhn – working for IBM – unsurprisingly concluded that rather than using large numbers of human resources, automation was essential to manage information overload:
“Undoubtedly the most formidable communications problem is the sheer bulk of information that has to be dealt with. In view of the present growth trends, automation appears to offer the most efficient methods for retrieval and dissemination of this information.”
Although most of the examples in this book concern military intelligence, the above quote shows that business decision-making in the 1950s was also affected by data overload.
Today we face an exponential rise in data quantity. An intriguing metric has been defined for this: the number of data available per decision (Edward, 2014). Diagram 12.1 shows the trend over the course of time. The horizontal axis shows the progress of time, and the vertical axis the number of data per decision. The attractive element in this diagram is the link that is being made with the capabilities of human short-term memory (Heuer, 1999k). Essentially, we cannot handle more than five independent, unconnected data points at the same time. What Luhn in the 1950s had predicted was that people, especially analysts, need data-processing tools and strategies.
In conclusion, getting our hands on copious amounts of data is usually not a problem. Having a lot of data, however luxurious it looks, does not equate to having critical data. What matters most is the ability to filter the signal from the noise. It is a rare but essential accomplishment to be able to extract critical data from a data set with thousands of individual data points, most of which are irrelevant. Asking the right questions is the first step:
• What data matter most in relation to the issue at hand?
• Why?
• What data may disprove the hypothesis at hand?
In the next chapter, I will describe the analysis tool that, with competing hypotheses, assists in identifying critical or diagnostic data. After all, for management, making sense of data overload remains one of the key roles of strategic analysis. An analyst that masters this capability does not need to worry about long-term employment.
|
CONFUSING |
The valued intelligence output attributed to objectiveness is unfortunately not by definition synonymous with quantitativeness (Silver, 2013i). Quantitative statements may have a deceiving aura of exactitude. There is truth in the clever saying that ‘figures don’t lie but liars do figure’. Sharing figures is dangerously persuasive, as fascinatingly sufficient figures record much better than qualitative arguments in people’s (executives’) minds. Once an analyst has provided an executive with estimated net sales figures for a secretive competitor, all the disclaimers on data quality and accuracy are instantly forgotten. Except for the figure – the figure will definitely be remembered. There are examples from the history books of how persuasive advisers, knowing the power of figures in psychology, used figures into intimidate others to following their proposed course of action. Reportedly Robert S. McNamara, US Secretary of Defense in the Johnson administration during the Vietnam War, was a wizard with figures that he used to drive his agenda (Halberstam, 1992c):
“McNamara was a ferocious infighter, statistics and force ratios came pouring out of him like a great uncapped faucet. He had total control of his facts and he was quick and nimble with them; there was never a man better with numbers, he could characterize enemy strength and movement and do it statistically .
Poor George [George Ball – a State Department official] had no counterfigures; he could talk in vague doubts, lacking these figures, and leave the meetings occasionally depressed and annoyed. Why did McNamara have such good figures? […] One of the reasons was that McNamara had invented them.”
Beware as an analyst of those sources only adept at pushing figures. There are more risks connected with how well quantitative data register in the human mind. In mergers and acquisitions (M&A) negotiations, the worst thing to do, unless you are the lead negotiator and you really know what you’re doing, is to mention a figure. When the seller of a business has heard a figure, say €80 million, as the price that the buyer is considering paying for his company, going forward the price will have to be at least €80 million. No matter how many conditions were mentioned in the same sentence, and no matter whether the seller has even the slightest inclination to meet these conditions, the only thing that the seller registers is the figure. In M&A parlance this is called ‘anchor pricing’. The anchor is stuck on the price. 5
Based on the same psychological phenomenon, anchoring to figures clearly undermines strategic decision-making. Countering anchoring is best done by postponing the introduction of figures in a meeting, if possible (Lovallo, 2010b). Another approach to preventing getting hooked onto an anchor thrown out by the other party is to focus on the lowest offer the other party may accept (Kahneman, 2011d).
The anchoring of the mind to a figure is a bias that may also affect analysts with a data set consisting of quantitative and qualitative data. The fact that data are quantitative by nature does not make them more correct or accurate than the qualitative data that accompany them in the set. The fact that humans apparently remember figures well does not mean that quantitative data enthusiastically offered up by a source should automatically make it into the strategic analysis deliverable. In chapter 10 , multiple tests to assess input data quality were proposed. These cautionary notes should be applied as rigorously to quantitative as to qualitative data.
|
MISPERCEIVING |
A set of separate events or data in an analysis often have to be interpreted in conjunction with each other. Such sets could be called a story. Biases may raise their ugly heads when it comes to interpreting such stories (Taleb, 2007g). Taleb refers to the triplet of opacity , sounding in his book remarkably enough four rather than three warnings. 6 Two of these warnings have a direct relevance to strategic analysis for business:
• The illusion of understanding a set of events – originating from underestimating the complexity or randomness of the events that are analysed. This links to the confirmation bias discussed in chapter 10 . The illusion of understanding may lead to premature closing (covered in a later section in this chapter). A narrative of understanding may create a ‘halo effect’ (Freedman, 2013e). Business narratives of historical success are created where success is attributed to a set of antecedent and present factors. All too often such narratives, no matter how smooth, are not based on proper research. Too often an analysis fails to point out whether the same factors were also present in cases of failure. In other words, the factors may not at all be relevant to the success. A lot of business hero-worship is based on this sort of sloppy thinking.
• The retrospective distortion – originating from the fact that events only allow sound interpretation sometime after their occurrence. At the time of their occurrence, events – or at least what is known about the events at the time of their happening – tend to look much less connected than with the benefit of hindsight, when often more or most data regarding the events have become available. This ‘fog of war’ problem is inevitable. It boils down to the ‘incomplete information dilemma’ that was described in section 10.6 . In the event of a highly incomplete data set, any attempt to analyse what is available is fraught with high risk. In such cases, it is recommended for an analyst to stick to situation reports and refrain from premature analysis.
If only analysts were not so very human. How much easier it would all be if they didn’t need to fight the all-too-human desire to create histories. How nice it would be if business analysts didn’t constantly find themselves immersed in trying to make sense of and find causal relations between what essentially may be unconnected data or events (Kahneman, 2011i):
“It is easier to construct a coherent story when you know little, when there are fewer pieces to fit into the puzzle.
Our comforting conviction that the world makes sense rests on a secure foundation: our almost unlimited ability to ignore our ignorance.”
The above quote in my view imparts an important message: think twice as an analyst before accepting causality in a history, no matter how well the narrative sounds or is being told. 7
An illustrative example of the illusion of understanding has been provided in the book Blind Man’s Bluff . The book describes the history of US submarine intelligence collection (Sontag, 1998a). The time is April 1968. US submarines patrol the coast off the Russian Far East. To their surprise, the US submarines discover that Soviet submarines are intensively, and rather casually, using active sonar to look for something. The conclusion they correctly arrived at was that the Soviets lost a submarine. For a submarine to get lost, essentially two things had to have happened: the submarine encountered an autonomous problem that had proved to be fatal or it had collided with another submarine and had been lost as a result. The first narrative was unthinkable. The Soviets were convinced that such a thing simply couldn’t occur, given their rigid naval safeguards, controls and procedures. Soviet submarines did not and could not have autonomous problems. And so, Soviet military intelligence started to look for evidence to substantiate the second narrative. A few days after the Soviet submarine disappeared, a US submarine moored in Yokosuka harbor in Japan. In principle that US submarine could have been at the location of the hypothetical Soviet submarine collision to, at the time of the collision. The Soviet Navy needed the collision validate their narrative. In addition, the American submarine (the USS Swordfish , SSN-579) pulled into port with visible damage to its sail and periscope. This damage was of course the missing puzzle piece. According to Soviet military intelligence, it unquestionably linked the Swordfish to the USSR’s missing boat and the collision scenario. The US Navy took a different view (Sontag, 1998a):
“They [Soviet military intelligence] would add two and two and come up with thirty-six.”
US underwater research later provided the real narrative. The Soviet ship did have an autonomous problem that proved fatal and the Swordfish, completely unconnected, had simply hit a small iceberg.
|
PREMATURE |
In strategic analysis, an analyst may be tempted to make an assessment of a particular set of data prior to having evaluated or even collected all the data that should have underpinned the assessment. The analyst, upon observing the loosely available data, is satisfied with the first pattern that their brain comes up with to make sense of the data. In doing so they prematurely close their mind to the possibility of anything else.
The term commonly used for this bias is ‘satisficing’. Let me make this less abstract. Imagine that you, as an analyst, observe some data. For example, in the Seventeenth Century, in northern Europe, you observe only white swans. The combination of data suits a pattern that you already know or are easily able to generate. In this case, the simple pattern is that the swan is a white bird. The implication is that when I see a swan, it is either white or it is not a swan. Every white swan you see afterwards strengthens your belief in this pattern. You are not aware that non-white swans exist and do not feel the urge to know this as your pattern suits your observations. This in analysis relates to the so-called ‘availability bias’. The only data that are available are being used in an analysis, not all the data that could have been made available. With the available data, an analyst – often unknowingly – prematurely closes his mind, rather than choosing the best fitting pattern when all the available data had been used. There are several psychological drivers that seem to explain the human urge to draw conclusions and act upon them prior to having all available data properly collected and/or analysed.
Below I will briefly discuss the drivers for premature closing in relation to pattern recognition and decision-making:
• Less data favours rather than hampers pattern recognition.
• Less data favours rather than hampers the human propensity to act.
• Time pressure drives the human propensity to act.
• Once a pattern match has been recognized, the human brain switches off.
PATTERNS EMERGE EASIER WITH FEWER DATA AVAILABLE
In psychology, it is the consistency of information in a data set that matters for the credibility of the information, not its completeness (Kahneman, 2011a). The often-lazy brain tells the analyst:
“Knowing little makes it easier to fit everything you know into a coherent pattern.”
With fewer data, inconsistencies have a lower chance of occurring. It is all too easy to lay out a straight line when you only have two points to connect. This phenomenon thus favours the risk of premature closure based on incorrect analysis.
TAKING ACTION IS EASIER WHEN LESS DATA ARE AVAILABLE
Humans act much faster and more confidently when they (believe that they) recognize a pattern than when they feel uncertain about a situation, as was discussed in more detail in chapter 9 . Psychological experiments indeed reveal that there is an inverse relationship between information gathering and the urge to act (Dörner, 1996b):
“The less information gathered, the greater the readiness to act. And vice versa.”
If this factor in itself wouldn’t be alarming enough, there is a psychological catalyst that may increase the risk of premature closure. The catalyst relates in particular to executives. Executives are driven (and want to be seen to be driven) to act. The combination of these two factors makes the risk of premature closure very real. The urge to act may itself also be catalyzed by a third factor: time pressure.
TIME PRESSURE FURTHER INCREASES THE RISK
Premature closing has also been referred to as ‘early closure’. Early closure forms an all-too-human way out of the uncertainty that analysts or executives experience when they have to make sense of too much data under the gun of time pressure (Wohlstetter, 1965b). The point here is that an analyst will favour a hypothesis that comes to mind first and/or suits a personal or political purpose best (Rumelt, 2012b):
“Under pressure to develop a way out of the difficulty, that first idea is a welcome relief. Thank goodness, here is something to hang on to! It feels much better to get oriented. The problem is that there might be better ideas out there […] But we accept early closure because letting go of a judgment is painful and disconcerting. To search for a new insight, one would have to put aside the comfort of being oriented and once again cast around in choppy waters for a new source of stability.
There is the fear of coming up empty-handed. Plus it is unnatural, even painful, to question our own ideas.”
The relief one feels when fitting together the puzzle – even when the fit is incorrect – has been mentioned before (Makridakis, 1990). In a complex world, intentionally underrating uncertainty is an understandable coping mechanism.
ONCE A PATTERN MATCH HAS BEEN MADE, THE HUMAN BRAIN SWITCHES OFF
For the analyst, another trigger for this bias might be that the data he has seen so far may confirm his pre-set expectations. This may be due to a confirmation bias but this does not need to be the case. The analyst may not in advance have looked for a particular pattern to be confirmed. Upon analysing the data set, they may simply perceive themselves as having discovered a known, fitting pattern or an analogy. 8
Subsequently, the analyst’s timesaving modus starts up:
• The pattern has been recognized.
• The implication of what the data mean is now clear.
• There is thus no need to collect or even see more data.
• The analyst selects a frame he knows and applies it to the new data, extrapolating the expected future truth in his analysis to fit his mental model. This is his tried-and-true ‘script,’ which has been collected and built over years of analysis experience.
The mind, after all, is a ‘machine for jumping to conclusions’ (Kahneman, 2011b). This message should be taken seriously. Efficiency is critically important in strategic analysis but it should not come at the cost of analytical quality.
WHAT IF NEW DATA PROVE PREMATURELY-CLOSED MINDS WRONG?
New data come in. Inconveniently, they have proven an existing analysis of a particular situation wrong. The output of any analysis should preferably, as in science, always be seen as a theory. Sound science demands changing a theory when new data come in that invalidates a hypothesis that was based on an untenable theory. A hypothesis is after all only valid until the opposite has been irrefutably proven. In science, revisiting theories is the golden standard. Science as a whole, however, is impersonal. One scientist posts a theory-derived hypothesis, carries out experiments, validates the outcomes and – assuming the outcomes confirm the hypothesis – validates the theory. Another scientist, however, may do another experiment that leads to results that falsify the theory. As was stated in chapter 2 , in the face of ugly facts even a beautiful theory has to be rejected (Bruce, 2008b).
A key difference between intelligence and science is that in quantitative or exact science hypotheses are indeed falsifiable, where in intelligence the foreknowledge element by definition is not (Bruce, 2008b).
What is common in science, strategic analysis and military intelligence is that revisiting one’s own theory in the face of new facts is not easy (Heuer, 2008):
“At a […] meeting, the last thing the author of a report wants to hear is a new idea.”
For an analyst, this can pose quite a challenge. When the analyst has earlier issued a firm conclusion, now issuing data that questions that conclusion may affect their credibility – in their own eyes or in those of peers or decision-makers. They have to admit to themselves or to other stakeholders that their earlier assessment of the situation had not foreseen the possibility that the new data seem to suggest. There is, however, a way out. They may reject and discard the new data for legitimate or entirely made-up quality reasons. This may save face, at least for a short time, even when it poses a risk to their company. The analyst has now intentionally withheld relevant data from their company.
The analyst’s dilemma is clear. The solution, of course, is never to withhold data or to reject it on false grounds. The key is, as described earlier in this book, to be a foxy analyst. Unfortunately, foxiness doesn’t eliminate the possibility of premature closing. Foxiness may work for an individual analyst. They may, however, be part of a broader strategic analysis function. When the new data come in and the theory, usually referred to as output of the analysis, has to be reviewed, it is not only an individual analyst’s credibility that is at stake, but that of the whole function.
When the business issue at hand is significant enough, the fallout will likely reverberate up to the head, including the head of the function. This dramatically raises the stakes. Chances are that the new data will be scrutinized across all data quality dimensions. The new data may be put on trial, with the function head, like a suave defense attorney, ripping the evidence apart to save the theory (read ‘his reputation and/or career’).
In comes the decision-maker. Where foxiness normally works for the analyst and may work for the strategic analysis function as a whole, it does not work for the decision-maker. This executive may have expressed opinions and/or have substantiated decisions based on an analysis that now proves to have been constructed on an incomplete and incorrectly analysed fact base. The analyst may obviously have a hard time getting the decision-maker to embrace new facts that prove their earlier opinions or decisions wrong. Examples from the military show that even undisputable new facts may not alter the opinions of decision-makers’ prematurely closed minds. 9
PREMATURE CLOSING ESPECIALLY MATTERS IN ANALYSIS FOR STRATEGY DESIGN
The process dynamics of designing a business can open the door to premature closing. Premature closing may affect both analysts and decision-makers. Getting a strategy executed effectively requires more than an analytically correct conclusion based on a cognitively solid process. During the analytical process it also requires securing the buy-in of key stakeholders. Once part of the analysis has been finished by the analyst, tentative (read ‘premature’) strategic elements are often shared with stakeholders. The latter may include senior managers who are not part of the team designing the new strategy. These managers will not only test the strategy process on its analytical correctness, but possibly with even more interest also look for what is in it for them, once the new strategy is executed. Strategy changes may after all have an impact on organization structure. Structural changes can in turn lead to changes in senior management job status, responsibilities and authority.
The premature closing can stem from decision-makers, based on analyses that are tentative and may not incorporate complete data sets, already lobbying key stakeholders. “When you get this position, will you then support the approval of this strategy?” (Bower, 1979). A decision-maker who assembled a hard-won coalition to support adoption of the new strategy won’t take kindly to an analyst who suggests a revised analysis that renders the earlier strategy design sub-optimal.
Premature closing would not be a big problem if it wouldn’t tend to occur so naturally. The intermezzo at the end of this section summarizes of a historical, well-documented example of premature closing from a military intelligence context. The example in the intermezzo allows to better grasp the potential real-life dynamics of this bias.
TIME MAY BE AN ALLY IN PREVENTING PREMATURE CLOSING
The most effective way to prevent premature closing is to postpone judgment calls until all data are available. When the collection phase delivers all data more or less at the same time to the analysis team, there is at least a synchronous review of all data. By simply being aware of the bias and reminding themselves that, until all facts are available, assessments are at best tentative, analysts may help prevent premature closing even when the condition of synchronous data delivery is not met. The delivery of all data and conclusions to decision-makers at once, the analyst helps ensure uniform, up-to-date executive review. No matter how obvious this solution, it will not always be easy to execute. When decision-makers have part of the data and have prematurely made up their mind on key conclusions the analyst should avoid a heated debate on the matter. The analyst should simply share the additional data with the decision-makers and render an informed opinion on the reliability of the data. Finally, when possible, the analyst should return another day to discuss implications and conclusions, and work on guiding the decision-maker to a favorably conclusion. Still, the decision-maker may not change direction until, in her heart of hearts, she’s convinced it’s the right thing to do… which may not happen until well after the analyst suggests that she do so.
INTERMEZZO: AN EXAMPLE OF PREMATURE CLOSING FROM THE SECOND WORLD WAR
Examples of premature closing have been described by several authors. The example below illustrates the characteristic flow of premature closing. Some data are too good to resist, they allow a politically acceptable solution to the issue at hand, and thus new data that may question the outcome are no longer searched for. When they come in they are either twisted, as in the example below, or rejected on (possibly false) quality-assurance grounds.
For those who love the history of intelligence I recommend reading the full account of Operation Mincemeat (Macintyre, 2010f). It recounts the incredible story of MI6 intentionally deceiving the German High Command during the Second World War. The message the Germans were made to believe was that the Allied invasion in the Mediterranean would take place in Sardinia and Greece, rather than in Sicily, which in fact was the real plan. The deception used an actual human dressed up as a British officer, with a suitcase containing highly confidential but misleading documents. The corpse was to be disembarked from a British submarine just off the coast of Spain. The corpse and the satchel of documents would fall via neutral Spanish sources into German hands. The deception plot was not without its flaws. For several reasons the execution of the operation had been delayed. The corpse, taken from a London mortuary, was of a person who had passed away months earlier, and it was in an advanced state of decomposition. In the end, the person had passed away months before the actual operation took place. Meanwhile, the Germans were meant to be believe that the officer had drowned at sea, in a plane crash that at best had happened a few days before the body washed up on the shore. Based on theatre tickets with recent dates put in one of the officer’s pockets, the condition of the body needed to convey that the officer had died just days earlier.
Despite this complication, everything worked according to plan. The body was found by the Spanish and the suitcase with the documents made its way to German intelligence staff in Spain. The local German intelligence chief believed he’d made the find of his life. He was convinced that the suitcase contained the highest-grade intelligence. Berlin had to be notified immediately. However, he had to polish away the conflicting evidence that a Spanish autopsy concluded that the body had been dead for at least eight days, even when the theatre tickets suggested less:
“The Abwehr had decided, from the outset, that the discovery was genuine, and moulded [sic] the evidence, despite obvious flaws, towards this belief.”
Once this fox had turned hedgehog, there was no turning back.
A final note: this is not just amusing to read. I would suggest that any one of us, under the right circumstances, could have fallen for such a deception. This intermezzo is meant as a warning, and a lesson… not as a distraction.
|
CONFUSING |
At this stage one may wonder whether there are still more biases to come. Unfortunately, the answer is yes. Reaching correct conclusions from a data set is not easy. So, I hope you will join me on this voyage of discovery into the biases that can influence the processing of data sets.
The next potential bias I would like to discuss is that of confusing causality and correlation in data set analysis (Denrell, 2005). Data do not always come as single facts. Often facts and partial (pre-cooked) analysis put forward by a source reach the analyst bundled together as a new data point. In such partial analyses, data may have been to some extent causally linked. Denrell mentions the example of culture and company performance. Consider studying a set of companies. When data analysis reveals a proportionality between a strong culture in individual companies and the outperformance (in profitability) of the strong culture companies, the easy but incorrect conclusion may be that a strong culture is imperative for being or becoming an outperforming company. In some cases, the proportionality may be inverse: it’s the strong-performing companies that can truly afford to build a strong company culture. These costs may even be a drag on the outperformance. Two independent variables may correlate perfectly, but do not need to be causally related.
The credibility of Curveball, one of the most relevant sources of ‘intelligence’ on Iraq’s alleged pre-2003 biological WMD programme was based on precisely this confusion (Jervis, 2010h). This narrative is so bizarre that it has to be true. Curveball provided data on Saddam Hussein’s secret weapons programme. These data corroborated largely with the picture that US intelligence analysts themselves had been able to construct – through connecting multiple bits and pieces from public (such as internet) sources. This added greatly to Curveball’s credibility. It also inflated the analysts’ self-esteem. Now they heard from the horse’s mouth – from the Curveball informant – what they so painstakingly had collected and analysed themselves. In the subsequent euphoria, the analysts failed to see that Curveball had access to the very same public sources and had used these to creatively build the picture that he ‘sold’ to the intelligence community. For the analysts it also made Curveball all the more compelling of a source for additional intelligence.
Such correlations – one public source, two similar stories – quite often reflect that the situations have a common cause but are nonetheless unrelated.
An example of such unrelated phenomena that correlate convincingly is given below. In the polarized 1990s the Dutch Chemical Industry Association informally lobbied the Dutch government for the prohibition of ice cream sales. Substantiating evidence for this lobby was the strong proportionality, portrayed as a causal relation, between the number of people drowning on a given day and the sales of ice cream on that day. Given the apparent correlation, the lobbyist argued, prohibiting ice cream sales should help reduce the number of drownings. The two phenomena of course had a common cause but nothing to do with each other. The industry used this ironic example to help spotlight, in the industry’s eyes, similar flaws in upcoming environmental legislation. In strategic analysis, root cause analysis should be part and parcel of the analyst’s tool kit. There is catch, though. Causal relations in business and in life may be less common than they look to the observer (Taleb, 2007h):
“We are explanation-seeking animals who tend to think that everything has an identifiable cause and grab the most apparent one as the explanation.”
Let me repeat this warning: beware of jumping to causality conclusions. Keep wondering. Do these phenomena correlate, because they have a common cause, or is the one phenomenon indeed the cause of the other? Could there be feedback loops, where phenomenon two indeed interferes with phenomenon one? All too often, good corporate performance is related to managerial excellence rather than to favourable market conditions. The opposite (poor performance) is all too often blamed on unfavourable market conditions, which management conveniently insists were beyond its control and were thus the root of all evil.
As a rule, correlations occur much more frequently than causal relations. Beware of the human tendency to see a (simplified) pattern of logical links that the reality of a situation does not justify.
|
UNDERESTIMATING |
The next topic I wish to discuss regarding issues in data set processing focuses on the common problem that ‘statistics’ is easier to spell right than to do right. Statistics is not an intuitive science. It is all too common to underestimate the size of a data set that is needed necessary to responsibly and correctly draw conclusions.
An obvious example relates to smoking. Knowing a single person who consistently smoked 20 cigarettes a day and yet turned 90 in good health does not justify denying or in any way minimizing the risk of health issues due to smoking. A causal relation between frequent smoking and health issues has been statistically proven beyond any reasonable doubt, based on millions of cases that have been studied. It would be foolish to think that the 90-year-old heavy smoker is anything but an exception, and to disregard the statistically valid conclusions that relate to the population at large (Heuer, 1991).
In strategy analysis, the same phenomenon plays a role. Knowing a company that has successfully consumer-branded a line of previously generic products does not allow one to ignore the lack of marketplace traction suffered by other generic products. Before making a call on the feasibility of consumer-branding a product, at least a dozen peer cases should be reviewed, rather than one compelling example being overemphasized.
Statistically correct analyses are understandably more time consuming than intuitive analyses. When in the strategic analysis function the quality of the outputs is rated high, sample sizes in analyses should always err on the edge of being too large and never on the border of being too small. It always pays to study multiple cases prior to drawing generic conclusions. Every case may offer yet another insight as rarely are two cases in business really similar. Balanced conclusions underpinned by multiple cases add to the function’s credibility and the management acceptance of its deliverables.
|
USING FLAWED |
Instant and correct pattern recognition when confronted with a new event is a hallmark of expertise in many professional settings. The beauty of this is that it allows for fast and often flawless decision-making in the management of emerging issues. Once a particular pattern has been recognized, the brain instantly suggests the most appropriate course of action, aligning that action with one that worked in the earlier instance where the patterned behaviour was recognized. The mind suggests a course of action that is based on an analogy. The observed event is believed to be analogous to a previously, probably vividly experienced event. Paradoxically, a pattern is recognized faster when less data are available. Pattern recognition is a great human asset but it is not flawless.
As a result, seeing an earlier sequence of events as a reliable predictor of how a new sequence of events will roll out may seem undeniably reliable. This prediction, however, may happen to be flawed. The analogy may not apply – and the observer may, as a result, respond inappropriately.
ANALOGIES MAY BE FLAWED IN THE MINDS OF BOTH THE ANALYST AND THE DECISION-MAKER
Harvard Professor E.R. May in the 1970s analysed a number of US foreign policy decisions that were underpinned by flawed ‘historical analogies’ – in May’s words, ‘lessons of the past’ (May, 1973a). He identified four pathologies in the use of history-based analogies that are also applicable to strategic business analysis work:
• The first anology that comes to mind is chosen.
• Once an analogy has presented itself, it is common not to search more widely.
• Analogies are not tested for fitness or deception.
• Current trends that one uses an analogy to illustrate are projected forward, without checking whether the underlying phenomena that caused the trend are continuing over time.
Choosing the first analogy that comes to mind, and subsequently searching no further, can contribute to overvaluing the most recent data, and can prompt premature closing. Professor May also observed that analogies are invariably chosen from the analyst’s lifetime experiences, and not from an analogy pool that pre-dates the analyst (May, 1973b). This resembles the bias of vividness weighing. For an analyst, the challenge in data processing is thus to avoid carelessly choosing a historical analogy that may not be predictive for the future development of the new case at hand. Analysts should at any rate avoid using superficial and thus flawed analogies (Gavetti, 2005). The key message is first to scrutinize the validity of the analogy relative to the new case, and then to keep monitoring whether an analogy remains applicable once the course of action addressing the event has moved to the execution stage. The moment analogies no longer apply, adaptations to the analagous course of action are immediately necessary.
Even when analysts are professional enough to avoid the trap of the flawed analogy, the analyst still faces the challenge of convincing her customer that analogies may or may not apply. This is not necessarily easy. Decision-makers, in this case US President Franklin D. Roosevelt, can at times get (May, 1973c):
“(…) captivated by a single conception of the future, based largely on beliefs of a recent past.”
Let me share a few historical examples on flawed analogies to illustrate the point. I start with the post-Second World War recalibration of the USUSSR relationship. During the war, the countries had been uneasy allies against Nazi Germany. Now that the war was over, the US reviewed its former ally’s policies in Eastern Europe with an increasing concern. This is where the analogy comes in.
The US decision-makers felt that ignoring Nazi Germany – a totalitarian state – in the late 1930s had in retrospect been a huge mistake. They realized that their inaction had led to unimaginable sacrifice, death and destruction – namely, years of global conflagration that literally consumed the planet. After WW II, as the US saw a new adversary emerge that seemed to display ‘totalitarian characteristics’ – the Soviet Union, with its authoritarian behaviour in Central and Eastern Europe – they felt compelled to act strongly (May, 1973d). As a result, the Truman administration was so forceful against Stalin’s Soviet Union that the Cold War probably became much colder than was necessary. The US only used confirmatory evidence of the parallels between Hitler’s Germany and Stalin’s USSR, not the differences between the two regimes. The latter phenomenon may be generalized. When events are perceived as analogous, all other rationale loses relevance (May, 1973e). When that occurs, we observe a classic example of the confirmation bias – even when not all the available data support the comparison.
This USSR example does not stand on its own (Clark, 2013b). Clark also describes Russian pre-First World War diplomacy. This example first describes a single, unfortunately flawed but credible narrative:
“Russia had always been the docile, peace-loving neighbour and Germany the duplicitous predator, bullying and humiliating the Russians at every opportunity. Now the time had come to stand firm.”
As this narrative spread in St Petersburg – even though it was wrong – it felt so good that it considerably limited Russian policy options. It contributed to Russia’s belligerence towards Germany and its decision for a full military mobilization in 1914. This example speaks for itself: flawed analogies leading to credible narratives may seriously deceive decision-makers or limit their flexibility.
A flawed analogy also seriously affected US policies towards Vietnam in the early 1960s (Halberstam, 1992a). Based on extensive experience in the Korean War, a top US military adviser saw more analogies than differences between a possible future military conflict in Vietnam and what the US had experienced in Korea in the early 1950s. As we saw above, one key criterion for finding parallels had been met: the Korean conflict happened in the adviser’s lifetime. A second criterion for flawed decision-making was also met – differences between the two cases were overlooked or ignored. Think of the climate and the terrain: tropically humid jungles in South Vietnam versus the harsh winters in the plains of Korea. Most of all, think of the difference between a war amongst two standing armies (US and Chinese-backed North Koreans) in Korea versus an insurgency in South Vietnam, where a civilian farmer in daytime could be a Vietcong insurgent by night. By implication, a standing army’s competitive advantages were wiped out by the very fact that there was no enemy willing to fight on the standing army’s terms. It almost sounds like having a great brick-and-mortar retail outlet, but no consumer willing to buy holiday airline tickets, hotel stays and other merry-making through retail outlets anymore. The enemy is online, rendering your advantage of high street visibility irrelevant. You may wonder why I associate the fate of old-fashioned travel agencies with Vietnam, but back to Vietnam. In short, the US military in 1961 quite inaccurately assessed South Vietnam as (Halberstam, 1992a):
“(…), not an excessively difficult or unpleasant place to operate.”
Flawed analogies leading to credible but incorrect narratives should thus be watched out for. The analyst and the decision-maker both are recommended to be alert to statements:
“X happened before, so X is likely to happen again.”
“Y is a regular pattern, X is an illustration.”
This type of narrative should alert the analyst that a flawed analogy is being presented or is at least in the making. Chapter 16 , on analyst – decision-maker interaction describes how an analyst may consider handling an untested or flawed analogy presented by a decision-maker.
To avoid closing off this section too negatively it should again be stressed that recognizing and using analogies based on experience-based pattern recognition is a powerful tool. Great business examples of analogies inspiring innovations in products and business models have been described for your further reference (Gavetti, 2005). Smartly using analogies is the key behind the strategic approach to looking for repeatability of models as a driver of growth (Zook, 2012a).
It remains relevant for the analyst to try to at all times ensure that the analogies used really apply rather than only are seeming to apply.