For reference only.
NOTE: Remember that since this is an e-Book, please record all of your answers and scoring separately.

SECTION I
Questions 1–40
Spend 90 minutes on this part of the exam.
Directions: The questions or incomplete statements that follow are each followed by five suggested answers or completions. Choose the response that best answers the question or completes the statement.
1. Following is a histogram of home sale prices (in thousands of dollars) in one community:
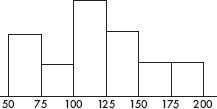
Which of the following conclusions is most correct?
(A) The median price was $125,000.
(B) The mean price was $125,000.
(C) More homes sold for between $100,000 and $125,000 than for over $125,000.
(D) $10,000 is a reasonable estimate of the standard deviation in selling prices.
(E) 1.5 × 10⁹ ($2) is a reasonable estimate of the variance in selling prices.
2. Which of the following is most useful in establishing cause-and-effect relationships?
(A) A complete census
(B) A least squares regression line showing high correlation
(C) A simple random sample (SRS)
(D) A well-designed, well-conducted survey incorporating chance to ensure a representative sample
(E) An experiment
3. The average yearly snowfall in a city is 55 inches. What is the standard deviation if 15% of the years have snowfalls above 60 inches? Assume yearly snowfalls are normally distributed.
(A) 4.83
(B) 5.18
(C) 6.04
(D) 8.93
(E) The standard deviation cannot be computed from the information given.
4. To determine the average cost of running for a congressional seat, a simple random sample of 50 politicians is chosen and the politicians’ records examined. The cost figures show a mean of $125,000 with a standard deviation of $32,000. Which of the following is the best interpretation of a 90% confidence interval estimate for the average cost of running for office?
(A) 90% of politicians running for a congressional seat spend between $117,500 and $132,500.
(B) 90% of politicians running for a congressional seat spend a mean dollar amount that is between $117,500 and $132,500.
(C) We are 90% confident that politicians running for a congressional seat spend between $117,500 and $132,500.
(D) We are 90% confident that politicians running for a congressional seat spend a mean dollar amount between $117,500 and $132,500.
(E) We are 90% confident that in the chosen sample, the mean dollar amount spent running for a congressional seat is between $117,500 and $132,500.
5. In one study on the effect that eating meat products has on weight level, an SRS of 500 subjects who admitted to eating meat at least once a day had their weights compared with those of an independent SRS of 500 people who claimed to be vegetarians. In a second study, an SRS of 500 subjects were served at least one meat meal per day for 6 months, while an independent SRS of 500 others were chosen to receive a strictly vegetarian diet for 6 months, with weights compared after 6 months.
(A) The first study is a controlled experiment, while the second is an observational study.
(B) The first study is an observational study, while the second is a controlled experiment.
(C) Both studies are controlled experiments.
(D) Both studies are observational studies.
(E) Each study is part controlled experiment and part observational study.
6. A plumbing contractor obtains 60% of her boiler circulators from a company whose defect rate is 0.005, and the rest from a company whose defect rate is 0.010. If a circulator is defective, what is the probability that it came from the first company?
(A) 0.429
(B) 0.500
(C) 0.571
(D) 0.600
(E) 0.750
7. A kidney dialysis center periodically checks a sample of its equipment and performs a major recalibration if readings are sufficiently off target. Similarly, a fabric factory periodically checks the sizes of towels coming off an assembly line and halts production if measurements are sufficiently off target. In both situations, we have the null hypothesis that the equipment is performing satisfactorily. For each situation, which is the more serious concern, a Type I or Type II error?
(A) Dialysis center: Type I error, towel manufacturer: Type I error
(B) Dialysis center: Type I error, towel manufacturer: Type II error
(C) Dialysis center: Type II error, towel manufacturer: Type I error
(D) Dialysis center: Type II error, towel manufacturer: Type II error
(E) This is impossible to answer without making an expected value judgment between human life and accurate towel sizes.
8. A coin is weighted so that the probability of heads is 0.75. The coin is tossed 10 times and the number of heads is noted. This procedure is repeated a total of 50 times, and the number of heads is recorded each time. What kind of distribution has been simulated?
(A) The sampling distribution of the sample proportion with n = 10 and p = 0.75
(B) The sampling distribution of the sample proportion with n = 50 and p = 0.75
(C) The sampling distribution of the sample mean with x = 10(0.75) and 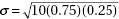
(D) The binomial distribution with n = 10 and p = 0.75
(E) The binomial distribution with n = 50 and p = 0.75
9. During the years 1886 through 2000 there were an average of 8.7 tropical cyclones per year, of which an average of 5.1 became hurricanes. Assuming that the probability of any cyclone becoming a hurricane is independent of what happens to any other cyclone, if there are five cyclones in one year, what is the probability that at least three become hurricanes?
(A) 0.313
(B) 0.345
(C) 0.586
(D) 0.658
(E) 0.686
10. Given the probabilities P(A) = 0.3 and P(B) = 0.2, what is the probability of the union P(A ∪ B) if A and B are mutually exclusive? If A and B are independent? If B is a subset of A?
(A) 0.44, 0.5, 0.2
(B) .44, 0.5, 0.3
(C) .5, 0.44, 0.2
(D) .5, 0.44, 0.3
(E) 0, 0.5, 0.3
11. A nursery owner claims that a recent drought stunted the growth of 22% of all her evergreens. A botanist tests this claim by examining an SRS of 1100 evergreens and finds that 268 trees in the sample show signs of stunted growth. With H0: p = 0.22 and Ha: p ≠ 0.22, what is the value of the test statistic?
(A) 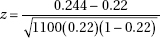
(B) 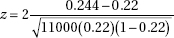
(C) 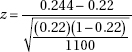
(D) 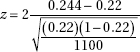
(E) 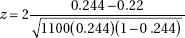
12. A medical research team tests for tumor reduction in a sample of patients using three different dosages of an experimental cancer drug. Which of the following is true?
(A) There are three explanatory variables and one response variable.
(B) There is one explanatory variable with three levels of response.
(C) Tumor reduction is the only explanatory variable, but there are three response variables corresponding to the different dosages.
(D) There are three levels of a single explanatory variable.
(E) Each explanatory level has an associated level of response.
13. The graph below shows cumulative proportion plotted against age for a population.
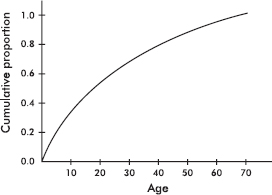
The median is approximately what age?
(A) 17
(B) 30
(C) 35
(D) 40
(E) 45
14. Mr. Bee’s statistics class had a standard deviation of 11.2 on a standardized test, while Mr. Em’s class had a standard deviation of 5.6 on the same test. Which of the following is the most reasonable conclusion concerning the two classes’ performance on the test?
(A) Mr. Bee’s class is less heterogeneous than Mr. Em’s.
(B) Mr. Em’s class is more homogeneous than Mr. Bee’s.
(C) Mr. Bee’s class performed twice as well as Mr. Em’s.
(D) Mr. Em’s class did not do as well as Mr. Bee’s.
(E) Mr. Bee’s class had the higher mean, but this may not be statistically significant.
15. A college admissions officer is interested in comparing the SAT math scores of high school applicants who have and have not taken AP Statistics. She randomly pulls the files of five applicants who took AP Statistics and five applicants who did not, and proceeds to run a t-test to compare the mean SAT math scores of the two groups. Which of the following is a necessary assumption?
(A) The population variances from each group are known.
(B) The population variances from each group are unknown.
(C) The population variances from the two groups are equal.
(D) The population of SAT scores from each group is normally distributed.
(E) The samples must be independent simple random samples, and for each sample np and n(1 – p) must both be at least 10.
16. The appraised values of houses in a city have a mean of $125,000 with a standard deviation of $23,000. Because of a new teachers’ contract, the school district needs an extra 10% in funds compared to the previous year. To raise this additional money, the city instructs the assessment office to raise all appraised house values by $5,000. What will be the new standard deviation of the appraised values of houses in the city?
(A) $23,000
(B) $25,300
(C) $28,000
(D) $30,300
(E) $30,800
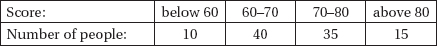
17. A psychologist hypothesizes that scores on an aptitude test are normally distributed with a mean of 70 and a standard deviation of 10. In a random sample of size 100, scores are distributed as in the table below. What is the  2 statistic for a goodness-of-fit test?
(A) 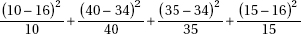
(B) 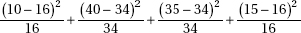
(C) 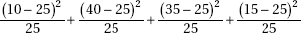
(D) 
(E) 
18. A talk show host recently reported that in response to his on-air question, 82% of the more than 2500 e-mail messages received through his publicized address supported the death penalty for anyone convicted of selling drugs to children. What does this show?
(A) The survey is meaningless because of voluntary response bias.
(B) No meaningful conclusion is possible without knowing something more about the characteristics of his listeners.
(C) The survey would have been more meaningful if he had picked a random sample of the 2500 listeners who responded.
(D) The survey would have been more meaningful if he had used a control group.
(E) This was a legitimate sample, randomly drawn from his listeners, and of sufficient size to be able to conclude that most of his listeners support the death penalty for such a crime.
19. Define a new measurement as the difference between the 60th and 40th percentile scores in a population. This measurement will give information concerning
(A) central tendency.
(B) variability.
(C) symmetry.
(D) skewness.
(E) clustering.
20. Suppose X and Y are random variables with E(X) = 37, var(X) = 5, E(Y) = 62, and var(Y) = 12. What are the expected value and variance of the random variable X + Y?
(A) E(X + Y) = 99, var(X + Y) = 8.5
(B) E(X + Y) = 99, var(X + Y) = 13
(C) E(X + Y) = 99, var(X + Y) = 17
(D) E(X + Y) = 49.5, var(X + Y) = 17
(E) There is insufficient information to answer this question.
21. Which of the following can affect the value of the correlation r?
(A) A change in measurement units
(B) A change in which variable is called x and which is called y
(C) Adding the same constant to all values of the x-variable
(D) All of the above can affect the r value.
(E) None of the above can affect the r value.
22. The American Medical Association (AMA) wishes to determine the percentage of obstetricians who are considering leaving the profession because of the rapidly increasing number of lawsuits against obstetricians. How large a sample should be taken to find the answer to within ±3% at the 95% confidence level?
(A) 6
(B) 33
(C) 534
(D) 752
(E) 1068
23. Suppose you did 10 independent tests of the form H0: µ = 25 versus Ha: µ < 25, each at the α = 0.05 significance level. What is the probability of committing a Type I error and incorrectly rejecting a true H0 with at least one of the 10 tests?
(A) 0.05
(B) 0.40
(C) 0.50
(D) 0.60
(E) 0.95
24. Which of the following sets has the smallest standard deviation? Which has the largest?
I. 1, 2, 3, 4, 5, 6, 7
II. 1, 1, 1, 4, 7, 7, 7
III. 1, 4, 4, 4, 4, 4, 7
(A) I, II
(B) II, III
(C) III, I
(D) II, I
(E) III, II
25. A researcher plans a study to examine long-term confidence in the U.S. economy among the adult population. She obtains a simple random sample of 30 adults as they leave a Wall Street office building one weekday afternoon. All but two of the adults agree to participate in the survey. Which of the following conclusions is correct?
(A) Proper use of chance as evidenced by the simple random sample makes this a well-designed survey.
(B) The high response rate makes this a well-designed survey.
(C) Selection bias makes this a poorly designed survey.
(D) A voluntary response study like this gives too much emphasis to persons with strong opinions.
(E) Lack of anonymity makes this a poorly designed survey.
26. Which among the following would result in the narrowest confidence interval?
(A) Small sample size and 95% confidence
(B) Small sample size and 99% confidence
(C) Large sample size and 95% confidence
(D) Large sample size and 99% confidence
(E) This cannot be answered without knowing an appropriate standard deviation.
27. Consider the following three scatterplots:
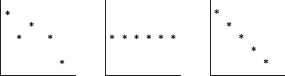
What is the relationship among r1, r2, and r3, the correlations associated with the first, second, and third scatterplots, respectively?
(A) r1 < r2 < r3
(B) r1 < r3 < r2
(C) r2 < r3 < r1
(D) r3 < r1 < r2
(E) r3 < r2 < r1
28. There are two games involving flipping a coin. In the first game you win a prize if you can throw between 45% and 55% heads. In the second game you win if you can throw more than 80% heads. For each game would you rather flip the coin 30 times or 300 times?
(A) 30 times for each game
(B) 300 times for each game
(C) 30 times for the first game and 300 times for the second
(D) 300 times for the first game and 30 times for the second
(E) The outcomes of the games do not depend on the number of flips.
29. City planners are trying to decide among various parking plan options ranging from more on-street spaces to multilevel facilities to spread-out small lots. Before making a decision, they wish to test the downtown merchants’ claim that shoppers park for an average of only 47 minutes in the downtown area. The planners have decided to tabulate parking durations for 225 shoppers and to reject the merchants’ claim if the sample mean exceeds 50 minutes. If the merchants’ claim is wrong and the true mean is 51 minutes, what is the probability that the random sample will lead to a mistaken failure to reject the merchants’ claim? Assume that the standard deviation in parking durations is 27 minutes.
(A) 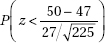
(B) 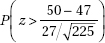
(C) 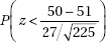
(D) 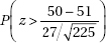
(E) 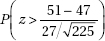
30. Consider the following parallel boxplots indicating the starting salaries (in thousands of dollars) for blue collar and white collar workers at a particular production plant:
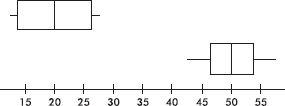
Which of the following is a correct conclusion?
(A) The ranges of the distributions are the same.
(B) In each distribution the mean is equal to the median.
(C) Each distribution is symmetric.
(D) Each distribution is roughly normal.
(E) The distributions are outliers of each other.
31. The mean Law School Aptitude Test (LSAT) score for applicants to a particular law school is 650 with a standard deviation of 45. Suppose that only applicants with scores above 700 are considered. What percentage of the applicants considered have scores below 740? (Assume the scores are normally distributed.)
(A) 13.3%
(B) 17.1%
(C) 82.9%
(D) 86.7%
(E) 97.7%
32. If all the other variables remain constant, which of the following will increase the power of a hypothesis test?
I. Increasing the sample size.
II. Increasing the significance level.
III. Increasing the probability of a Type II error.
(A) I only
(B) II only
(C) III only
(D) I and II
(E) All are true.
33. A researcher planning a survey of school principals in a particular state has lists of the school principals employed in each of the 125 school districts. The procedure is to obtain a random sample of principals from each of the districts rather than grouping all the lists together and obtaining a sample from the entire group. Which of the following is a correct conclusion?
(A) This is a simple random sample obtained in an easier and less costly manner than procedures involving sampling from the entire population of principals.
(B) This is a cluster sample in which the population was divided into heterogeneous groups called clusters.
(C) This is an example of systematic sampling, which gives a reasonable sample as long as the original order of the list is not related to the variables under consideration.
(D) This is an example of proportional sampling based on sizes of the school districts.
(E) This is a stratified sample, which may give comparative information that a simple random sample wouldn’t give.
34. A simple random sample is defined by
(A) the method of selection.
(B) examination of the outcome.
(C) both of the above.
(D) how representative the sample is of the population.
(E) the size of the sample versus the size of the population.
35. Changing from a 90% confidence interval estimate for a population proportion to a 99% confidence interval estimate, with all other things being equal,
(A) increases the interval size by 9%.
(B) decreases the interval size by 9%.
(C) increases the interval size by 57%.
(D) decreases the interval size by 57%.
(E) This question cannot be answered without knowing the sample size.
36. Which of the following is a true statement about hypothesis testing?
(A) If there is sufficient evidence to reject a null hypothesis at the 10% level, then there is sufficient evidence to reject it at the 5% level.
(B) Whether to use a one- or a two-sided test is typically decided after the data are gathered.
(C) If a hypothesis test is conducted at the 1% level, there is a 1% chance of rejecting the null hypothesis.
(D) The probability of a Type I error plus the probability of a Type II error always equal 1.
(E) The power of a test concerns its ability to detect an alternative hypothesis.
37. A population is normally distributed with mean 25. Consider all samples of size 10. The variable 
(A) has a normal distribution.
(B) has a t-distribution with df = 10.
(C) has a t-distribution with df = 9.
(D) has neither a normal distribution or a t-distribution.
(E) has either a normal or a t-distribution depending on the characteristics of the population standard deviation.
38. A correlation of 0.6 indicates that the percentage of variation in y that is explained by the variation in x is how many times the percentage indicated by a correlation of 0.3?
(A) 2
(B) 3
(C) 4
(D) 6
(E) There is insufficient information to answer this question.
39. As reported on CNN, in a May 1999 national poll 43% of high school students expressed fear about going to school. Which of the following best describes what is meant by the poll having a margin of error of 5%?
(A) It is likely that the true proportion of high school students afraid to go to school is between 38% and 48%.
(B) Five percent of the students refused to participate in the poll.
(C) Between 38% and 48% of those surveyed expressed fear about going to school.
(D) There is a 0.05 probability that the 43% result is in error.
(E) If similar size polls were repeatedly taken, they would be wrong about 5% of the time.
40. In a high school of 1650 students, 132 have personal investments in the stock market. To estimate the total stock investment by students in this school, two plans are proposed. Plan I would sample 30 students at random, find a confidence interval estimate of their average investment, and then multiply both ends of this interval by 1650 to get an interval estimate of the total investment. Plan II would sample 30 students at random from among the 132 who have investments in the market, find a confidence interval estimate of their average investment, and then multiply both ends of this interval by 132 to get an interval estimate of the total investment. Which is the better plan for estimating the total stock market investment by students in this school?
(A) Plan I
(B) Plan II
(C) Both plans use random samples and so will produce equivalent results.
(D) Neither plan will give an accurate estimate.
(E) The resulting data must be seen to evaluate which is the better plan.

If there is still time remaining, you may review your answers.
SECTION II
Part A
QUESTIONS 1–5
Spend about 65 minutes on this part of the exam.
Percentage of Section II grade—75
Directions: You must show all work and indicate the methods you use. You will be graded on the correctness of your methods and on the accuracy of your results and explanations.
1. Cumulative frequency graphs of the heights (in inches) of athletes playing college baseball (A), basketball (B), and football (C) are given below:
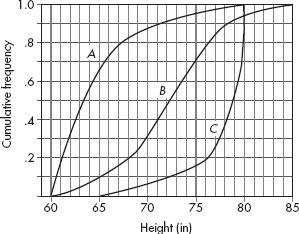
Write a few sentences comparing the distributions of heights of athletes playing the three college sports.
2. When students do not understand an author’s vocabulary, there is no way they can fully understand the text; thus, learning vocabulary is recognized as one of the most important skills in all subject areas. A school system is planning a study to see which of two programs is more effective in ninth grade. Program A involves teaching students to apply morphemic analysis, the process of deriving a word’s meaning by analyzing its meaningful parts, such as roots, prefixes, and suffixes. Program B involves teaching students to apply contextual analysis, the process of inferring the meaning of an unfamiliar word by examining the surrounding text.
(a) Explain the purpose of incorporating a control group in this experiment.
(b) To comply with informed consent laws, parents will be asked their consent for their children to be randomly assigned to be taught in one of the new programs or by the local standard method. Students of parents who do not return the consent forms will continue to be taught by the local standard method. Explain why these students should not be considered part of the control group.
(c) Given 90 students randomly selected from ninth grade students with parental consent, explain how to assign them to the three groups, Program A, Program B, and Control, for a completely randomized design.
3. An experiment is designed to test a home insulation product. Two side-by-side identical houses are chosen, and in one the insulation product is installed (blown into the attic). Both homes use natural gas for heating, and the thermostat in each house is fixed at 68 degrees Fahrenheit. On 30 randomly chosen winter days, the quantity of gas (in hundreds of cubic feet) used to heat each house is measured. The table below summarizes the data.
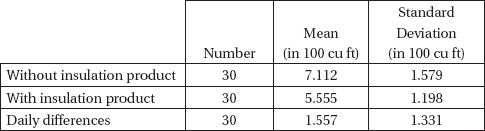
(a) Is there evidence that the insulation product does result in a lower mean quantity of gas being used?
Two least square regression calculations are performed with the following computer output, where Temp is the average outside temperature, and WithOut and With are the quantities of gas (in hundreds of cubic feet) used to heat the two homes on a day with that outside temperature:
Regression Analysis: WithOut versus Temp
Predictor |
Coef |
SE Coef |
T |
P |
Constant |
10.0228 |
0.4009 |
25.00 |
0.000 |
Temp |
–0.14926 |
0.01879 |
–7.94 |
0.000 |
S = 0.890921R–Sq = 69.3%R–Sq(adj) = 68.2%
Regression Analysis: With versus Temp
Predictor |
Coef |
SE Coef |
T |
P |
Constant |
7.5850 |
0.3531 |
21.48 |
0.000 |
Temp |
–0.10408 |
0.01655 |
–6.29 |
0.000 |
S = 0.784653R–Sq = 58.5%R–Sq(adj) = 57.1%
(b) Compare the slopes of the regression lines in context of this problem.
(c) Compare the y-intercepts of the regression lines in context of this problem.
4. A new anti-spam software program is field tested on 1000 e-mails and the results are summarized in the following table (positive test = program labels e-mail as spam):
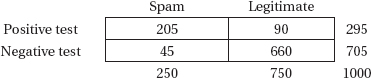
Using the above empirical results, determine the following probabilities.
(a) (i) What is the predictive value of the test? That is, what is the probability that an e-mail is spam and the test is positive?
(ii) What is the false-positive rate? That is, what is the probability of testing positive given that the e-mail is legitimate?
(b) (i) What is the sensitivity of the test? That is, what is the probability of testing positive given that the e-mail is spam?
(ii) What is the specificity of the test? That is, what is the probability of testing negative given that the e-mail is legitimate?
(c) (i) Given a random sample of five legitimate e-mails, what is the probability that the program labels at least one as spam?
(ii) Given a random sample of five spam e-mails, what is the probability that the program correctly labels at least three as spam?
(d) (i) If 35% of the incoming e-mails from one source are spam, what is the probability that an e-mail from that source will be labeled as spam?
(ii) If an e-mail from this source is labeled as spam, what is the probability it really is spam?
5. Cumulative exposure to nitrogen dioxide (NO2) is a major risk factor for lung disease in tunnel construction workers. In a 2004 study, researchers compared cumulative exposure to NO2 for a random sample of drill and blast workers and for an independent random sample of concrete workers. Summary statistics are shown below.
|
Tunnel worker activity |
Sample size |
Mean cumulative NO2 exposure (ppm*/yr) |
Standard deviation in cumulative NO2 exposure (ppm*/yr) |
|
Drill and blast |
115 |
4.1 |
1.8 |
|
Concrete |
69 |
4.8 |
2.4 |
*Parts per million
(a) Find a 95% confidence interval estimate for the difference in mean cumulative NO2 exposure for drill and blast workers and concrete workers.
(b) Using this confidence interval, is there evidence of a difference in mean cumulative NO2 exposure for drill and blast workers and concrete workers? Explain.
(c) It turns out that both data sets were somewhat skewed. Does this invalidate your analysis? Explain.
SECTION II
Part B
QUESTION 6
Spend about 25 minutes on this part of the exam.
Percentage of Section II grade—25
6. Do strong magnetic fields have an effect on the early development of mice? A study is performed on a random sample of 120 one-month-old mice. Each is subjected to a strong magnetic field for one week and no magnetic field for one week, the order being decided randomly for each mouse. The weight gain in grams during each week for each mouse is recorded. The weight gains with no magnetic field are approximately normally distributed with a mean of 25.1 grams and a standard deviation of 3.1 grams, while the weight gains in the magnetic field are approximately normally distributed with a mean of 17.3 grams and a standard deviation of 5.7 grams. Of the 120 mice, 101 gained more weight with no magnetic field.
(a) Calculate and interpret a 95% confidence interval for the proportion of mice that gain more weight with no magnetic field.
(b) Suppose two of these mice were chosen at random. What is the probability that the first mouse gained more weight with no magnetic field than the second mouse gained in the magnetic field?
(c) Based on your answers to (a) and (b), is there evidence that for mice, weight gain with no magnetic field and in a magnetic field are independent?
(d) In a test for variances on whether or not the variances of the two sets of weight gains are significantly different,  with α = 0.05, for samples of this size, the critical cut-off scores for
  are 0.698 (left tail of 0.025) and 1.43 (right tail of 0.025). What is the resulting conclusion about variances?
If there is still time remaining, you may review your answers.