
Tables A.1
† Values of the standardized normal for distributions
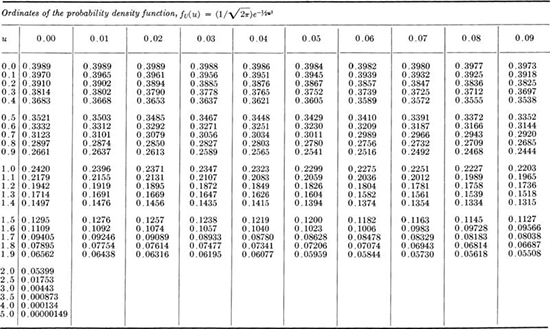
† Table A.1 is taken in part from Hald [1952] and National Bureau of standards [1953] with respective permissions of the authors and publishers. See Chap. 3 for full reference details of all appendix references.
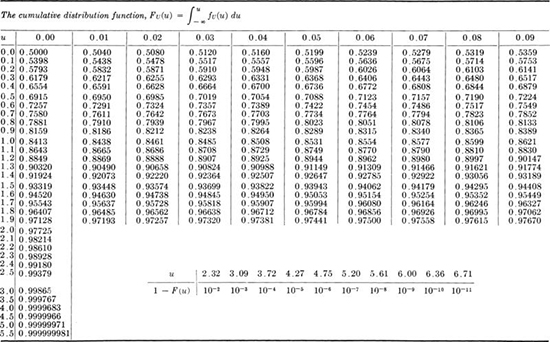
Table A.2 † Tables for evaluation of the CDF of the χ2, gamma, and Poisson distributions
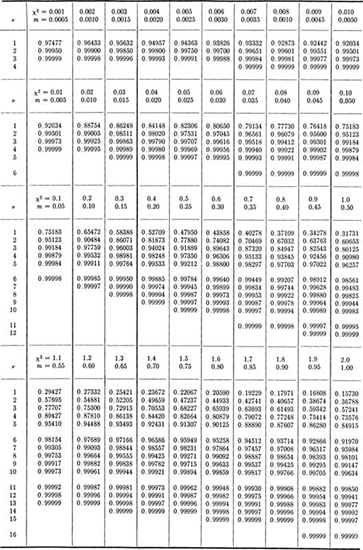
† Compiled from E. S. Pearson and H. 0. Hartley (eds.) [1954], “Biometrika Tables for Statisticians,” vol. 1, Cambridge University Press, Cambridge, England (by permission).
Note: See Sec. 3.4.2 for illustrations of application. Tables yield:
1. 1– F(χ2) for a χ2 distribution with υ degrees of freedom.
2. 1– F(y), where y = χ2/2λ, for a gamma distribution with parameters k =υ /2 and λ. Enter table with υ = 2k and χ2 = 2λy.
3. F(u), where u =![]() , for a Poisson distribution with mean
, for a Poisson distribution with mean ![]() Enter table with m and υ = 2(u + 1).
Enter table with m and υ = 2(u + 1).
For υ ≥ 30, the χ2 distribution is approximately normal, with mean υ and variance 2υ. Somewhat more accurately (Hald [1952]) for v ≥ 30, the value ![]() such that F(χP2) = p is approximately
such that F(χP2) = p is approximately ![]() , in which uP is the value from the standardized normal Table A.1 such that F(uP) = p.
, in which uP is the value from the standardized normal Table A.1 such that F(uP) = p.
Table A.3 † Cumulative distribution of Student’s t distribution
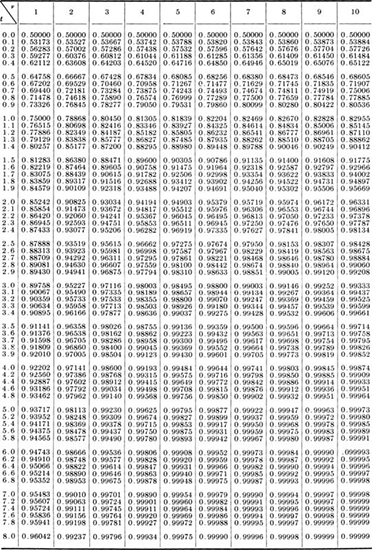
† Compiled from E. S. Pearson and H. O. Hartley (eds.) [1954], "Biometrika Tables for Statisticians," vol. 1, Cambridge University Press, Cambridge, England (by permission).
Table A.4 † Properties of some standardized beta distributions
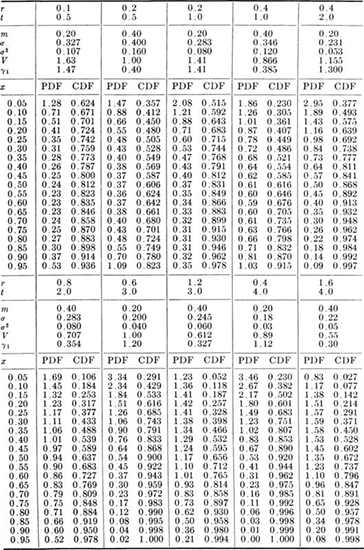
† See text for integer r and t.
Table A.5
† Values of the standardized Type I extreme-value distribution (largest value)![]()
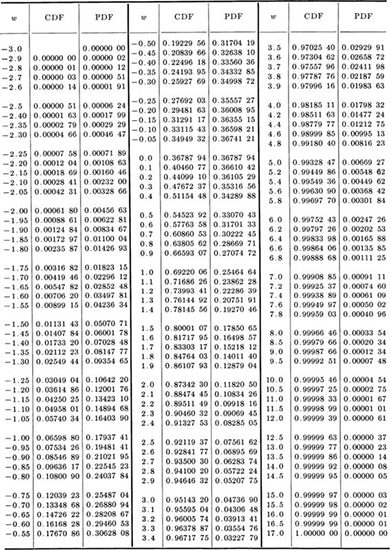
† Source: National Bureau of Standards [1953], "Probability Tables for the Analysis of Extreme Value Data," Applied Math Series 22, Washington, D.C.
Table A.6 † F distribution; value of z such that Fz(z) = 0.95
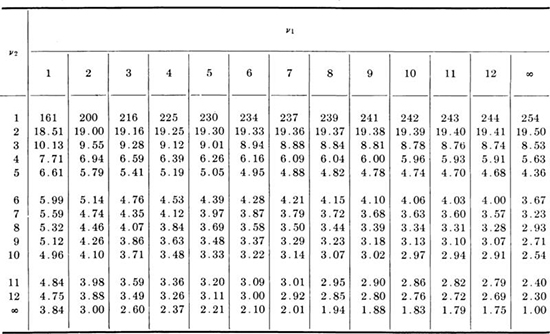
† Compiled with permission from R. S. Burington and D. C. May [1953], “Handbook of Probability and Statistics with Tables,” McGraw-Hill Book Company, New York.
Table A.7 Critical statistic for the Kolmogorov-Smirnov goodness-of-fit test †
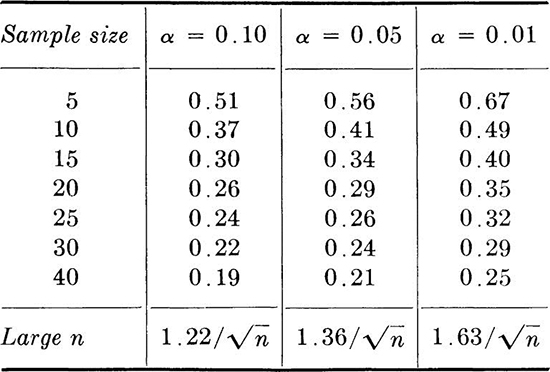
† Table abstracted from Lindgren [1962], “Statistical Theory”, The Macmillan Company, New York, (with the permission of the author and publisher).
Table A.8 † Table of random digits
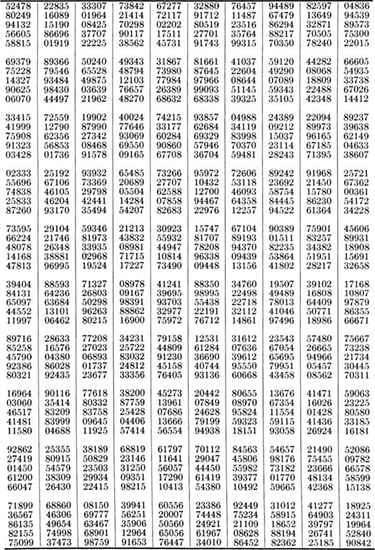
† Table taken from RAND Corporation [1955], “A Million Random Digits with 100,000 Normal Deviates.” The Free Press, Glencoe, Illinois (with the permission of the authors and publishers).