10
Bounded Instability:
Linking Risk and Asset-Price Swings
WE HAVE DISCUSSED how trends in fundamentals and guardedly moderate revisions of participants' forecasting strategies, and the contingency of such qualitative characterizations of change can account for the price swings observed in asset markets. We also sketched how swings in broad price indexes arise from movements in the relative prices of assets. In this chapter, we explain how these swings play an indispensable role in the process by which financial markets allocate capital to alternative projects and companies. However, we also show why, owing to imperfect knowledge, price swings can sometimes become excessive: prices move beyond a range of values that reflect what most value speculators would consider consistent with the longer-term prospects of projects and companies. We illustrate our arguments in the context of developments in U.S. equity markets in the 1990s and early 2000s.
If markets were entirely populated with value speculators, they would self-correct any excess in prices relatively quickly once it was generally perceived. With the presence of short-term speculators, however, the correction may be considerably delayed, resulting in substantial misallocation of capital. The possibility of a prolonged excessive price swing is further enhanced by what Soros (1987, 2009) calls “reflexive” relationships, or channels through which, for a time, an asset-price swing and fundamental trends reinforce each other.
However, as the housing-and equity-price booms of the 2000s show, even with short-term speculators and reflexive relationships, markets eventually correct excessive price swings on their own. The problem, we now see, is that the reversal, when it eventually comes, may be as sharp as the price swing was excessive, inflicting enormous damage on the financial system and the broader economy. Moreover, it may take years to correct misallocations resulting from the distortions that excessive swings cause.
In accounting for the self-limiting nature of asset-price swings, we build on another insight of Keynes (1936): participants' assessments of the potential losses—the risk—associated with their speculative positions move either in line with or counter to the price swing, depending on whether they are bulls or bears. We combine this insight with Kahneman and Tversky's (1979) prospect theory and formalize, in a way that recognizes imperfect knowledge, their observation that participants' well-being is more sensitive to potential losses than to potential gains of the same magnitude. By relating risk from trading and holding assets in financial markets to the gap between an asset price and estimates of its benchmark level, our approach results in very different measures of risk from those implied by contemporary models, which relate risk to the short-term volatility of an asset price.1
Our IKE model of risk implies that as asset prices rise well above or fall far below most participants' perceptions of historical benchmark levels, those who are betting on further movements away from benchmark levels raise their assessments of the riskiness of doing so. Eventually, these assessments lead participants to revise their forecasting strategies in radical and nonreinforcing ways. When that happens, even the most excessive price swings come to an end and are followed by sustained reversals back toward benchmark levels.
THE INDISPENSABLE ROLE OF ASSET-PRICE
SWINGS IN ALLOCATING CAPITAL
Consider the U.S. equity market in the 1990s. During this period, particularly before 1998, corporate earnings, gross domestic product, employment, exports, and productivity levels were rising strongly, while inflation was declining. Political and institutional developments, accompanied by loose monetary policy, were also conducive to growth. Given the widespread view at the time that the U.S. economy and others were in the midst of an information-technology revolution, both value and short-term speculators likely interpreted these persistent trends bullishly.
Value speculators focused on these short-term trends to assess how individual companies' longer-term prospects might be unfolding. They interpreted these trends in the context of in-depth company-specific and industry analyses, buying companies that they anticipated would generate a steady stream of earnings over the longer term or those thought to be undervalued, and reducing positions in companies for which confidence in earnings and value potential had fallen. These trading decisions thus contributed to the movement of relative prices and helped society to allocate its scarce capital.
As the bullish trends in economy-wide and company-specific fundamentals unfolded in the 1990s, value speculators no doubt reevaluated and possibly revised their assessments of the differing longer-term prospects of many companies. But because market participants tend to revise their thinking about the future in guardedly moderate ways or leave their strategies unaltered, value speculators' trading decisions not only influenced relative prices, but also likely contributed, at least early on, to the decade-long upswing in broad price indexes.
Of course, these speculators' assessments of the longer-term prospects of the companies that underlie, say, the S&P 500 price index spanned a range of values. Many observers would argue that this range likely shifted up, and thus, that at least for a time, the upward climb in stock prices was not a swing away from the range of values consistent with perceived longer-term prospects but was merely a reflection of its rise. Although the bullish perceptions of the information-technology revolution's longer-term benefits did—and still do—seem warranted, this does not mean that the market correctly appraised the effects on companies' longer-term prospects, even during the early phase of the 1990s upswing.
For one thing, short-term speculators also contributed to the movement of relative prices, as they, too, focused on unfolding trends in fundamentals to forecast the returns on individual companies. Because they were concerned with near-term returns, they generally did not rely on the type of extensive fundamental analysis that their longer-term counterparts undertook. Consequently, they no doubt overreacted to the trends in fundamentals when assessing some companies, pushing prices up or down excessively and distorting relative prices compared to those that would have been generated if the market were composed solely of value speculators.
However, as we discussed in Chapter 8, the performance of companies over the short term, whether positive or negative, is a harbinger of longer-term performance. By reacting to trends in fundamentals and the performance of companies over the near term, short-term speculators help the market assess companies' differing, and inherently unknowable, longer-term prospects.
During the first half of the 1990s, for example, new and old companies alike were finding and using novel applications of information technology to lower their production costs, improve their existing services or products, or develop new ones. Dell, Microsoft, and Google are prime examples of firms for which favorable short-term trends in macroeconomic and company-specific fundamentals presaged longer-term performance.
To be sure, no one knew beforehand whether any company's development strategy would succeed or fail. But as the bullish trends in fundamentals unfolded in the 1990s, short-term and value speculators were most likely buying many of the same companies. And, because short-term speculators, like value speculators, tend to revise their forecasting strategies in guardedly moderate ways or leave them unaltered, as the bullish trends in fundamentals persisted, their trading decisions, too, not only influenced relative price movements but also contributed to the general upswing in stock prices.
This and many other historical episodes demonstrate that swings in broad price indexes are integral to the process by which financial markets assess the ever-changing near-term and longer-term prospects and returns of companies—and thus to how they allocate society's capital. It is also true, however, that such swings may eventually become excessive relative to most participants' assessments of the longer-term prospects of companies and projects.
HISTORICAL BENCHMARKS AS GAUGES
OF LONGER-TERM PROSPECTS
The dynamism of modern economies implies that, however careful one's analysis of a stock's prospective value might be, any light that it may shed on the longer term will be dim at best. Who in the late 1970s could have predicted the phenomenal rise of the personal computer and the internet, let alone their impact on economic outcomes, in the 1980s and 1990s?
Forecasting the longer-term prospects of a basket of companies, such as the one underlying the S&P 500 price index, is also difficult. But history tells us that irregular swings in broader price indexes tend to revolve around estimates of benchmark levels. Market participants, therefore, look to them as an imprecise but useful gauge of whether stock prices are consistent with assessments of companies' longer-term prospects.
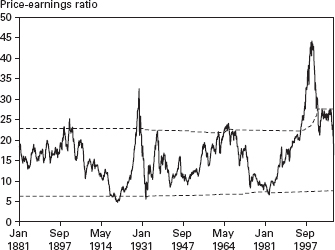
Fig. 10.1. Range of historically moderate price-earnings valuations
Source: Data are from Robert Shiller's website: www.econ.yale.edu/~shiller.
Common benchmark levels in equity markets are based on historical averages of price-earnings or price-dividend ratios. Figure 10.1 plots the stock price relative to a 10-year moving average of earnings and its historical average (which was also plotted in Figure 5.1), as well as an example of a historically based range within which most of the fluctuations in the price-earnings ratio have occurred. Price-earnings ratios are often based on a moving average of current and past earnings, because such averages provide a better measure of companies' longer-term prospects than do current earnings in any given quarter. To derive the lower and upper bands of the range, we first find the fifth and ninety-fifth percentiles of price-earnings ratios during the first fifty years of the sample (1881–1931). After 1931, we move the fifty-year window forward one month at a time and again find the high and low price-earnings ratios that imply a 90% range of moderate values.
The price swings away from and toward the benchmark level in the figure are of irregular duration and magnitude; when a price swing might begin or end cannot be predicted solely on the basis of mathematical calculation. But the empirical record shows that when stock prices move beyond a range of historically moderate levels relative to current and past earnings, the high valuations are likely not sustainable. Eventually, stock prices undergo sustained countermovements back toward the historically moderate range.2
The range of historically moderate values plotted in Figure 10.1 is just one possible example of such a span. No one can fully foresee what upper or lower threshold would, if crossed, imply excessive values and a greater likelihood of unsustainability. Given the dynamism of modern economies, these thresholds no doubt change over time.3
Nonetheless, because growing departures from common benchmark levels are eventually not sustainable, market participants rely on the historically moderate values around them to evaluate the plausibility of their own assessments of longer-term prospects. How individuals come to decide on a particular notion of the benchmark and estimate it is an open question. Keynes (1936) suggests that conventions and the historical record play an important role. For example, price-earnings ratios and purchasing power parity exchange rates have long influenced how market participants and policymakers assess the sustainability of prices in equity markets and currency markets, respectively.
A market participant's assessment of companies' longer-term prospects will generally differ from her assessment of the historical benchmark. After all, historical benchmarks are backward looking and, by definition, cannot account for the longer-term impact of innovative activities and nonroutine change on companies. At each point in time, a participant who trades with a view to the longer term devises her own forecast of prospects, generally drawing on historical information (including her assessment of the historical benchmark), current information about fundamentals, and any innovations and other changes in the social context that she deems relevant. Indeed, current information might—and likely does—lead individuals to think that future returns could turn out to be different from what is implied by the historical benchmark.
It seems uncontroversial to suppose that the difference between an individual's forecast of companies' longer-term prospects and her assessment of the historical benchmark is limited. After all, there is a floor and a ceiling, relative to current and past earnings, to the value of U.S. equities as a whole, say, ten or twenty years hence.4 Consequently, when stock prices rise above or fall below historically moderate values, they have likely moved beyond the range that is consistent with most participants' assessments of companies' longer-term prospects.
Such excessive price swings can arise from the trading decisions of both short-term and value speculators. However, it is short-term speculators whose trading can sustain an excessive price swing, even though they and their longer-term counterparts understand that prices are already historically high and inconsistent with most assessments of longer-term valuations.
THE UNFOLDING OF EXCESSIVE PRICE SWINGS
Price swings may unfold more or less quickly than do current earnings. Figure 7.1 (reproduced here as Figure 10.2 for convenience) shows that the upswing in equity prices in the 1990s was steeper than the rise in current earnings, whereas the opposite was true for the upswing and downswing that occurred between 2003 and 2007. However, as Figure 10.1 reveals, the price swings that we observe in financial markets tend to involve persistent movements away from or toward moving averages of earnings, which change much more slowly than current earnings do.
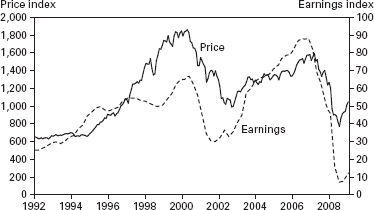
Fig. 10.2. S&P 500 stock price and current earnings, 1992–2009
Source: Data are from Robert Shiller's website: www.econ.yale.edu/~shiller.
Consider again the U.S. stock market in the 1990s. Given the positive perceptions of the information-technology revolution's longer-term benefits during this period and the bullish trends in many of the basic fundamental factors, value speculators likely raised their assessments of the capacity of many companies' to generate greater future earnings—and thus of the price-earnings multiples that these companies deserved. Short-term speculators also focused on the bullish trends in fundamentals in the context of the information-technology revolution. Because both groups of participants tend to revise their forecasting strategies in guardedly moderate ways, both contributed to the upswing in the stock prices relative to current and past earnings.
Reflexivity, Speculation, and Excess
Of course, assessments of companies' longer-term prospects, relative to their current and past earnings, cannot grow without bound. Eventually, value speculators will realize that companies' prospects do not warrant higher price-earnings multiples, despite persistent bullish trends in the basic fundamentals. The length of time before value speculators as a group come to believe that such a point has been reached can be prolonged by the existence of feedback, or reflexive relationships, between stock prices and trends in fundamentals.
Most individuals hold their wealth entirely or mostly in their house and/or in the stock market. When equity and housing prices rise, so does individual wealth. As a result, they feel less need to save and are also able to borrow more, leading them to increase their consumption spending. Likewise, as stock prices increase, businesses gain greater access to finance capital, enabling them to increase their investment spending on new plant and equipment. Rising consumption and investment spending stimulates overall economic activity, thereby enhancing the favorable trends in company earnings and other basic fundamental factors on which both value and short-term speculators rely in forecasting market outcomes. The persistence of bullish trends, in turn, exerts positive feedback on stock prices. And, of course, a rising stock market and overall economy boosts the confidence and optimism of consumers, businesses, and financial market participants about the future, further adding to the positive reflexive effects.
Eventually, if it continues long enough, this reflexive process reverses itself, as consumers find themselves financially overextended and firms begin to see that capital expenditures have resulted in excess capacity.5 Of course, no one knows when debt levels and capital expenditures may become unsustainable. Value speculators must take into account reflexive considerations, along with their painstaking company-specific research, when interpreting the consequences of short-term trends in fundamentals for companies' longer-term prospects.
The difficulty that reflexive relationships pose suggests that a point may have been reached in the 1990s when value speculators came to believe that their own assessments of the longer-term impact of short-term trends in fundamentals, and of the benefits of the information-technology revolution, had risen too far. At that point, they came to believe that the weights attached to the bullish short-term trends in fundamentals were incorrect, and they revised them in radical ways that reflected lower longer-term assessments.
Short-Term Speculation and Excess
If the market were composed entirely of participants who traded with a view to the longer term, their non-moderate revisions of forecasting strategies would lead them to correct their excessively positive assessments of the impact of fundamental trends on companies' prospects, thereby bringing the upswing to an end. However, short-term speculators have a significant influence on market prices. Their main concern is whether recent trends in fundamentals will continue for another few months or quarters rather than whether they are sustainable over the longer term. Consequently, as long as the basic fundamentals continue to unfold with unchanging trends and short-term speculators continue to revise their strategies in guardedly moderate ways, they will bid stock prices beyond the range of values consistent with their longer-term counterparts' assessments of companies' prospects.
The empirical record suggests that the 1990s upswing was characterized by such excess. Indeed, already by the end of 1996, Robert Shiller's price-earnings ratio stood at 28—almost twice the contemporary historical average of 15. The last time the market had seen price-earnings multiples that high was during the six months prior to the Great Crash of 1929.
Nevertheless, the trends in many basic fundamentals, including current earnings, continued to unfold in favorable directions for another three years. Of course, at each point in time, no one knew whether the favorable trends in fundamentals would continue or whether the revisions of other participants would remain guardedly moderate. At any point during the decade-long upswing, the trends in fundamentals could shift direction or revisions could become radical, which implies that some short-term speculators forecasted rising prices, while others predicted a fall at every point in time.
But, as we argued in Chapter 9, the key to explaining asset-price movements is how the price forecasts of market participants unfold over time. Given favorable trends in fundamentals and the tendency of short-term speculators toward guardedly moderate revisions, short-term bulls and bears in the aggregate raised their forecasts and continued to bid up prices well beyond what they themselves knew was likely to be consistent with most value speculators' assessments of longer-term prospects.
In Chapter 8, we discussed how the trading decisions of short-term speculators contribute positively to the ability of financial markets to allocate society's scarce capital, and yet they can also distort relative prices, because their decisions are not based on the painstaking research undertaken by value speculators. Within a range of values that is consistent with most speculators' assessments of longer-term prospects, the distorting influence of short-term speculators is likely to be relatively muted. Indeed, during the early phase of the 1990s upswing in stock prices, the favorable trends in basic fundamentals most likely led them to buy many of the same companies that value speculators bought.
In contrast, once a price swing becomes excessive, say, from above, the benefits of value speculators' trading decisions disappear as short-term speculators drive ballooning valuations. Moreover, reflexive relationships in the economy imply that bullish trends in fundamentals eventually will send incorrect and unsustainable signals concerning the differing longer-term prospects of companies. As short-term speculators largely base their trading decisions on these signals, there is much more room for the market to distort relative prices and misallocate capital. Overinvestment in technology stocks in the 1990s is indicative of such misallocation.
Of course, the process by which upswings sometimes become excessive also applies to downswings, which are equally likely to misallocate capital by providing incorrect signals concerning which companies should be started, expanded, restructured, scaled down, or liquidated. But another, even more serious danger associated with excessive downswings, which Keynes (1936) emphasized, is that the overall volume of investment falls precipitously and remains depressed for a protracted period of time (see Chapters 7 and 8).
However, although short-term speculators sometimes bid stock prices far beyond the range of non-excessive values, they do not continue to do so without bound. Our IKE account of risk implies that eventually they, too, will radically revise their forecasting strategies, leading to a sustained price reversal—even if fundamentals continue to trend in unchanging directions. This process helps explain why markets eventually self-correct.
LINKING RISK TO DISTANCE
FROM BENCHMARK LEVELS
Financial economists typically portray the riskiness of holding speculative positions with standard measures of short-term volatility, such as the variance of returns. They use these models to account for the premium—a positive expected excess return—that market participants demand for holding speculative positions. As we discussed in Chapter 5, the empirical performance of economists' risk-premium models has been extremely poor.
Keynes's (1936) ideas about speculation in asset markets lead to an alternative characterization of how participants assess financial risk. He argued that speculators are aware of the tendency of asset prices to undergo uneven swings, and that speculators use this feature of their social context when attempting to forecast market outcomes. In discussing why an individual might hold cash rather than risky interest-bearing bonds, Keynes observed that “what matters is not the absolute level of [the interest rate] but the degree of its divergence from what is considered a fairly safe [benchmark] level, having regard to those calculations of probability which are being relied on” (Keynes, 1936, p. 201).6
This insight suggests that a short-term speculator focuses on the gap between stock prices and her perception of the historical benchmark level when assessing the potential capital loss from her speculative position:
Unless reasons are believed to exist why future experience will be very different from past experience, a…rate of interest [much lower than the safe rate] leaves more to fear than to hope, and offers, at the same time, a running yield which is only sufficient to offset a very small measure of fear [of capital loss]. [Keynes, 1936, p. 202]
This insight leads to an alternative characterization of market participants' risk premiums.7 Of course, how a participant interprets the gap between asset prices and benchmark values in assessing risk changes over time in ways that neither she nor an economist can specify fully in advance. Indeed, we present evidence below that the importance individuals attach to the gap when it is historically large is much greater than when it is historically small. However, no one can fully foresee the thresholds above or below which participants might consider the magnitude of the gap to be large or small or how the crossing of these thresholds might affect their assessments of the potential losses from speculation. Consequently, we formalize Keynes's insight as a qualitative regularity: depending on which side of the market a short-term speculator takes, she either raises or lowers her assessment of the potential losses—and thus her risk premium—as prices move farther away from or closer to her perception of benchmark levels.8
Consider, for example, an upswing in stock prices, say, farther above participants' assessments of benchmark levels. A short-term bull forecasts that the price swing will continue over the near-term, whereas a bear forecasts the opposite. Nonetheless, both contemplate the potential losses that they would incur if the asset price were to move against them. If trends in fundamentals persuade bulls to raise their forecasts of future prices, they will want to increase their open positions. “Unless reasons are believed to exist why future experience will be very different from past experience,” they will also raise their assessments of the potential losses of being wrong: the greater the gap from their estimate of the benchmark, the more concerned they tend to be about a reversal. Bears, however, respond in the opposite way to a further rise in prices: they tend to become more confident about an eventual reversal and thus lower their assessment of the potential losses from their open positions.
HOW MARKETS ULTIMATELY SELF-CORRECT
If a market participant's risk premium depends on the gap between the asset price and her assessment of the benchmark level, she will alter the premium that she requires for holding an open position during a price swing—in one direction if she is a bull, in the other if she is a bear. These changes in premiums help account for the fact that long swings in asset markets are ultimately bounded.
To see how they are limited, suppose that persistent trends in fundamental factors and guardedly moderate revisions of forecasting strategies lead bulls to raise their forecasts of future prices; that is, they expect that the return to buying stocks has increased. Acting on this belief, they increase their speculative positions and bid up prices, say, farther above the range of values consistent with most estimates of the companies' longer-term prospects and thus most assessments of benchmark levels.
Even though bulls expect a greater return, they understand that such excessive price swings eventually end, so they increase their assessments of the risk of a reversal and capital losses. The resulting rise in their premiums acts to temper their inclinations to increase their speculative positions. If trends in fundamentals continue, thereby prolonging the excessive price swing, a threshold is eventually reached at which bulls become so concerned about a reversal that they no longer revise their forecasting strategies in guardedly moderate ways. At that point, they either reduce their long positions or abandon them altogether, which precipitates a price reversal. Bears will also change their premiums, but in the opposite direction, likewise contributing to the self-limiting nature of long swings away from benchmark levels.
Our IKE account of risk implies that the market premium in the aggregate is equal to the premiums of the bulls minus those of the bears. As mentioned in Chapter 5, the market premium thus depends positively on participants' assessments of the gap relative to estimates of benchmark levels. Figure 5.4 shows that this qualitative prediction is borne out in currency markets,9 whereas Figure 5.3 suggests that the connection is much less clear in stock markets.
However, Mangee's (2011) Bloomberg data, discussed in Chapter 7, provides evidence that participants in stock markets pay attention to the divergence of stock prices from historical valuation levels when this gap grows large. Three excerpts illustrate how Bloomberg News reported the importance of this consideration:
U.S. stocks fell in a late-day slide amid concern that share prices may have overshot earnings prospects “There are an increasing number of people who think this market is overvalued,” said David Diamond, a money manager at Boston Company Asset management with $17 billion in assets. The Standard and Poor's 500 index is trading at 19 times 1997 earnings, based on a Zacks Investment research survey, 25% higher than its average price-to-earnings ratio of 15.2 since 1980. [February 19, 1997]
“Investors are looking for a reason to sell,” said Gene Grandone, director of investment counseling at the Northern Trust Co., which oversees $130 billion. “With the market in the 7,900 area, people see a market that is a little rich.”…Many investors are uncomfortable with the market's price-to-earnings ratio, which is near the high end of its historic range. [July 7, 1997]
U.S. stocks were mixed….Companies are being punished for any shortfalls because stocks are at historic highs relative to profit forecasts. The S&P 500, for example, trades at 35 times earnings. [April 7, 1999]
Figure 10.3 plots a 12-month moving average of the proportion of days in each month that such gap considerations were mentioned as having influenced the market. For much of the period, they were unimportant, meriting mention on only 2% or fewer of the days each month on average. However, starting in 1997, the importance of gap considerations rose, with the proportion of mentions each month reaching roughly 10% by the end of 1999—precisely during the most excessive phase of the market's upswing. A similar rise occurred starting in the second half of 2008, when the financial crisis led to a sharp and prolonged down-swing, sending the price-earnings ratio from 21 in August of that year to 13 by March 2009.
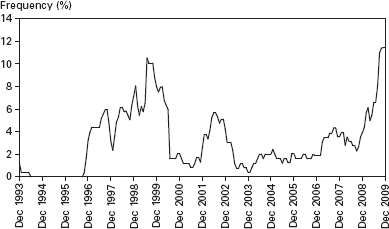
Fig. 10.3. Average monthly frequency of mentions in wrap reports: The price gap from benchmark values.
THE RETURN OF FUNDAMENTALS
Market participants' assessment of financial risk in terms of the gap between prices and historical benchmark levels points to movements in fundamental factors as the key to understanding the main features of financial markets. In Chapters 8 and 9, we showed how trends in fundamentals, such as corporate earnings and interest rates, influence the allocation of capital among projects and underpin swings in asset prices. In this chapter, we showed how trends in fundamentals may lead the market to bid prices up or down to excessive levels. We also showed how these trends, through their influence on asset prices—and thus on the price-benchmark gap—affect financial risk and help explain the fact that markets eventually self-correct.
What enabled us to uncover the key role of fundamentals for understanding financial markets is that, in sharp contrast to extant approaches, we do not assume away nonroutine change and imperfect knowledge. Moreover, by placing these features at the center of our analysis, we are able to recognize the role of psychological factors in driving outcomes. In Chapter 11, we show how a return of fundamentals enables us to avoid the two extreme views of markets held by contemporary economists: that they set prices nearly perfectly at their supposedly true values or that they are prone to psychologically driven bubbles that push prices far from levels that are consistent with fundamental considerations.
1As we show in Frydman and Goldberg (2007, Chapters 9–13), our IKE model provides a significantly better account of risk in the foreign-exchange market than do Rational Expectations models.
2Th ere is much formal research, which we discuss in Chapter 11, showing that stock prices do tend to revert back toward historically moderate levels based on recent and past earnings or dividends. Of course, there are many ways to calculate a benchmark price-earnings level. For example, a moving average of this ratio would deliver a different estimate of the benchmark level than would a fixed historical average. Likewise, price-dividend ratios and other indexes would deliver different benchmark values. But research shows that sustained countermovements also eventually follow departures from historically moderate levels that are based on these alternatives measures.
3This issue is addressed in Chapter 12, when we discuss the policy implications of our IKE account of asset-price swings and risk.
4Similar limits, though based on different considerations, exist in other markets.
5This unsustainability is the key mechanism in Soros's account of how price swings eventually end after a period during which reflexive feedbacks dominate their movements. For example, see Soros (2009).
6For an early formalization of this insight in a model of speculators' decision to apportion their wealth between cash and bonds, see Tobin (1958).
7In Frydman and Goldberg (2007, Chapter 9), we develop what we refer to as endogenous prospect theory, which builds on Kahneman and Tversky (1979) and assumes endogenous loss aversion: an individual is not only lossaverse (her disutility from losses is greater than her utility from gains of the same magnitude), but endogenously so (her degree of loss aversion increases with the size of her open position). More importantly, as Kahneman and Tversky themselves pointed out, their original formulation of prospect theory was based on an experimental setting that, by design, ignored imperfect knowledge. Remarkably, other behavioral economists do not acknowledge this fundamental difficulty. Endogenous prospect theory explicitly addresses this problem and provides a way to formalize all of Kahneman's and Tversky's experimental findings without disregarding the imperfection of knowledge.
8There are no doubt other factors that speculators rely on when assessing the riskiness of their open positions. In currency markets, for example, participants may focus on the size of current-account imbalances and countries' international debt positions when assessing risk. See Frydman and Goldberg (2007, Chapter 12), where we incorporate such considerations into an IKE model of risk.
9Time plots for other major exchange rates show a similar pattern, and formal statistical analysis supports the conclusion of a positive relationship. See Frydman and Goldberg (2007, Chapter 12).