Appendix 4
Multi-Use Plant Lists for Sonoran Desert Communities (and a template for anywhere),
Plant Water Demand Estimators for Where You Live, plus a Sonoran Desert Foods Harvest Calendar
To develop a sustainable or, even better, a regenerative landscape, garden, orchard, vineyard, or pasture that can thrive within your site’s water “income” of harvested on-site waters (rainfall, stormwater, greywater, clearwater, etc.), you’ve got to estimate your water “expenditures:” how much water your plants—both existing and those you plan to plant—will need. This appendix gives you two methods for estimating these water needs so you can consciously balance your site’s water budget.
The first method is geared toward Sonoran desert communities—specifically Tucson, though it also works for Phoenix and Hermosillo. And its multi-use plant lists can be used as templates for developing similar lists for any location and climate. (See the Plants Lists and Resources page of HarvestingRainwater.com for a growing list of multi-use rain garden plant lists for other regions).
The second method for estimating plant water requirements will work for any location for which you can obtain local evapotranspiration (ET) rates. Daily, monthly, and/or annual ET rates are available online for many locations.
To inspire you with the resilient bounty you could grow year round using harvested waters, see the Place-Based Wild and Cultivated Food Plants Calendars section at the end of this appendix. The calendar at the end of this section illustrates Sonoran desert harvest periods for diverse wild and cultivated foods in all seasons of the year. This too can be used as a template for other locations and climates.
Now choose a method to estimate you plants’ water needs. At a minimum, do this for those plants—often trees—that are likely to be your largest water consumers. Once you’ve estimated your plants’ water needs, see if your water demand/expenses/loss is in balance with your harvested water supply/income/ gain. If demand exceeds supply (see chapter 2 for how to determine your potential harvested supplies), you’ll likely need to:
• Reduce your water demand by replacing higher water-use plantings with lower water-use species, enhancing the creation of sheltering microclimates with shade or windbreaks, limiting planting of water-needy annual crops to wetter seasons, implementing more efficient irrigation, and identifying other water-saving strategies.
• Increase your harvested supply by harvesting inputs from more catchment surfaces, cycling/ reusing harvested water sources more times, increasing your site’s harvesting capacity by increasing capacity of earthworks and tanks, and implementing other water availability-generating strategies.
• Use a combination of reduced demand and increased supply (this volume and other volumes in this series show you how).
METHOD 1: ESTIMATING PLANT WATER REQUIREMENTS IN SOUTHERN ARIZONA USING WATER REQUIREMENT ESTIMATOR TABLES
Box A4.1. Approximate Annual Water Requirements for Mulched Vegetable Gardens in Tucson, Arizona, Planted in Sunken Basins
Based on “Economic Value of Home Gardens in an Urban Desert Environment” by David A. Cleveland, Thomas V. Orum, and Nancy Ferguson, HortScience 20(4):694-696.1985
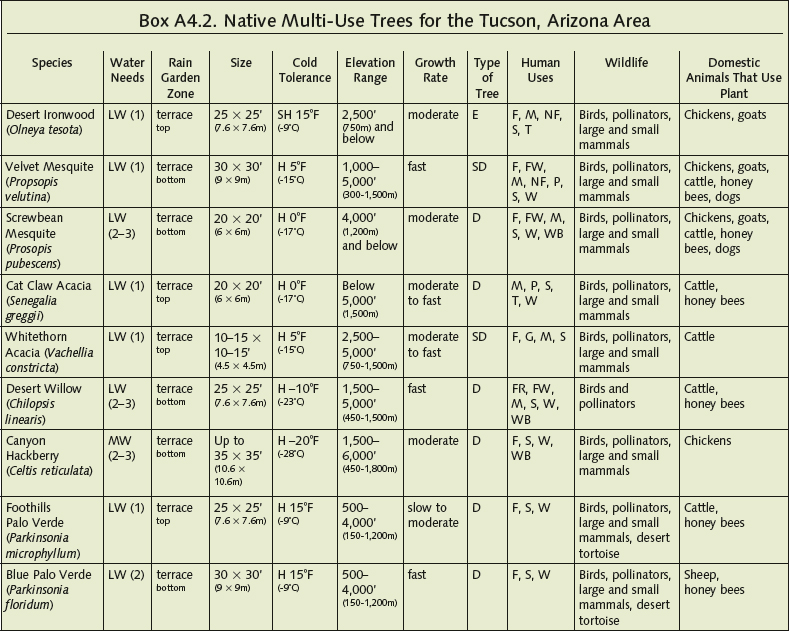
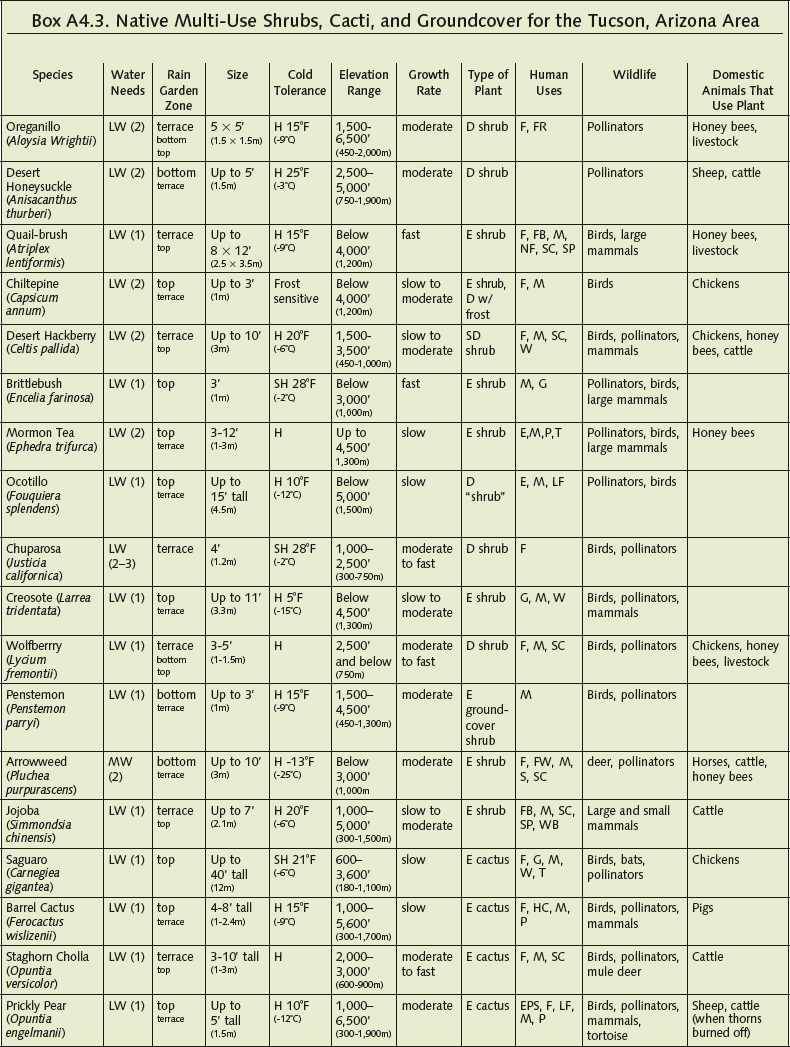
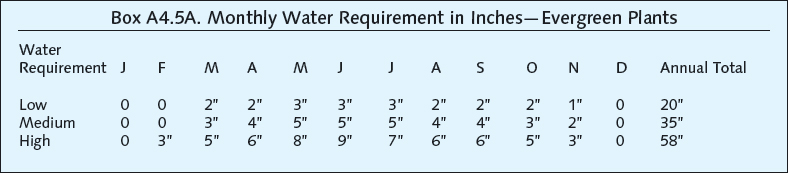
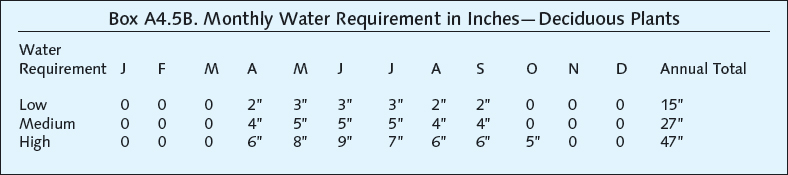
This method estimates water needs for annual vegetable gardens within mulched and sunken water harvesting basins (box A4.1), and perennial vegetation in three multi-use plant lists specific for Tucson, Arizona (boxes A4.2, A4.3, and A4.4). I find this method provides more information and is the more accurate of the two methods if you live in the Sonoran desert. You can quickly see how average water demand changes month by month and you can differentiate the water demand of evergreen and deciduous plants (boxes A4.5A and A4.5B).
However, water needs will fluctuate depending on planting density; soil type; plant placement; and exposure to sun, heat, and wind. These lists provide a partial introductory guide—there is a far more diverse array of suitable plants and cultivars available for this area than listed here.
You can easily calculate the estimated annual or monthly water needs for the listed plants by using the tables to look up their mature size, water needs (low, medium, high), and their evergreen or deciduous nature, then plug these numbers into the simple calculations that follow the lists.
Approximate water needs of plants (plant water-use factors) are listed for each plant in boxes A4.2–A4.4, in the column labeled ‘Water Needs,’ and are as follows:
LW = low water use of 10 to 20 inches (250 to 500 mm) of water per year
MW = medium water use of 20 to 35 inches (500 to 900 mm) of water per year
HW = high water use of 35 to 60 inches (900 to 1,500 mm) of water per year
The numbers shown in parenthesis in the ‘Water Needs’ column signify the approximate frequency that plants need to be irrigated once they become established (which often takes 2 to 3 years), as follows:
(1) = no supplemental irrigation
(2) = irrigation once a month in the growing season
(3) = irrigation twice a month in the growing season
(4) = irrigation once a week in the growing season
Thus a plant listed as LW(1) would be a very low water use plant that does not need supplemental irrigation once it is established.
Ratings are based on the Arizona Department of Water Resources Low Water Use/Drought Tolerant Plant Lists and direct observation.
See Plant Lists & Resources page at HarvestingRainwater.com for more.
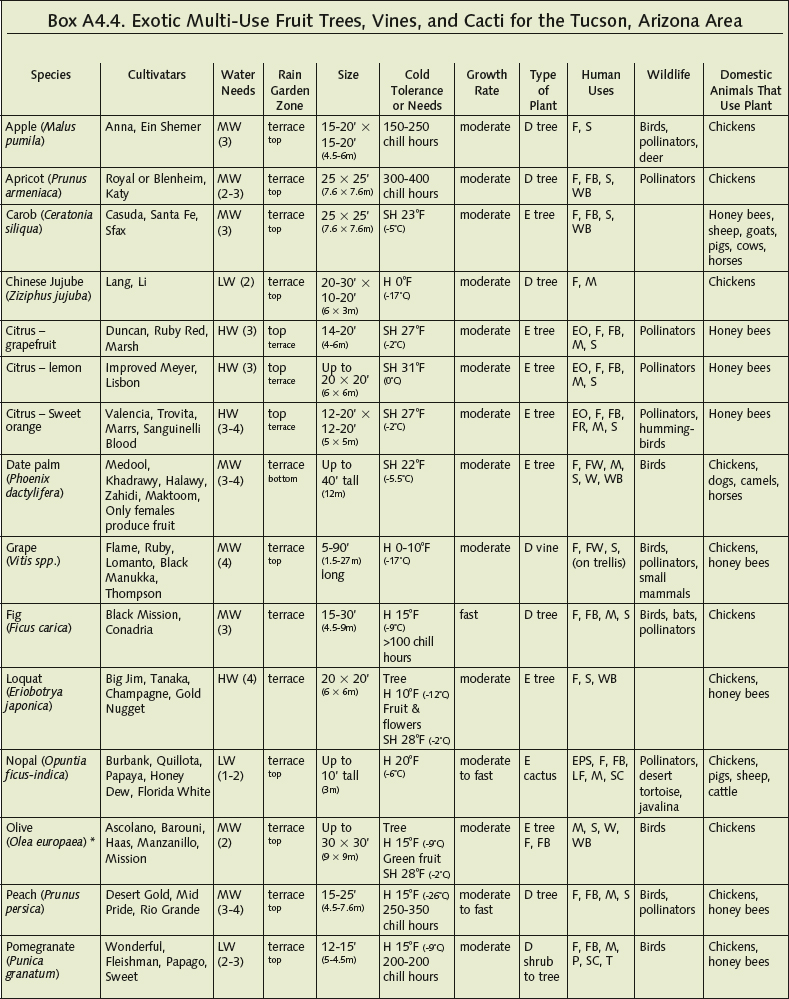
* Order fruiting olives from Santa Cruz Olive Tree Nursery (SantaCruzOlive.com) or Peaceful Valley Farm Supply (GrowOrganic.com).
Preferred rain garden zone for each plant listed (in plant lists’ ‘Rain Garden Zone’ column) signifies each plant’s ideal planting area(s) and moisture micro-climate within or beside a rain garden, (fig. A4.1) with the best placement listed first. These rain garden zones are as follows:
Bottom – typically the bottom of a basin or swale, which is prone to temporary pooling of water and cold air
Terrace – typically atop a terrace or pedestal on a bank of, or within, a basin or swale, where temporary pooling is shallower and less frequent than the bottom zone
Top – area beside a basin—and neither in nor on the banks of the basin—where the plant’s root crown stays high and dry but roots can access water harvested in the basin; including the top of a berm. This is the driest and warmest of the three zones.
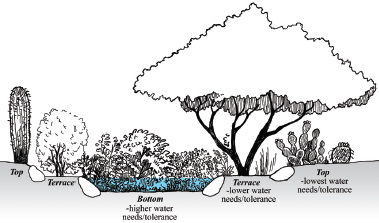
Fig. A4.1. The three rain garden planting zones. See figs. 3.30-3.31 for more.
Abbreviations in plant lists’ columns ‘Cold Tolerance’, ‘Type of Tree/Plant’ and ‘Human Uses’ signify:
D=deciduous, E=evergreen, EO=essential oil, EPS=earth plaster/pigment stabilizer, F=food, FB=firebreak species, FR=fragrant, FW=fiber/basketry/weaving material, G=glue, H=hardy, HC= hair conditioner, LF=living fence, M=medicinal, NF=nitrogen-fixing, P=pigment or dye, S=shelter/shade, SC=screen, SD=semi-deciduous, SH=semi-hardy, SP=soap, T=tanning hides, W=wood/timber, WB=windbreak.
‘Pollinators’ in the ‘Wildlife’ column can include butterflies, native solitary bees, and beneficial predatory wasps.
The vegetation section of the resources appendix of volume 2 of Rainwater Harvesting for Drylands and Beyond lists some of the books from which I compiled information used in the plant lists. I further fleshed out the lists using information from local gardening groups, herbalists, primitive skills enthusiasts, native plant societies, locally owned plant nurseries, and my own direct observations. You can use information sources like these to help assemble your lists too.
How to Estimate the Water Requirements in a Given Month for a Listed Plant in Tucson, Arizona
Note, this section is based on the “How To Develop A Drip Irrigation Schedule” handout from the LOW 4 Program of the Pima County Cooperative Extension/University of Arizona Water Resource Research Center. A similar “plant water requirement estimator” can be created for other areas using evapotranspiration rates for those areas. For additional resources, search online for the Arizona Department of Water Resources’ Drought Tolerant/Low Water Use Plant Lists. They have plant lists specific to Tucson, Phoenix, and the Pinal, Prescott, and Santa Cruz Active Management Areas (AMAs).
1. Identify the plant as evergreen or deciduous, and as having a high, medium, or low water-use requirement. For example, a Velvet Mesquite is deciduous with a low water-use requirement.
2. Determine the canopy diameter of the plant (the diameter of the leafy part of the plant). This can be the plant’s current canopy, but it is best to use the plant’s expected canopy size at maturity because the bigger the plant the bigger its water demand. Let’s say our example mesquite has a 20-foot diameter canopy.
3. Determine the plant’s water requirement in inches for a given month. See the tables in boxes A4.5A and A4.5B, which show how many INCHES of water need to infiltrate into the soil area beneath the plant’s canopy to maintain its health. According to the table in box A4.5B, the June water requirement of our deciduous, low water requirement mesquite is 3 inches.
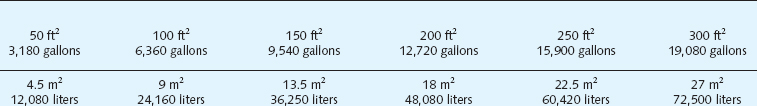
4. Convert the plant’s water requirement from inches to gallons. Find the plant’s canopy diameter in Box A4.5C. Then find the corresponding number of gallons per inch of water beneath the canopy, and multiply it by the number of inches of water required in June to get the total GALLONS of water required in that month.
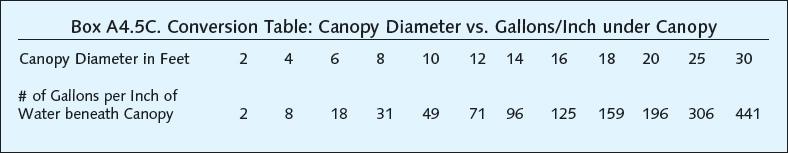
For example, the number of gallons in an inch of water applied under the canopy area of a 20-foot diameter Velvet Mesquite is 196 gallons. The tree needs 3 inches of water in June, so multiplying 196 × 3 = a June water requirement of 588 gallons.
How to Estimate the Annual Water Requirements for a Listed Plant in Tucson, Arizona
Use the tables in box A4.5A or A4.5B to find the plant’s estimated ANNUAL water requirement in INCHES. Multiply that number by the number of gallons per inch of water beneath the canopy area (table in box A4.5C), and the plant’s canopy diameter.
For example, the 20-foot diameter Velvet Mesquite needs 15 inches of water annually, and from Table A4.5C we see that there are 196 gallons per inch of water applied beneath a 20-foot diameter canopy area. So multiplying 15 × 196 = an annual water requirement of 2,940 gallons.
Note 1: Annual water requirement estimates are likely all that you will need to consider when designing a landscape of local native plants that is based on natural wild plant densities and sizes. Such vegetation is naturally adapted to the local rainfall patterns and, once established, can survive the dry periods between rains.
Monthly water requirement estimates are better suited for designing landscapes of exotics or native plants that are planted at a higher than normal density or are irrigated to support larger than normal plant sizes. These estimates give you a better idea of what seasons or months require more water so that you can better plan for needed water storage and the timing of supplemental irrigation with cistern water or greywater.
The water requirements for all plants will increase as they grow because the amount of water they transpire through their leaves increases with the increase in cumulative leaf surface area. Therefore, it is important to plan for the water needs of your plants at their mature size. However, by minimizing the amount of water available to native plants you can reduce their mature size—reducing the need for more water. For example, a Velvet Mesquite receiving approximately 6,600 gallons of water per year can grow to be 30 feet tall and wide, but if only 2,940 gallons of water per year is available to the tree, it will likely not grow to be taller and wider than 20 feet.
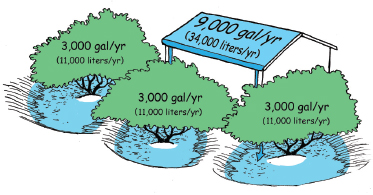
Fig. A4.2A. Annual irrigation demand in Tucson, Arizona, of low-water-use, dry-season-adapted, native mesquite trees met by rainwater supply from roof runoff. Water infiltrated and held in mulched soil of infiltration basins—no tanks needed
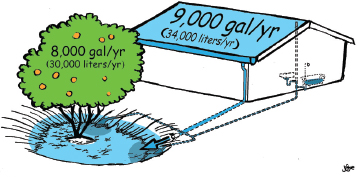
Fig. A4.2B. Annual irrigation demand in Tucson, Arizona, of higher-water-use, dry-season-susceptible, exotic citrus tree met by rainwater supply from roof runoff, and supplemented with greywater in dry times
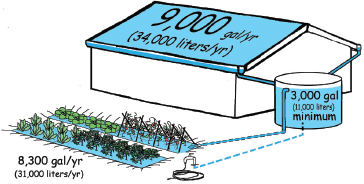
Fig. A4.2C. Annual irrigation demand in Tucson, Arizona, of 130 ft2 (12 m2) high-water-use vegetable garden in sunken, mulched basins. Cistern needed to dole out roof runoff in long dry times. Such a cistern could also be used to irrigate fruit trees in dry season
METHOD 2: ESTIMATING PLANT WATER REQUIREMENTS ANYWHERE USING LOCAL EVAPOTRANSPIRATION (ET) RATES
This section gives you a method of estimating the water demand of your existing and/or planned vegetation wherever you live. It has been partially excerpted and adapted from the excellent guide The Water-Wise Home © and by Laura Allen with permission from Storey Publishing. In this section, I’ve changed Laura’s calculations to estimate monthly irrigation demand, rather than weekly demand—as her book does—to more closely align with the other plant water requirement calculation method presented in this appendix.
As Laura states, “Evapotranspiration, or ET, is the combined effect of water evaporating from the soil and being used (transpired) by plants. In relatively warm, dry climates plants lose more water than in cooler, moister climates. This method assumes that all moisture lost by evapotranspiration will be replaced through irrigation. It factors in the type and size of a plant as well as the climate. You’ll need the following information:”1
1. The area of the plant(s) in square feet (or square meters) at its expected size at maturity—the bigger the plant the larger its water demand.
Good plant books/resources list plants’ average mature size, which as Laura states, “is measured by the area under a mature plant’s canopy; for trees and bushes, this area is shaped like a circle. Planted beds or hedgerows have a rectangular area. Find the area of a circle by multiplying π (3.14) by the circle’s radius (r) squared (Area = π r2). Find the area of a rectangle by multiplying the length by the width.
For example, here’s the calculation for an apple tree that measures 4 feet (1.2 m) from the trunk to the outer branches:”
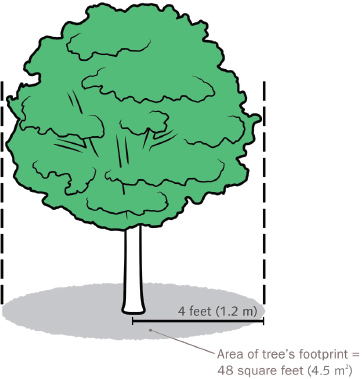
Fig. A4.3. Find the area (A) under a tree’s canopy using A = r2. A circle’s radius is half its diameter. Illustration © by Steve Sanford from The Water-Wise Home by Laura Allen. Reproduced with permission from Storey Publishing.
π × r2 = Area of circle
3.14 × 42 = 50 square feet
3.14 × (4 × 4) = 50 square feet
Or in metric,
3.14 × 1.22 = 4.5 square meters
3.14 × (1.2 × 1.2) = 4.5 square meters
2. The plant’s water-use factor (sometimes called the plant factor or the species factor), which varies with different types or species of plants. The water-use factor “indicates high (0.8), moderate (0.5), low (0.2), or very low (0.1) water use of the plant. Plant and garden books typically provide this information and often represent it with a water droplet(s); a full drop is high, half-full drop is moderate, and an empty drop is low.”2
However, these books often lack a very low water-use-factor, which typically applies to especially drought-tolerant native plants (native meaning those plants indigenous to your area found growing in a microclimate the same as your site). Laura says, “Most fruit trees are moderate-water-use plants. If you can’t find this info in a general reference book, look in the Water Use Classification of Landscape Species” (https://ucanr.edu/sites/WUCOLS/).3
3. The ET rate for your area. As Laura explains, “The rate depends on climate conditions. Typically, ET is given in inches (or mm) per month or per day.” The monthly figure is what’s needed for the formula here. “You can find ET rates online, or ask your local cooperative extension program or water district.”4
The Environmental Protection Agency (EPA)’s Water Sense website has a Water Budget Data Finder tool (https://www.epa.gov/watersense/water-budget-data-finder) you can use to find your peak irrigation month (your hottest, driest month) and subsequent reference ET rate. Visit the tool’s webpage and simply enter your site’s Zip code.
Use this formula to calculate monthly plant water requirements:
Plant monthly water use in gallons = Plant Area in square feet × Peak ET in inches/month × Plant’s Water Use Factor × Conversion Factor of 0.62
Note: A Conversion Factor of 0.62 is used to convert inches to gallons
Or in metric:
Plant monthly water use in liters = Plant Area in square meters × Peak ET in millimeters/month × Plant’s Water Use Factor
Note: No conversion factor is needed in the metric equation
The examples below estimate the water use in four different cities/climates for the fruit tree in fig. A4.3. This fruit tree has a mature-size canopy area of 50 ft2 (4.5 m2) and a moderate plant water-use factor (0.5) with different ET rates for each city provided by the EPA’s on-line Water Budget Data Finder tool. Laura Allen reminds us, “Keep in mind that this data is for the peak irrigation month so you don’t need to irrigate this much all year long. Usually if you stay within 30 percent of this number, either lower or higher depending on your available water, the plants should be happy.”5
CALCULATIONS FOR DIFFERENT U.S. CITIES
Los Angeles, CA. Peak ET occurs in July, at 6.73 inches/month
Highest monthly water use = 50 ft2 × 6.73 inches/ month × 0.5 × 0.62 = 105 gallons/month. (30% less than this would be 74 gallons/month).
Tucson, AZ. Peak ET occurs in June, at 12.42 inches/month
Highest monthly water use = 50 ft2 × 12.42 inches/month × 0.5 × 0.62 = 194 gallons/month. (30% less than this would be 136 gallons/month).
Seattle, WA. Peak ET occurs in July, at 5.42 inches/ month
Highest monthly water use = 50 ft2 × 5.42 inches/ month × 0.5 × 0.62 = 85 gallons/month. (30% less than this would be 59 gallons/month).
Miami, FL. Peak ET occurs in April, at 6.65 inches/ month
Highest monthly water use = 50 ft2 × 6.65 inches/ month × 0.5 × 0.62 = 104 gallons/month. (30% less than this would be 73 gallons/month).
Keep in mind that as Laura points out, “These estimates don’t take rain into account; obviously plants won’t require as much irrigation water if it rains. So, you can subtract the month’s average rainfall from the ET rate for this calculation.”6 The EPA’s on-line Water Budget Data Finder tool also lists average rainfall for each U.S. zip code’s month of peak irrigation demand. The guide for One-Page Place Assessments at the end of chapter 2 shows you how to get rainfall, climate, and evaporation data for any month.
I typically take a conservative approach by not subtracting average rainfall, since rain varies in volume and frequency and I don’t want to underestimate how much irrigation water my landscape will likely need— especially in a drought year.
PLACE-BASED WILD AND CULTIVATED FOOD PLANTS CALENDARS
This calendar builds on the One-Page Place Assessments introduced in chapter 2. They tell another chapter of the story of the challenges and potentials of your place, rooted in the climate and ecosystem where you live.
Figure A4.4 is a Sonoran Desert Foods Harvest Calendar for native and exotic, wild and cultivated, annual and PERENNIAL food plants that grow in the Sonoran Desert. It is not comprehensive, but instead gives you a taste of the wide diversity of climate-appropriate food plants (and their cultivars or sub-varieties) whose different harvest seasons contribute to resilient year-round harvests. For example, there can be a three-week difference between the blooming and harvesting season of two different palo verde tree species. So if both blue palo verde trees (Parkinsonia [formerly Cercidium] floridum) and foothills palo verde trees (Parkinsonia microphyllum) are planted in a yard in the Sonoran Desert, this extends the palo verde harvesting period by three-weeks since you have access to both. In this location, exotic Marrs oranges are ripe in November through February, while Valencia oranges are ripe February through May, and you can bud graft the fruiting stock of both species onto the same tree. The positioning of plants in different microclimates (warmer, cooler, wetter, drier locations) and impacts of climate change can affect where plants can grow and their harvest periods.
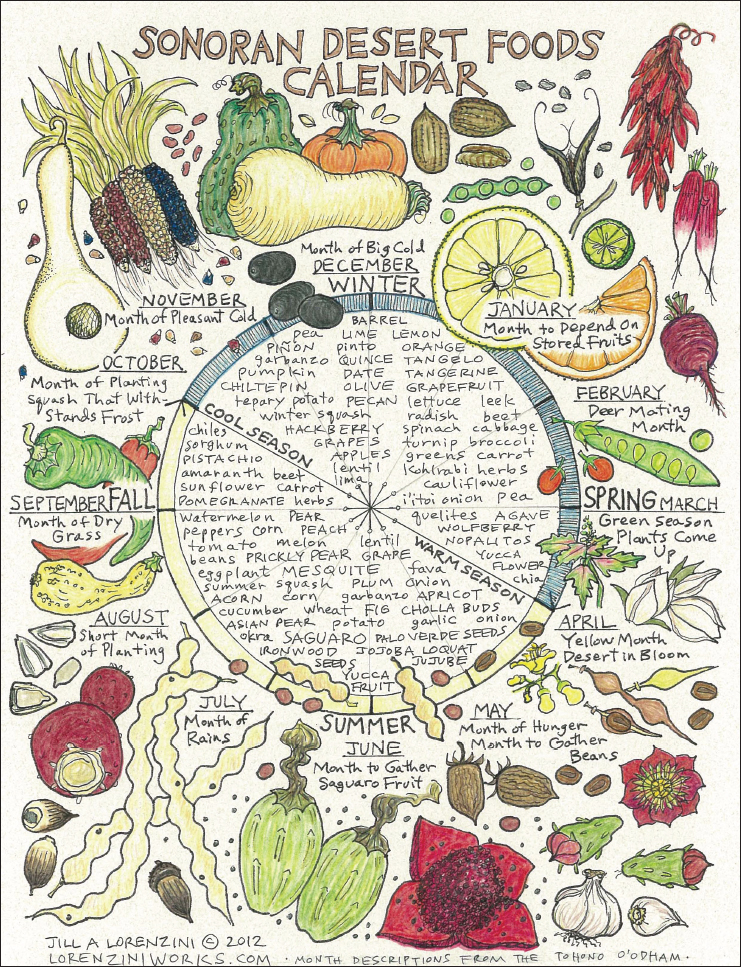
Figure A4.4. Harvest calendar of food plants that grow in the Sonoran Desert. Illustrated by Jill Lorenzini
Plants native to the Sonoran Desert—such as mesquite, ironwood, and palo verde trees—thrive within or next to passive water-harvesting earthworks or rain gardens. Exotic plants—such as citrus and tomatoes—typically need supplemental irrigation from rain cisterns, gravity-fed greywater systems, and/ or air conditioning condensate. Calculate your plants’ water requirements to determine if you have enough on-site water to sustainably meet these supplemental irrigation needs. The plants with an asterisk—such as pistachio, piñon pine, and the Arizona native Emory oak (acorn)—do not grow and produce nuts in the Sonoran Desert, but they do grow in adjacent areas at higher elevations. They remind us to stay conscious of our connections with neighboring communities of plants, people, and whole ecosystems.
I strongly encourage you to prepare a harvest calendar for your location and continually update and expand it. To do this, ask questions of local herbalists, farmers, gardeners, permaculturalists, and localvores; research the local ethnobotanical record; and make your own observations. Find out which plants that can grow and produce in your area are missing from your system and the community. Plant them in locations where on-site, sustainably harvested water sources will enable them to regeneratively produce. Then care for them, harvest them, and share their bounty.
See LorenziniWorks.com for additional, more comprehensive calendars by the artist Jill A. Lorenzini.
See the book Eat Mesquite and More: A Cookbook for Sonoran Desert Foods and Living by Desert Harvesters and DesertHarvesters.org for wild native Sonoran desert food planting, forestry, harvesting, processing, cooking tips, and resources.