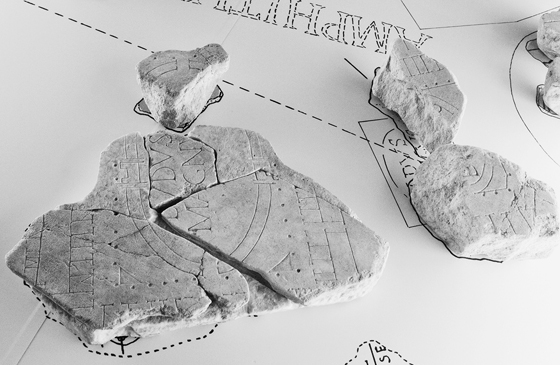
FIGURE 17.1 Marble Plan fragments reassembled for display at the Museo della Civiltà Romana, Rome, Italy. The V-shaped symbol (as in the left foreground here) marks a staircase.
(Photo courtesy of Jeffrey R. Bondono)
FOR CERTAIN, ANY reasonably wide-ranging consideration of communications in classical antiquity would be incomplete if it were to overlook maps. However, to anyone today with a typical Western education and intellectual background the findings are liable to prove a source of puzzlement, as well as a sharp reminder of just how foreign a country the past can prove to be. Incredible though it may seem to us, throughout classical antiquity maps as we know them seldom attained more than marginal importance, and their potential value went largely unexploited.1 A great variety was developed, to be sure, although the number of surviving specimens is frustratingly small. Even so, it is clear that standard conventions for the presentation of a map hardly came to be established. Thus for orientation, scale, and symbology (among much else), common practice was lacking. Hence in the notorious case of a recent discovery on papyrus—a map that admittedly was never finished—scholars’ interpretations of what is being represented have ranged from a single estate to the Iberian peninsula, or even the entire Mediterranean.2
In neither Greek nor Latin vocabulary was there ever a term in use that unequivocally signifies “map,” nor were the very concepts “atlas” and “cartography” articulated; in fact, the former only dates to the sixteenth century, the latter to the nineteenth.3 There was seemingly no profession of “mapmaker,” let alone much in the way of widespread, recognized uses for the range of materials that we today would broadly categorize as maps. If there was a role for maps in formal education (where literature and rhetoric dominated the curriculum), it is all but invisible to us.4 In any case, nowhere in classical antiquity was instruction organized on the scale of the mandatory, publicly funded programs for children instituted in the West in the late nineteenth century; nor was there the mass circulation of materials that the invention of printing made possible from the sixteenth century. By its very nature, any map more complex than a mere sketch is liable to prove a severe challenge to reproduce accurately by hand; far more taxing than a text.
Some use of maps in administration can be detected, but even at best (it seems) this use remained minimal and highly localized. Harder still to detect is the use of maps in the conduct of a state’s foreign affairs, or of its military campaigns by land or sea.5 Private travelers and mariners appear not to have used them much either; their recourse was rather to itineraries in the form of lists.6 Geographical and ethnographic knowledge was successively expanded by such developments as Greek colonization, Alexander’s campaigns, and Augustus’ expansion of the Roman Empire, northward especially.7 Ironically, a succession of Greek scientific thinkers at Alexandria—from Eratosthenes in the third century BCE to Ptolemy in the second century CE—did successfully formulate principles (which remain standard today) for representing the earth’s curved surface on a two-dimensional plane, and for attempting to fix and record specific locations by means of latitude and longitude coordinates.8 On a technical level, however, not even these scientists were able to measure either distance or time with precision, and in consequence, accurate calculation of longitude in particular was beyond them. For several centuries, dissemination and exploitation of these methods and results barely extended beyond the scientists’ own very restricted circle, not least because widespread communication of their learning was of minimal concern to them. In a surprising development, their work may have become somewhat better known during the second century CE after Ptolemy developed a more concise, “user friendly” style for expressing coordinate figures; but, as will emerge below from a curious test case, this spread of knowledge was not enough to stimulate keener recognition for the value of maps.
From today’s Western perspective, therefore—in our highly literate cultural environment where maps are a well-defined genre with familiar standard characteristics, and are taken for granted as invaluable sources of information, through digital media especially—this indisputably limited exploitation of maps is sure to seem a huge missed opportunity. The sense of disappointment (insofar as that is an appropriate attitude in this context) is only deepened by awareness that at least one other major ancient civilization did develop a remarkable map consciousness; namely, China, although its creative reliance upon maps was never matched by the establishment of fundamentals that Eratosthenes and his successors achieved.9 Meantime, in classical antiquity, despite that achievement, whatever further conditions or mindset might have empowered a breakthrough to a more engaged level with maps never emerged; such a breakthrough could have occurred, but it did not.
We should bear in mind that similar inconsistency has long continued to occur elsewhere, too, even under otherwise favorable circumstances. For example, although Arabic scholars demonstrated immense enthusiasm for the methodology and coordinates in Ptolemy’s Geography—a work known to them from the ninth century, it seems—this knowledge never led to latitude and longitude being made the basis for Arabic mapmaking.10 Equally, as late as the start of the twentieth century, Britain’s political agent and consul at Muscat could be cautioned against undue exertion to gather intelligence on his surroundings in the Persian Gulf. His informant wrote privately: “I know from experience that the FO [Foreign Office] has a distinct distaste for acquiring geographical knowledge.”11 Despite sporadic efforts by the War Office and the Admiralty to remedy the deficiency, lack of maps (or disregard for them in certain instances) had contributed to serious defeats suffered by British forces in the Crimean and Boer wars. On the outbreak of war with Germany in 1914, a mere century ago, the Geographical Section of the General Staff (formed in 1906) was able to supply large-scale maps of Belgium and France, but there was no index of what The Times later termed their “horribly unpronounceable place names,” and no overall map of Europe available even at as modest a scale as 1:1 million.12
A striking feature of Roman mapmaking as we know it from what survives is the ingenious creation of maps whose varied character consciously transcends the scientific and factual. Such maps represent initiatives by anonymous artists who developed dynamic cartography of a type that perhaps had no counterpart earlier in the Mediterranean world except to a limited degree in Egypt.13 These artists astutely perceived the appeal and potential of maps in the range of media that could be exploited to justify and celebrate the spread of Roman rule. The concern to communicate to Roman society through maps in this way is especially thought-provoking. While little enough relevant material survives, there happens to be more than for any other type of Greek or Roman mapping; hence my choice to focus this chapter on the Roman case. A further reason to do so is the relative novelty of an approach that considers these maps primarily in relation to their ancient makers and viewers, rather than preferring to pursue perspectives and questions that occur to modern viewers. They naturally enough expect maps to be factual, practical resources, and until the 1980s, there was scant concern even among scholars to question whether or not this was the assumption in antiquity, too. Only then did a decisive shift ensue in how mapping among pre-modern societies generally should be approached and evaluated. The shift was set in motion by Brian Harley and David Woodward with their launch of the transformative, ongoing History of Cartography project.14 Inevitably, application of their approach has taken time to gain momentum, and the claims and conclusions stemming from it remain controversial and still in process of formation.15 Issues of communication are central to this approach—both what mapmakers were meaning to convey, and the range of reactions we may fairly imagine to have been forthcoming from viewers or readers.
ISSUES OF COMMUNICATION are plainly evident in a passage from a Latin panegyric delivered in the late 290s CE that refers to one or more maps (all now lost). The speaker, Eumenius, is the new head of a school of rhetoric at Augustodunum (modern Autun) in Gaul, which has suffered damage. He seeks the provincial governor’s permission to rebuild it at his own expense. A feature of the school that is already in place, apparently intact, is a large map of the orbis terrarum (and possibly some regional maps, too); the governor has even seen it himself. In the climax to the speech, Eumenius expands upon the potential value of the large map:
In [the school’s] porticoes let the young men see and examine daily every land and all the seas and whatever cities, peoples, nations, our most invincible rulers either restore by affection or conquer by valor or restrain by fear. Since for the purpose of instructing the youth, to have them learn more clearly with their eyes what they comprehend less readily by their ears, there are pictured in that spot—as I believe you have seen yourself—the sites of all locations with their names, their extent, and the distance between them, the sources and mouths of rivers everywhere, likewise the curves of the coastline’s indentations, and the Ocean, both where its circuit girds the earth and where its pressure breaks into it.
There let the finest accomplishments of the bravest emperors be recalled through different representations of regions, while the twin rivers of Persia and the thirsty fields of Libya and the convex bends of the Rhine and the fragmented mouths of the Nile are seen again as eager messengers constantly arrive. Meanwhile the minds of those who gaze upon each of these places will imagine Egypt, its madness set aside, peacefully subject to your clemency, Diocletian Augustus, or you, unconquered Maximian, hurling lightning upon the smitten hordes of the Moors, or beneath your right hand, Constantius, Batavia and Britannia raising up their grimy heads from woods and waves, or you, Maximian Caesar [Galerius], trampling upon Persian bows and quivers. For now, now at last it is a delight to examine a picture of the world (nunc demum iuvat orbem spectare depictum), since we see nothing in it which is not ours.16
For all his rhetoric, Eumenius’ description of the map leaves no doubt that its maker had aimed to make it a large creation, geographically accurate and comprehensive, extending—with its orientation unknown—north to Britain, south far up the river Nile, and at least as far east as Mesopotamia (the land of the “twin rivers of Persia”). There is no knowing the map’s origin: whether it was in fact a copy of a map already to be found elsewhere, or whether it was a product tailor-made for the prescribed needs of the Augustodunum school and for the specific location where it was displayed there. The natural inference is that its representation of physical geography derives from the Alexandrian cartography instituted by Eratosthenes. This cartography as we see it reflected most fully in Ptolemy’s Geography maintained a scientific, objective approach: it aimed to span the world and avoided close linkage with any political power or specific period of time. In consequence, a user of the Geography is barely made aware of the existence of the Roman Empire, or of the relative size and importance of the principal cities within it, including Ptolemy’s own Alexandria; the feature that happens to be central in Ptolemy’s rendering of the world’s geography is the Persian Gulf.17
Others, however, had grasped the potential for them to derive added or alternative significance from a map of this accurate, comprehensive type, because it offered an ideal medium through which to encapsulate the Roman imperial achievement. Seemingly, the earliest Roman patron to realize such potential was Augustus’ close associate Agrippa, who commissioned a now-lost world-map, whose design has attracted endless scholarly speculation.18 At least there is no cause to doubt that it was large in size and scope, as well as geographically accurate in character, and that it remained on permanent display to the public in the Porticus Vipsania at Rome: orbis urbi [or orbi] spectandus.19 As envisaged by the panegyrist Eumenius, the map in his school was to serve a similar dual communicatory role—to be informative about physical and cultural geography, and to raise pupils’ awareness of Rome’s imperial achievement and their pride in its revival by Diocletian’s Tetrarchy.
In terms of communication, the large display-maps of Agrippa and Eumenius reinforced a traditional Roman taste (extending far back into the Republic) for publicly displaying objects or documents or images that both informed Romans and boosted their pride. The variety of expressions developed for these displays expanded with the consolidation of the Principate and the conscious sense of empire fostered by Augustus and so confidently projected in his Res Gestae.20 The duration of the displays, too, expanded from ephemeral (as in the case of many objects and images carried in triumphal processions)21 to long-term or permanent (as most obviously with texts inscribed on metal or stone). Among display-maps, variation in the balance between the “informative” and “boastful” elements is to be expected. The large-scale bronze or stone map of its “centuriated” land that each Roman community was expected to keep on public display doubtless had the capacity to boost the pride of, say, a Roman colony planted in a newly subdued region; but still it is appropriate to regard these land-maps as designed primarily to serve legal and fiscal purposes.22 As its primary purpose, Eumenius’ map was evidently intended to be a resource for fostering awareness of geography on an expansive scale, although the associated prospect of boosting Roman pride in the process was far from being a negligible secondary aim.
TWO LARGE ROMAN display-maps, substantial parts of which survive, each offer in their own different way powerful instances where it can be argued that the makers have been sufficiently bold and creative to swing the balance decisively in the opposite direction, rendering the communication of Roman pride the primary purpose and relegating the map’s informative element to a subordinate role. We lack testimony for how either map would have been referred to in antiquity. Today they are typically called the “Forma Urbis” or “Rome’s Marble Plan,” and the “Peutinger Map.” In each case, the emphasis adopted is a deft accomplishment, insofar as the informative element remains very substantial. As a result, only when the communicatory impact of each map is considered within the context intended for its display does the maker’s priority become clear. In each instance, it may be said, failure to attach sufficient importance to the matter of intended context has been a serious flaw in modern scholars’ interpretation of these maps.
In the case of the Marble Plan, in my view this shortcoming has been fully remedied by fresh studies made first by David West Reynolds and more recently by Jennifer Trimble.23 Both these scholars in turn have taken careful account of the ancient context, which is fortunately well established. The very wall in Rome that the 150 marble slabs composing the giant city-plan (scale 1:240) were once clamped to survives as the exterior back wall of the Church of Saints Cosmas and Damian, and the clamp-holes remain visible. This wall, we know, formed one end of a long interior space in the Templum Pacis complex, renovated around 200 CE after a fire. Viewers could stand well back, therefore. They needed to do so in order to see anything of the Plan erected there then, because its base was positioned at least 4 meters above floor level; from that point, the Plan extended upwards for more than 13 meters, across a span of approximately 18 meters. Altogether, therefore, this immense inscribed monument covered about 235 square meters, stretching as high as a modern building of four to five storeys. Lighting conditions within the interior space are unknown. All the same, there can be no question that most of the astonishingly rich detail shown of the city at ground level, which we can easily marvel at today from viewing the fragments close-up—noting even individual columns, as well as the smallest rooms with their doorways—could seldom, if ever, have been appreciated by ancient viewers (Figure 17.1).24

FIGURE 17.1 Marble Plan fragments reassembled for display at the Museo della Civiltà Romana, Rome, Italy. The V-shaped symbol (as in the left foreground here) marks a staircase.
(Photo courtesy of Jeffrey R. Bondono)
Thus the Plan’s placement rendered it impossible to communicate its detail adequately to the viewers at floor level. Without doubt, its makers were fully aware of that limitation from the outset. However, they never intended the Plan to serve any practical use, although its data must have been derived (with some simplification) from painstaking official surveys of the city presumably preserved on papyrus and never intended for circulation. Rather, the makers’ main intention was to communicate messages of a broader nature, and above all to fire Roman pride. At the same time, it may not have escaped them or their high-ranking sponsor (conceivably the emperor Septimius Severus himself) that quite the opposite responses might be stirred, too: for example, fear and loathing at such arrogant Roman control of the environment, both built and physical; the command of extensive resources, both human and natural; and the extraordinary level of urban so-called civilization. But possible rejection of this type was likely to be dismissed as merely irrelevant mis-communication of no concern to the Plan’s makers.
THE CASE OF the Peutinger Map (named after its sixteenth-century owner Konrad Peutinger) is more awkward and delicate.25 It is awkward because not just the left-hand end is lost to us (leaving the extent of that loss a matter of conjecture); lost, too, is any trace of the original Late Roman map itself. All that survives is an incomplete medieval copy made on parchment around 1200 (Figure 17.2). Inevitably, therefore, uncertainty and argument persist about the extent to which the map in this form has been “improved,” as well as miscopied, by an irrecoverable succession of alternately well-meaning or careless scribes over almost a millennium. To add to all this awkwardness, our copy offers no pointer to the context for which the original map was produced, let alone to the nature of the surface on which it was presented; and clues to determining at all precisely the date of the map’s original production are minimal at best.
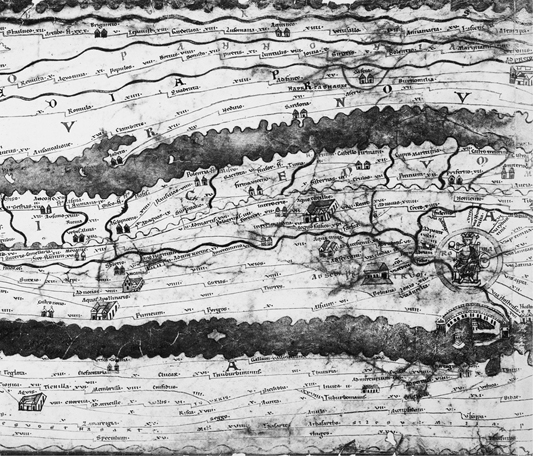
FIGURE 17.2 Peutinger Map, part of Segment 4 (Österreichische Nationalbibliothek, Cod. Vindob. 324).
(Tabula Itineraria in Bibliotheca Palatina Vindobonensi Asservata Nunc Primum Arte Photographica Expressa. Vienna: Angerer and Göschl, 1888)
The case is made delicate by the fact that, although lively scholarly interest in the Peutinger Map has been maintained ever since its undocumented “rediscovery” around 1500, this interest has remained narrowly fixated on the land routes shown—a distinctively prominent and colorful feature—and the factual accuracy of their presentation. Accordingly, in recent work of my own, I have sought to widen the focus by addressing fundamental issues concerning the map’s design that traditionally have been taken for granted or accorded only minimal attention. It is also vital in my view to imagine the context in which the map was to be presented originally, along with the impression that it was intended to communicate there to its viewers. In what follows, I draw upon my conclusions already published elsewhere without any pretension to claiming that they are definitive.
Interpretation is called for to account for the shape and content of the map: in particular, its extreme length (as we have it, a little under 7 meters) contrasted with marked squatness (about 33 centimeters tall);26 its spanning of the entire known world as a seamless whole without boundaries anywhere; the privileging of land over sea, with much open water removed; and the placement of the city of Rome. I see Rome as purposely sited at the center of the map—a most conspicuous placement, therefore, but also a very disruptive one for the mapmaker (Figure 17.3). It calls for equalizing coverage westwards from Rome to the Atlantic (presumably, at the now-lost left-hand end), with the same length eastwards from Rome for the much greater distance (on the ground) to Sri Lanka. The mapmaker’s ingenious solutions to these challenges are first to present Italy (Rome’s heartland) as uniquely large, and then to subject the presentation of Persia and India to severe compression. A notable consequence is that the Mediterranean dominates the map.27 Moreover, the tracing of land routes everywhere, while it may indeed appear informative and without doubt must derive from factual sources (itineraries especially),28 is at best of limited practical value, given the virtual elimination of a North–South dimension and the extraordinary distortions required to accommodate the placement of Rome.29 Needless to emphasize, the map lacks a consistent scale; in consequence, the length noted for any stage of a route bears no relation to the distance to be traversed on the ground for that stage.

FIGURE 17.3 Proposed outline layout of the original, complete Peutinger Map (assuming that the equivalent of three parchments is now missing from the left-hand end).
(Courtesy of Ancient World Mapping Center)
In my estimation, it follows that the traditional literal-minded reading of the map as a practical route guide for land travelers, and nothing more, is a mistaken one; the map simply does not fulfill scholars’ eager wish to recover such a document from the Roman empire. Rather, the map is to be regarded as closer to the Marble Plan in its nature and purpose, although the map’s design demanded far bolder cartographic creativity and adaptation than did that of the Marble Plan. The Peutinger Map was meant to reinforce claims—likewise advanced in literature and other artforms, including coinage—promoting Rome’s rule of the world and even of the cosmos.30 For communicating that aim, general impression mattered most, and the detail (as on the Plan and on monuments like Trajan’s Column) had no more than secondary importance; it does not even relate consistently to the same period. This is certainly not to deny that care was taken over the gathering and presentation of detail, nor that it could make an impact. Viewers able to inspect it and understand it on the map, for example, could marvel at the remarkable inclusiveness generated by the marking of well over 1,000 settlements too minor to attract the scientific attention of Ptolemy (whose Geography in any case overlooked routes altogether).
The date and context of the original Peutinger Map can only be matters for speculation.31 I consider it most appropriate to associate them with the recovery of the empire by Diocletian’s Tetrarchy around 300 CE (the same period in which Eumenius stressed the value of the map in his school), although a production date somewhat later in the fourth century—in 336, for example, when Constantine celebrated thirty years of rule—is not to be ruled out.32 The map’s extraordinary shape seems our best clue to the context for which it was designed. It may conceivably have formed only part of a larger artwork now otherwise lost—the surviving “landmap,” for example, being one of a set of three that also included counterparts for the sky and the sea. Or perhaps what survives is the oikoumene part of a tall globe image divided (according to traditional Greek thought) horizontally into “zones.” The representation of this habitable part (oikoumene) of the northern hemisphere between the frigid Arctic and the torrid equatorial zone (both barely habitable) would act to highlight the thriving peace, civilized urbanism, and secure connectivity maintained by Roman rule here, in stark contrast to impoverished barbarism, isolation, and conflict elsewhere.33 The formal court procedure newly instituted by Diocletian’s regime required payment of groveling homage to a Tetrarch: ideally, the ceremony occurred in a hall (aula) where his throne was set in an apse at one end. A tall globe image of the type just envisaged (painted on panels, say) would loom as a powerful backdrop in such an apse, especially when the city of Rome at the center of the oikoumene would then appear most prominent directly above where the Tetrarch sat (Figure 17.4).
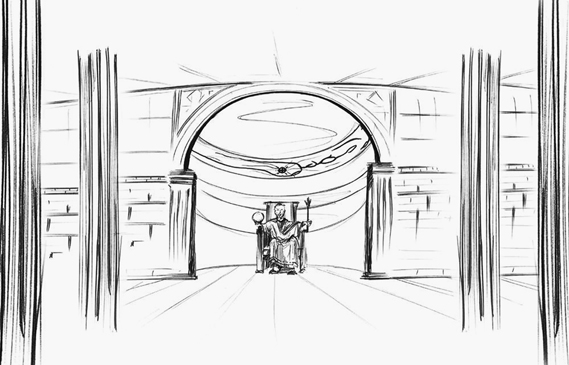
FIGURE 17.4 Globe-map image imagined within the apse of a Late Roman aula where a ruler sits enthroned.
(Courtesy of Daniel Talbert)
Matthew Canepa’s study The Two Eyes of the Earth: Art and Ritual of Kingship Between Rome and Sasanian Iran (2009) gives reason to suspect a further possible dimension to the Peutinger Map’s all-encompassing communication of Rome’s claim to world rule. He draws attention to assertions by the Sasanian dynasty that its empire, too, conceived of itself as “a universal domain that ruled the entire civilized world under a divine mandate,”34 with “the Sasanian king of kings reigning at the center of Iran, Iran at the center of the empire, and the Sasanian empire at the center of the earth.”35 Given that the Tetrarchy was a period of active diplomacy and warfare between Rome and Persia, with Rome decisively gaining the upper hand, the map could be regarded as an item in the “agonistic exchange” (Canepa’s phrase) between Roman and Sasanian rulers. For certain, Sasanian envoys who saw it would only be provoked to find Persia diminished in size and marginalized, while Rome occupied the center and dominated the world. Altogether, the map communicated Roman imperial reach, power, and values even more ambitiously than the Marble Plan.
THE MORE OR less severely distorted forms in which the shape of the Peutinger Map required the known world’s landmasses to appear can hardly have been how its informed makers regularly envisaged them. Rather, they must have adapted representations that reflected the scientific Alexandrian ideas and methods initiated by Eratosthenes. These ideas and methods unquestionably also underpin a neglected group of objects that communicate geographical knowledge and Roman values, one that might even have stimulated wider appreciation of maps, but evidently did not. This group is a type of portable sundial. The optimal functioning of any sundial demands some grasp of the concept of “latitudes” or parallel lines imagined by Eratosthenes as encircling the globe; each such line is situated at its own distinct angle in relation to the sun, with the angle varying according to the time of year.36 So, for its satisfactory operation, a fixed sundial’s design takes into account the latitude at which it is to be installed. Without doubt, by the first century CE, fixed sundials were commonly to be found across the Roman Empire in both public and private settings, and served as the main instruments in use for telling the time. Portable Roman sundials were also developed, which can be adjusted to tell the time at whichever latitude the owner happens to be, over a considerable range.37
It has so far escaped scholars’ attention that one group of such portable sundials offers us the prospect of gaining insight into the worldview of some individual Romans, because on the reverse of these sundials is inscribed a list of city- or region-names (up to as many as thirty-six), each with its latitude figure (Figure 17.5). Hence, in principle, when the owner wants to tell the time in any of the locations listed, he or she will at once be informed of the latitude to which the sundial should be set without the need for further reference or inquiry. One dozen or so portable sundials with lists of this type are known. As representative examples,Tables 17.1 and 17.2 offer four lists inscribed in Greek and five inscribed in Latin.
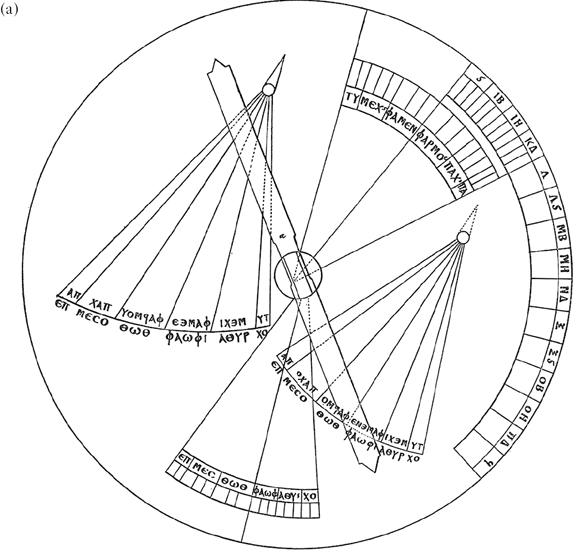
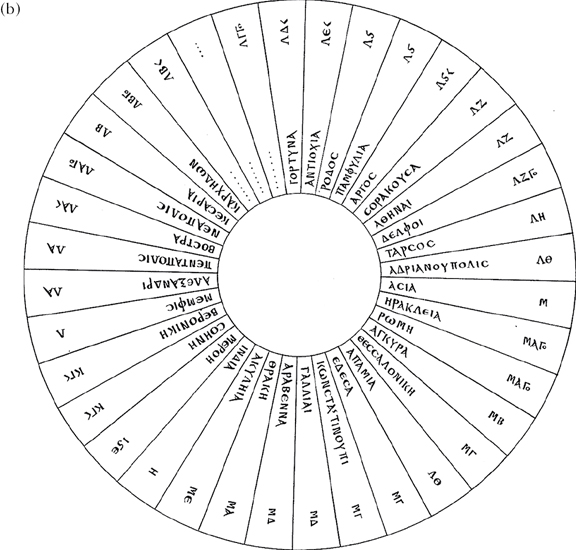
FIGURE 17.5 Constantin von Tischendorf’s drawing of his portable sundial disc acquired in Memphis, Egypt, around 1859. He did not record its dimensions, and it is now lost.
(von Tischendorf [1860], 73)
Table 17.1 Lists of Names Inscribed in Greek on Four Portable Sundials (Courtesy of Author)
|
|
Table 17.2 Lists of Names Inscribed in Latin on Five Portable Sundials (Courtesy of Author)
|
|
It is immediately evident that the names chosen are an eclectic mix. On the one hand, they include major, prominent cities, regions, and provinces—Alexandria, Constantinople (former Byzantium), Italy, Gaul, and Spain, for example—that seem predictable choices when coverage of a wide span is intended (Map 17.1). On the other hand, some less predictable choices occur that most probably reflect the particular movements or links of the individual who compiled or commissioned the selection, presumably for personal use. Consider, for example, Neocaesarea in the British Museum, London (Greek) list,38 or the many cities in the Aegean area in the Memphis (Greek) list.39 Equally, inclusion of both Pannonia Inferior and Pannonia Superior in the Mérida (Latin) list40 suggests a deliberate personal preference; when the latitudes of these two provinces differ by so little, the inclusion of both names is in effect rendered redundant.
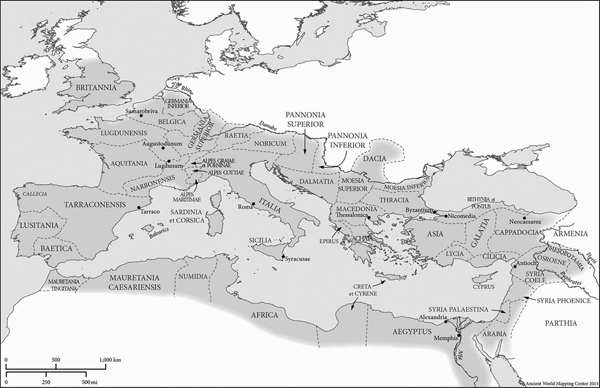
MAP 17.1 Roman Empire around 200 CE
Did whoever compiled such a list of names and figures have some awareness of the geographical relationship of the locations chosen for inclusion? Yes, judging by two lists at least. First, the names on the Aphrodisias sundial (Greek) list—presented as a continuous round—may give the initial impression of being just a random jumble without even a designated starting-point (Figure 17.6).41 The order here really is deliberate, however, because the names can be visualized to form an outline periplous or periegesis of the Mediterranean, including some of its greatest cities (Map 17.2).42 Second, the placement of one particular name in the Vignacourt/Berteaucourt-les-Dames (Latin) list is revealing.43 Here, as in several other instances (the Memphis list, for example), the order of the names is determined by the numerical sequence of their latitude figures. It follows, therefore, that the compilers of these particular lists had both the wish and the capacity to create for themselves a “mental map” reliant upon latitude as its organizing principle.
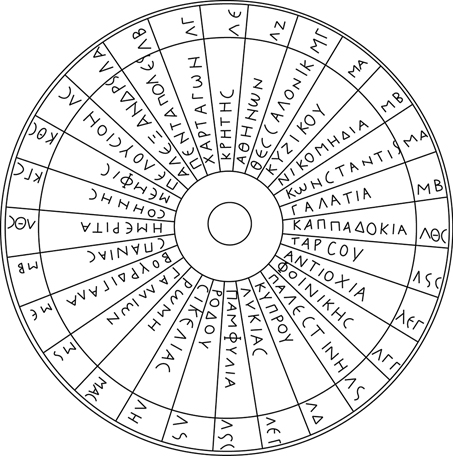
FIGURE 17.6 Portable sundial found at Aphrodisias, Turkey, in 1963 (inv. no. 63–400; since lost): drawing of the reverse.
(Courtesy of Ancient World Mapping Center)
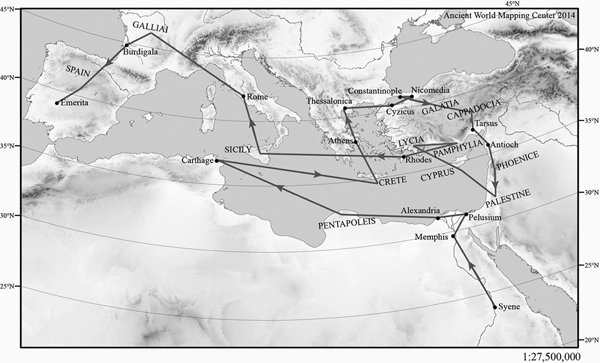
MAP 17.2 Names on the portable sundial found at Aphrodisias (see Table 17.1) marked on a modern locator map at the latitude stated for each, with a route added. Accurate longitude is assumed.
Strikingly, however, the compiler of the Vignacourt list did not rely upon latitude alone, because there is a glaring departure from the latitudinal sequence to be noted here: Belgica 48, with Lugdun-um/-ensis 46 and Aquitania 45 to follow in one direction, and Noricum, Raetia, Illyricum (all 46) in the other. This compiler’s geographical “mental map” evidently envisages the Gallic provinces Aquitania, Lugdunensis, and Belgica as three adjacent blocs; hence the wish not to separate Belgica from the other two here, even though its name must occur out of latitude order in consequence. This said, it is plain that, by the same token, the compiler could also have switched the order of Narbon-is/-ensis and Callecia, so that Callecia (the northwest region of Spain) would then come next to Spain in the list, and Aquitania, Lugdunensis, and Belgica next to Narbonensis. Why the compiler did not switch the order of Narbon-is/-ensis and Callecia is impossible to say. Possibly he (or she) was disinclined to depart from latitude order, but was nonetheless tempted to indulge just a single exception for what may have been his own “home” province; the villa site at Vignacourt where this sundial was found is near Samarobriva (modern Amiens) in Belgica.
If we may infer that the compilers of all these lists had an awareness of the geographical relationship of the locations they selected, then, in turn, some comparison of the relative latitudes they assign to them promises to prove instructive. For example, note how in the Aphrodisias list—to judge by the latitudes stated—both the city of Nicomedia and the region/province of Galatia are located at the same latitude, 42, one that sets them both north of Constantinople 41. Two other names here with surprisingly high latitude figures are Thessalonica 43 and Palestine 36; the latter figure sets this region/province distinctly to the north of (Syria) Phoenice 33.33 and even of (Syrian) Antioch 35.33. In the compiler’s mental map, was Palestine truly there, so far north? If so, this seems a distressing lapse in the geographical grasp of a manifestly educated individual—one who felt able to envisage the entire Mediterranean world, and was sufficiently preoccupied by latitude to record many figures to a fraction of a degree. However, the latitude figures here may matter less than the names as an indicator of geographical awareness, because the sequence of names still outlines a viable circuit for a periegesis, even if the sundial would not function at its best in Palestine with the latitude set at 36.
When a comparison of relative latitudes in the lists on other sundials is made, once again, lapses in the geographical grasp of educated individuals are unmistakable. To be sure, engravers’ slips as well as muddles of one kind or another must be taken into account, but even after such allowances are made, notable shortcomings remain. Consider the relation of Spain 35 to Africa 42, seven degrees farther north in the Crêt-Châtelard (Latin) list;44 also the figure 37 for Illyricum (at the actual latitude of Syracuse, therefore!) both here and in the very similar Rome (Latin) list.45 Consider Bithynia 44, Cappadocia 43, and Galatia 40 (as many as three degrees farther south) in the Time Museum (Greek) list.46 In the same vein, the latitude figures in the Mérida list place Tarrac-o/-onensis 44 to the north of Narbonensis 43.5. Note also Neocaesarea 44; Cappadocia, Asia, and Constantinople all at 43; and Bithynia 41 in relation to one another in the British Museum, London, list. Most strange are Galatia 45, Phrygia 36, Bithynia 35 in relation to one another as well as to Lycia, Cilicia, Asia, and Cappadocia (all four at 31) in the Museum of the History of Science, Oxford (Latin) list.47 Also strange here is the wide interval between the adjacent figures 46 for Pannonia and 52 for Dacia; finally, compare the latitudes here for Spain 42, Africa 41, and Sicily 41, all of them to the north of Sardinia 40.
Undoubtedly, the initial impression communicated by the names and corresponding latitude figures listed on these portable sundials is that their owners enjoyed a confident geographical awareness matched by a wide-ranging worldview that seamlessly spanned the Roman Empire and beyond to the north, east, and south. In addition, there can be no question that many more cities, regions, and provinces were known to them than just those that they (or a designer) chose to include in the limited space available on these small portable sundials. For all this show of confidence, however, the unique opportunity that the inclusion of associated latitude figures offers us to assess the accuracy of the owners’ geographical awareness alters our initial impression. As we have seen, it emerges on investigation that there were no “standard” latitude figures for locations, and that serious misconceptions are widespread here. To eliminate or reduce such errors, it would clearly have been a useful precaution to check each list of names against a map made according to Alexandrian cartographic principles; but it seems that such checks were not performed and, of course, unfailing accuracy is not to be expected of such maps, anyway.
The owners were evidently not bothered by these flaws and inconsistencies. They already carried a mental map in their heads, one for which Rome’s provinces may conceivably have been a framework.48 The names by which they remembered the provinces—even after the foundation of Constantinople, included in all four lists in Table 17.1—remained the old forms, without regard in particular to the radical changes in provincial organization and nomenclature introduced by Diocletian.49 Not so much as a hint remains of how the scientific knowledge that motivated would-be owners to acquire a “geographical” portable sundial was spread. One likely possibility, at least, is that they learned from the type of encounters in libraries which Matthew Nicholls draws our attention to in Chapter 2 above, as well as from seeing for themselves how others used these enviably intriguing miniature gadgets.50
Even so, we may suspect that practical use hardly mattered to most owners who acquired a geographical portable sundial. Instead, these objects were valued as showpieces that communicated the owners’ (supposed) mastery of scientific principles for computing the time, and—as a glance at the list of geographical names would instantly demonstrate—their pride in a world that Rome dominated in all directions, one through which those who identified themselves as Romans could expect to move freely as far as Britain and Dacia, or Ethiopia and India. It is striking that lack of attention to maps can be inferred from the lists on these sundials. Nonetheless, the lists match the Marble Plan and the Peutinger Map in their basis of detailed geographical data subordinated to communicating Roman worldviews along with Roman values only loosely related to cartography. These worldviews were liable to be impressionistic, variable, and molded by a mix of mental impressions, itineraries, and other lists, as well as some traditional literature, rather than by a set of shared, accurate images comparable to the modern maps we take for granted. Practical communication through maps remained slight in classical antiquity. Our understanding of how contemporaries conceptualized their surroundings remains frustratingly inadequate.
1. For overview, see, for example, OBO s.vv. “Mapping” (2012); “Geography” (2013); and contributions in Talbert (2012).
2. See, for example, contributions in Gallazzi et al. (2012).
3. Grafton et al. (2010), 103; Harley and Woodward (1987), 12.
4. Gautier Dalché (2014); and, more fully, Racine (2009); Johnson (2015).
5. Mattern (1999), 24–80, with reference to Rome; although Gautier Dalché (2015) focuses on the Middle Ages, his approach and his comments on Veg. Mil. 3.6 merit notice.
6. OCD4 s.vv. itineraries, periploi. It is sobering to reflect that itineraries (of variable accuracy) continued to form the basis of many travelers’ maps into the twentieth century: see, for example, the appraisal of the first edition of Richard Kiepert’s Karte von Kleinasien (24 sheets at 1:400,000, Berlin: Reimer, 1901–1907) by Guillaume de Jerphanion (1909), 373.
8. For Eratosthenes, see Roller (2010); for Ptolemy’s Geography, see Berggren and Jones (2000); Stückelberger (2006); (2009); Jones (2012).
9. See, for example, Harley and Woodward (1994), 35–231; Hsu (2010); and for comparison with China, Brodersen (2004), 183–184.
10. Harley and Woodward (1992), 93–101.
11. H. Whigham to P. Cox in 1902, quoted by Hamm (2014), 896; ibid., 886, for a similar complaint in 1904 by Capt. Francis Maunsell, British military attaché in Constantinople.
12. The Royal Geographical Society was hurriedly ordered to produce the index, and it volunteered to begin work on the map at once: Heffernan (1996), 508.
13. O’Connor (2012), 55–58.
14. Publication by the University of Chicago Press to be completed in six (mostly multi-part) volumes: www.geography.wisc.edu/histcart.
15. For consideration of the challenges that had to be overcome in stimulating reassessment of Greek and Roman mapping, note Talbert (2008), 9–15.
16. 9[4].20.2–21.3 Mynors; for commentary, Nixon and Rodgers (1994), 171–177.
17. Points stressed by Jones (2012), 125–127.
20. Especially chaps. 25–33; see Cooley (2009), 36–37, 213–256, for comment.
22. For the “centuriation” of cultivable land into square or rectangular divisions by professional surveyors (agrimensores, gromatici), see OCD4 s.v. “centuriation, gromatici”; OBO s.v. “Land-Surveyors.”
23. West Reynolds (1996); Trimble (2007); (2008).
24. To date, approximately 1,200 fragments can be documented, representing around 12% of the entire Plan: visit formaurbis.stanford.edu.
26. Talbert (2010), Map A.
27. Compare Grant Parker’s characterization of the classical world in Chapter 1.
28. Talbert (2007); (2010), 206–286, Maps E and F.
29. Talbert (2010), 108–117.
30. See, for example, Nicolet (1991), 29–56.
31. Talbert (2010), 142–157.
32. This specific possibility is raised by Barnes (2011b), 378.
33. Cf. Plutarch’s reference (Theseus 1.1) to the habit of filling out the remotest parts of maps with such notices as “Beyond are waterless deserts infested by wild animals,” “Murky bog,” “Scythian cold,” “Frozen sea.” Appian (Roman History, Pref. 7) claims to have witnessed envoys from impoverished, unproductive barbarians begging the emperor—in vain—to bring them under Roman rule.
34. Canepa (2009), 101.
35. Canepa (2009), 102. According to Iranian cosmology, the earth was divided into seven continental sections, of which only the central one (the largest) was originally inhabited by humans.
36. Hannah (2009), 116–144; Houston (2015).
37. Winter (2013), 77–84. Even so, to tell the time by means of such sundials—fixed or portable—remained an inexact exercise. The hours recorded were merely twelve equal divisions of the period of daylight, which varies according to the latitude and the season. At Rome itself, for example, in late December one such “hour” is no more than three-quarters of a modern fixed hour, but in late June it extends to one and a quarter modern fixed hours.
39. Winter (2013), 424–425.
40. Winter (2013), 313–314.
41. Winter (2013), 270–272. In this case and all comparable ones in Tables 17.1 and 17.2, my list starts from the name with the lowest latitude figure.
43. Hoët-van Cauwenberghe (2012).
44. Winter (2013), 610–611.
45. Winter (2013), 537–538.
46. Winter (2013), 612–613.
47. Winter (2013), 604–605.
49. Cf. Racine (2009), 79: “Reading classical poetry closely in school and hearing the grammarian’s commentary on place-names mentioned by poets was for the educated Roman the first lens through which he learned to see the wider world, a lens that would be later supplemented but never completely replaced by direct experience, personal contacts and the flow of news.”
50. The small size of the object surely added to its appeal: owners could feel that they were gaining the chance to hold the Roman Empire, indeed the world, in just one hand. Compare the popularity of European pocket globes in the seventeenth to nineteenth centuries: Sumira (2014), index s.vv. “pocket globes.”