
Early analytical work of archaeological materials began in Renaissance Italy and by the eighteenth century, King George III’s assay master, Mr Alchorn, analysed Irish Bronze Age swords. Martin Klaproth, a famous chemist, published chemical analyses of Roman glass and bronze mirrors (Klaproth 1798). Other eminent scientists, such as Michael Faraday (1791–1867) and Humphrey Davy (1778–1829) were also involved in early analytical work on archaeological materials. Davy chemically analysed ‘Egyptian blue’ and an opaque red vitreous material labelled red enamel. However, even into the early 1970s there was concern over the level of accuracy achieved and that inadequate sampling procedures had been used (Organ 1971). There can be no doubt that those involved in archaeological science research have now addressed these concerns in detail, even though the level achieved and the degree of integration between science and archaeology is apparently unacceptable for some (Dunnell 1993).
Michael Tite’s book, Methods of Physical Examination in Archaeology (1972), provides an excellent description of analytical techniques used in archaeology up to that time; Mark Pollard and Carl Heron’s Archaeological Chemistry (1996), provides a clear and more up-to-date account of analytical techniques used in the investigation of archaeological materials.
This chapter is only concerned with the techniques which are relevant to the rest of the book. Hence, a description of the techniques used in the investigation of organic analysis has been deliberately omitted. The early techniques used for the analysis of archaeological materials involved destruction of the artefact or, at least, the removal of samples.
Since spectrometry forms the basis of most analytical techniques to be described it must first be defined. Spectrometry is a form of measurement in which an exciting radiation (for example X-rays, gamma rays) is directed at a sample (whether in solid or liquid form) and the interaction generates wavelengths of energy which are characteristic of the material. If the exciting radiation is of a sufficient energy, such as X-rays or gamma rays, ionisations characteristic of the atoms of the material will occur, which, in turn, will yield particles characteristic of the material. In the case of X-ray spectrometry the result of bombarding with primary X-rays a sample of lead-rich soda-lime silica glass, for example, is to produce secondary X-rays of sodium, calcium, silicon and lead (among others). As a result of using spectrometry a spectrum of energy of the characteristic particles (each of which has its characteristic energies) is produced. If light or infrared or ultraviolet radiation is used, the interaction results in the absorption of a proportion of the spectrum of the exciting radiation and a reflection of the balance of the wavelengths. Both the absorption and reflection of proportions of the wavelengths are characteristic of the material; with light the characteristic is the observed colour.
One of the first techniques that was used for the analysis of archaeological materials to any extent was arc emission spectrometry (AES). AES was introduced in the 1920s (Ahrens 1954), and continued to be used until c. 1970 (Britton and Richards 1969), when more accurate, automated and less destructive techniques were introduced. AES involved using a powdered sample. A graphite electrode was positioned so that an arc occurred between electrode and sample causing the sample to be volatilised and to emit light. The elements present emitted wavelengths which were recorded on a photographic plate. The relative intensities of each line recorded on the photographic plate was measured and could be related to the relative concentrations in the sample; the results were semi-quantitative (not quantitative), but did, for example, provide a basis for chemically classifying Egyptian glass (Farnsworth and Ritchie 1938). An early investigation of Roman lead-rich glazes using this analytical technique was carried out by the late E.M. Jope (Jope 1950). Some of the earliest work on the sourcing of obsidian was also carried out using AES (Cann and Renfrew 1964; Renfrew, Dixon and Cann 1966). This analytical technique was time-consuming and destructive. As a result, a relatively small number of analyses were carried out on the materials concerned. In spite of this, some excellent results from obsidian analysis were obtained (see Section 6.6 ).
A more advanced wet chemical analytical technique is atomic absorption spectroscopy (AAS). This technique gradually replaced AES, to the extent that by the early 1970s it had almost totally taken its place. The technique involves very similar principles to those of arc emission spectroscopy (AES). However AAS involves the use of a flame to atomise the sample. The sample (of c. 10–20 mg) is dissolved in solution first. The solution is then injected into flames; the kind of gas being burnt depends on the element being analysed. The basis of the technique is that wavelengths of light produced when a particular chemical element is vaporised in the flame are absorbed, and others emitted. It is the absorption of the light wavelengths that is measured. At the same time a hollow cathode lamp shines through the flame onto a slit and a monochromator. The light from the lamp is dispersed into its constituent wavelengths; the wavelength dispersed into the detector depends on the element being analysed. The detector is a photomultiplier which converts light intensity into an electrical signal. The difference between the signal with the lamp alone and with the sample added provides a measure of the concentration of the element present. The older instruments produced a graphical printout as a series of peaks above a background energy level; the energy that was absorbed was displayed as a peak. As with AES, atomic absorption spectrometry records the elements present, each with its own characteristic wavelength, usually one at a time, wavelength by wavelength. The spectrometer is set up so that each element can be measured in turn; a number of sub-samples of the sample solution need to be prepared.
Figure 2.1 An atomic absorption spectrometry system; (a) computer for data processing; (b) flame behind screen; (c) nebuliser; (d) lamp turret. To the left of (d) is the monochromator.
AAS is a quantitative technique. By making up a range of solutions for each element, each containing a different concentration of that element, and analysing each in turn the relationship between peak height above background and the concentration of the element present can be achieved. When a sample with an unknown level of that element is analysed its concentration can be plotted on the calibration curve. Detection levels can be achieved of between about 1 and 100 ppm, though this depends on the element sought, the element absorption line concerned and the conditions of analysis. With the introduction of the graphite furnace, the flame no longer plays a part in AAS: the sample solution is injected into a chamber which is heated in a controlled way. This computer automation has provided a much faster processing time for the analysis. As with all analytical techniques AAS is not always plain sailing. For example, the results can suffer from interference between two or more elements if they occur in the sample together and solutions have to be made up in order to assess the extent to which the quantitative results are effected (Hughes et al. 1976; Hatcher et al. 1995). This has been one of the principal techniques used for the bulk analysis of ancient inorganic materials and has contributed in a significant way. A majority of studies using AAS have focused on the investigation of ancient pottery and metal.
Some fifteen years ago inductively-coupled plasma emission spectroscopy (ICPS) was added to the range of analytical techniques in use. This technique is also destructive and, like AES and AAS involves dissolving the sample. Instead of the flame used in AAS, providing a temperature of c. 2000 °C, ICPS atomises the sample at temperatures above 8000 °C in a plasma torch in which argon can be combusted (Heyworth et al. 1991). The sample is injected into the flame which then breaks up into its constituent parts. Since the temperatures involved are more than double those used in AAS, this should in theory allow for the determination of the constituents at lower levels and reduce the amount of interference between them. The other advantage of the technique, which had originally been used for research in the geological sciences, was its speed. After calibrating the system, the technique allows the operator to analyse twenty elements simultaneously; normally a single computer-controlled detector can perform the analysis of tens of elements while the sample is being aspirated (Thompson and Walsh 1989).
Inductively-coupled plasma mass spectrometry (ICP-MS) offers the opportunity of both chemically analysing samples and at the same time determining the relative concentrations of isotopes present such as the ratios of lead isotopes (as in lead isotope analysis: see Section 5.9.4). A more recent development is the addition of laser ablation to the ICP-MS system. This technique allows us to analyse in quite specific locations on a solid sample. In some ways it is therefore similar to electron microprobe analysis, but it is more sensitive than the latter. A laser beam produces a crater of about 50 μm deep because it vaporises the volume of sample being analysed. One result is that the analysis at that location cannot be repeated (Jarvis et al. 1992). This is a powerful microanalytical technique which is increasingly being used in the analysis of archaeological materials. Mallory-Greenough et al. (1999) have shown that laser ablation microprobe inductively coupled mass spectrometry is more effective at fingerprinting basalts than conventional electron microprobe analysis.
This technique can be used to identify crystalline materials unambiguously, or as an assessment of the degree of crystallinity. Whereas the chemical analysis of a material, if destructive, dissolves the material’s structure, XRD is a way of identifying the crystals present in stone, metals, ceramics, opaque glasses and opaque glazes. The technique involves firing radiation of a particular wavelength (monochromatic) at the crystalline material which is mounted at a specific angle to the incoming energy. The interaction of the radiation with the crystal(s) produces an X-ray pattern characteristic of the structure of the crystal. Crystals are composed of lattices built up in a regular pattern; their size and spacing is characteristic of the crystal species. The technique produces spectra which sometimes include several peaks for a single crystal. Thus, while it is possible to determine the chemical composition of calcium antimonate, for example, it is only with X-ray diffraction that it is possible to distinguish between two forms of calcium antimonate, Ca2Sb2O7 and Ca2Sb2O6. In some cases, different species of crystals are formed at different temperatures, so it is important to determine what species are present in order to determine what temperatures were involved. For example, a-quartz is the normal form of silica which occurs in nature. When it is heated to 573±5 °C it is converted to ß-quartz. At c. 867 °C ß-quartz is converted into another form of silica, tridymite; at 1250 °C cristo-balite is formed. These reactions can be slow, a feature which may be of interest to the archaeological-scientist because it shows that the material was held at the temperature before the transformations occurred. In any case since all three crystal types have the same chemical composition – silica – we can only identify the species involved by using X-ray diffraction.
The instrumentation originally involved a camera which took photographs of the patterns of d-spacings created by using this technique; more recently, fully automated equipment has made it possible to use a thin slurry of the material deposited on a slide. The resulting radiation is measured and the spectra fed electronically into a computer which has a library of crystal d-spacings, making it possible to match the unknown pattern to those stored in the computer. In addition it is possible to carry out quantitative assessments of the relative proportions of different crystal species in the sample by examining the relative intensities of the peak heights; this would need to be carried out on several sub-samples of the material being analysed in order to produce a representative picture. Thin-section petrology is a more effective means of carrying out such quantitative work.
Some of the earliest work on the crystalline nature of Egyptian blue was carried out using X-ray diffraction (Jope and Huse 1942). X-ray diffraction was used to investigate heat-treated chert by Weymouth and Mandeville (1975) in order to examine structural changes and the ways they may cause increased ease of chipping. Purdy and Brooks (1971) had already observed a decrease in tensile strength as a result of heating the chert to a minimum of 400 °C. Weymouth and Mandeville showed that, due to a broadening of the X-ray lines in most cases, the crystalline structure of the chert had changed. Physically this infers that there is a decrease in the distance, on average, over which crystals maintain exact three-dimensional periodicity. This could either be due to a decrease in the size of crystals present, caused by the chert breaking up or developing micro-cracks, or alternatively to an effective spread of inter-atomic distances caused by non-uniform local strain. These individual or summed effects are due to micro-cracks or local strains which break up the crystals. X-ray diffraction can therefore offer a physical reason for the reduced tensile strength and increased ease of chipping of chert heated to between 400 °C and 800 °C.
This technique is applied to samples of pottery and other ceramic materials (crucibles, bricks, stone, slags). It should be borne in mind that it can contribute a part of the full description of fabric analysis which should include the arrangement, size, shape, frequency and composition of the material. Sections of pot are cut off the ceramic, mounted on a glass slide and then polished down to c. 30μm in thickness. The sections are then examined with a petrographic microscope. The fundamental principle behind the technique is that the interaction of polarised light with the thin section of the crystals contained in the material being examined produces characteristic colours. The sample is fixed in a horizontal plane and can be examined by rotating it through 360 degrees. The microscope has a polariser which produces polarised light in a single plane and this passes through the sample. A second polarising filter (the analyser) permits the passage of light vibrating in a plane which is perpendicular to the polariser (‘east-west’ as opposed to ‘north-south’). Images of minerals are formed on the back lens of the objective with convergent illumination. Various optical orientations of minerals in the samples can be examined; petrographic microscopes include other ways of modifying light transmission so that it interacts with the sample in different ways with the aim of aiding identification. An iris diaphragm and a condenser between sample stage and polariser can be adjusted to concentrate the illumination. An auxiliary Amici-Bertrand lens and various accessory plates (quartz wedge, gypsum and mica plates) all help in the identification of the crystal minerals and their orientations: the light patterns produced, often in different colours, are called interference figures. The use of polarised light allows the analyst to identify the anisotropic minerals present. These minerals have physical properties which vary in different directions, as opposed to isotropic minerals which have the same optical properties in all directions. Anisotropic crystals split a beam of light into two beams according to their inherent vibration directions which have different velocities (a ‘fast’ and a ‘slow’ beam). Birefringence is a characteristic seen under the polarising microscope which is caused by this physical property of anisotropic crystals, producing characteristic colours – it is the same effect as can sometimes be seen in car windscreens. The colours observed for the mineral crystals are basically due to the differences between the largest and the smallest refractive indices. The refractive index is a measure of the refraction of light as it passes through the crystal, a ratio of the velocity of light in air to its velocity in the mineral. Those minerals with low birefringence appear pale yellow or grey under crossed nicols, those with slightly higher birefringence appear blue or red and those with still greater birefringence appear to be a ‘high order white’ – an opalescent colour. Of course in plain polarised light, minerals which contain sufficient levels of colorants, such as iron and chromium will appear brown, green, pink or light blue: these colours are caused by pleochrism resulting from the way in which light is altered as it passes through the crystalline lattices (atomic arrangements) of mineral crystals.
When combined with the colour of the crystal which is observed when viewed with ordinary transmitted light, there are two ways of characterising the crystals which both separately and together provide a way of identifying the crystals. Petrology would follow from a simple visual examination of freshly broken sherds; the simplest form of fabric analysis. Although the technique sounds relatively easy, and it is certainly one of the cheaper ways of examining ceramics (Peacock 1977), as with any technique of scientific analysis there are complexities which can only be mastered with practice; a novice might feel s/he has found something new and exciting from the examination of a small number of samples, which experienced workers would classify as ‘normal’. The common rock-forming minerals can be identified fairly easily by an experienced analyst and manuals which list optical properties of minerals (Kerr 1977) provide a means of identifying them. However, Whitbread (1995: 366–7) makes the point that even with such a manual, which might give the impression that the process of identifying minerals and fabrics is objective, several relatively large well-formed examples of minerals in specific orientations are needed. The successful identification of plagioclase feldspar, for example, requires at least twelve examples for which the maximum angle of extinction needs to be determined aligned within narrow angles of orientation. For thin sections of pottery this is not always possible; even the identification of small isolated fragments of rock-forming minerals may present problems. Of course there are many examples of very successful studies of archaeological ceramics using thin-section petrology, so even though there are examples where these problems of subjectivity have clearly been overcome there are inherent philosophical and practical problems of how exactly pottery fabrics are described (Whitbread 1995: 366ff.).
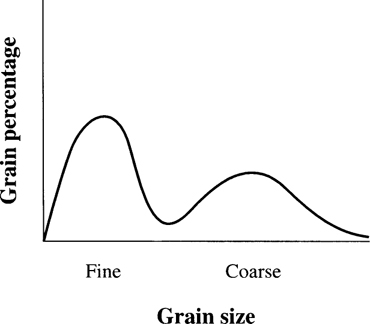
The combination of thin-section petrology and X-ray diffraction spectrometry is a very powerful one: together they provide identifications of the crystals and a means of measuring the distribution of each crystal type through materials. Quantitative petrology is carried out by counting the relative proportion of crystal species in a field of view. Although it has been suggested that the use of such a technique can be an objective and precise way of characterising the microstructure of ceramics (Rice 1987: 309), there are exceptions to this (Whitbread 1995: 367). Where exotic minerals which can characterise ceramics are absent, counting the relative size and occurrence of the ‘grains’ (crystals) in the sample can be an alternative means of characterising the material (see Figure 2.2).
Figure 2.2 Relative grain size versus percentage of grains in a fine and coarse ceramic.
The largest number of projects using thin-section petrology have focused especially on pottery (see, for example, Sections 4.4.3 and 4.5). However, other materials have been examined using the technique. In flint, the identity of micro-organisms can be used to relate the flint sample to its source. Stone, used for polished stone axes, can be sourced geologically and has also been characterised petrologically (see Sections 6.3 and 6.8).
Glascock (1992: 12) has listed the following features of NAA which makes it a technique which potentially has a lot to offer archaeologists: ‘(a) high sensitivity, precision and accuracy for many trace elements; (b) small sample sizes (50–200 mg); (c) relative insensitivity to the major matrix constituents; (d) the fact that it is a fully instrumental technique capable of measuring 30 to 35 elements, simultaneously; and (e) the fact that it is easily adapted to automation.’ Because the technique is a sensitive one and can therefore detect elements at trace levels, some of those detected may not necessarily be attributable to the use of a particular raw material. This is one reason for using multivariate statistics, though explanations other than technological ones should never be ignored (Bishop 1992: 169). In order to carry out NAA it is necessary to have access to an atomic pile. The samples in capsules, which are often in powder form, are irradiated in an atomic pile for a defined period of time. This causes the samples to become radioactive and to decay according to their half-lives. The radiation of the elements with short half-lives obviously decays fastest. The decay is monitored in a special counter, the number of counts being directly related to the concentration of the element in the material being analysed. The longer-lived elements are counted next. The gamma radiation which is produced from the decay of the material is also directly related to the activity of the atomic flux at the time of radiation. It is essential that a standard material is included among the samples being irradiated so that a measure of the reaction to the flux can be made. Normally the standard will be made of a similar material to that being analysed.
As the sample decays, the results will be displayed as a spectrum of wavelength against peak intensity. As with various forms of spectroscopy, it is not always possible to produce ‘clean’ peaks because some peaks interfere with each other. Thus, as with spectrometry, it may be necessary to strip out interfering peaks.
The technique does not have to be destructive, the sample size being determined by the size of the pots into which the artefacts are placed for irradiation. When carried out successfully NAA can provide analyses of materials down to the parts per million level. The technique has been used especially for the analysis of ceramics, where the full range of trace elements detected have been analysed further using multivariate statistics (for example, Evans 1989). Much of the pottery work has been focused on the relationships between chemical characterisation, distribution patterns, the clays, other raw materials used and the location of kiln sites.
Lead occurs as a mixture of primordial lead, which was created when the earth formed and of radiogenic lead which has been produced as a result of the radioactive decay of uranium and thorium. Primordial lead consists of four types, which are labelled according to their different atomic masses: lead-204, lead-206, lead-207 and lead-208. Lead-204 is the only type which has not been formed as a result of radioactive decay and a constant amount of it remains in the earth’s crust. The other forms of lead (isotopes) are continuously being added to via a decay chain by the radioactive decay of uranium-238, uranium-235 and thorium-232. As with carbon-14 dating, which relies on a comparison of the relative amounts of stable isotopes of carbon with the amount of radioactive carbon-14 in a sample, the principle of lead isotope determination also relies on the relative amounts of stable and radiogenic lead to characterise the lead-containing deposit.
Since lead occurs in a range of ancient materials, lead isotope analysis can be used in a range of archaeological and technological contexts. It can be applied to a range of materials, such as lead, silver, copper alloys, copper, pigments, glass, glazes and bones.
Lead can either occur as part of an ore mineral body such as galena (see Section 5.2), or at much lower levels in other minerals. One important assumption of the process of lead isotope analysis is that, even if the lead may be present at varying concentrations in an ore body, as long as it has been formed under the same conditions and undergone the same geological processes, the ratios between the lead isotopes present will be the same (Gulson 1986). Another important characteristic of lead is that it does not fractionate (i.e. it does not separate into its isotopes). This means that if an ore contains both lead and copper, the lead isotope ratios in one metal will also be represented in the other (Pernicka 1992). As Rohl and Needham (1998: 4) point out, if a lead-containing ore body has ‘undergone a post-depositional geochemical process (e.g. remobilisation) [it] may not be very well mixed and this heterogeneity can produce a large range of lead isotope ratios, even within a single mineral type’. Since the aim of lead isotope analysis is to characterise the metal by the ratios of the lead isotopes present, this effect would clearly produce problems which would also be present in artefacts made using that lead source. Another possible complicating factor is that deposits of lead ore with very different formation times, leading to different lead isotope ratios, may be laid down very closely together. Those conducting field surveys should therefore have a detailed understanding of the geological history of the deposits being sampled. Pernicka (1993) has also noted that some ore bodies, such as copper deposits, containing low lead concentrations, can contain a range of lead isotope compositions. In this case the spread of lead isotope ratios is due to the uranium present continuing to decay after the copper ore has been formed. Although discussions of the validity of the interpretations of lead isotope analysis applied to archaeology have been extensive and lively, there is one principle that most research groups involved agree on: that twenty samples from an ore deposit is sufficient to characterise it (Reedy and Reedy 1992; Sayre et al. 1992; Gale and Stos-Gale 1992).
Where lead isotope analysis has been applied to metal objects a major consideration may be that the lead isotope signature will be altered in some way by the heat-treatment of the metal, and indeed as a result of corroding while buried in the ground. However, as mentioned above, lead does not fractionate – this applies generally both under high-temperature conditions and as a result of corrosion. Budd et al. (1995) have discussed possible fractionation during metal-smelting when large losses of lead can occur due to non-equilibrium evaporation. Subsequent research appears to show that the low vapour pressures of lead and lead oxide during bronze casting lead to very low losses.
The same principles of lead isotope determinations can be applied to the occurrence of lead isotopes in the full range of materials in which they occur. However, some of these materials, such as metal and glass, can be mixed as part of recycling or as a result of deliberately alloying two (or more) metals which may contain lead from more than one origin (e.g. alloying lead with bronze). Both of these processes will mix the characteristic lead isotope ratios of the lead sources involved, potentially making it impossible to disentangle the isotopic signatures.
The principles of X-ray fluorescence spectrometry (XRF) form the basis for microanalysis in the context of electron probe microanalysis and spectrometers attached to scanning electron microscopes. The principles of XRF will therefore be described first.
X-ray fluorescence analysis can be a totally nondestructive technique. It is a surface technique of spectroscopic analysis which relies on the interaction of primary X-rays with the sample generating, among other particles, a range of secondary X-rays which have energies characteristic of each of the elements in the sample (Jenkins 1974; 1988). It produces a spectrum of energies in the same way that AES does. The primary energy source can be a radioactive material which will generate gamma rays; when fired at the sample in a solid geometry the interaction of the gamma rays with the sample will generate secondary X-rays. A much more common source of X-rays is an X-ray tube which, when configured within a commercially produced system, will be located in a stable position allowing the same analytical geometry to be repeated each time (the same analytical geometry is important if quantitative analysis is attempted).
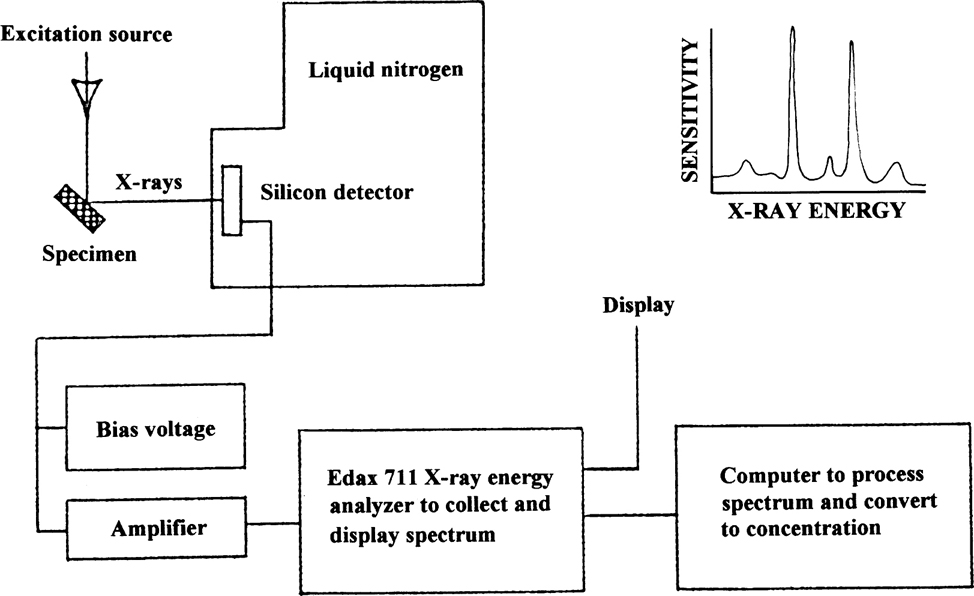
The primary X-rays interact with each of the elements in the sample surface. During this process, secondary X-rays are emitted at the take-off angle, escaping from the sample at the same angle at which the primary X-rays were fired at the sample. A variety of energy transitions occur between inner atomic electron shells in each atom of the elements, and these lead to the generation of the secondary X-rays. The secondary X-rays hit a detector (typically silicon drifted with lithium) with an analogue-to-digital converter attached to it, which converts the pulses of discrete secondary X-ray energies into electrical pulses at the different energies which are determined by the atomic weight of the element concerned (see Figure 2.3 for a diagrammatic arrangement of a typical energy-dispersive XRF system). The electron pulses are then fed into a multi-channel analyser which displays the maxima in the spectrum of X-ray energies as a series of peaks above the background. The peaks are a gaussian shape because the process by which the peaks are formed is one dependent on counting probability whereby the maximum number of events which fall at the exact centre of the peak produce the maximum peak height. The ‘tails’ of the peak are due to a smaller number of events at energies above and below the peak centroid.
Figure 2.3 Diagrammatic representation of an X-ray fluorescence system.
The depth to which the primary X-rays penetrate the sample is mainly dependent on the energy of the primary X-rays, the angle at which the X-rays are fired at the sample and the matrix composition of the sample. For a material which contains a relatively high proportion of heavy elements, such as lead, with an atomic number of 82, secondary X-rays which derive from it for a relatively light element also in the material, such as potassium, will be derived from a shallower maximum depth than a material which on average has a lighter matrix. The greatest depth from which elemental X-rays are derived is therefore an important consideration because it partly determines the sensitivity of each element to X-rays and therefore the number of X-ray photons that are detected per unit time. If the count rate is low, the length of the count time in order to produce acceptable counting statistics needs to be increased.
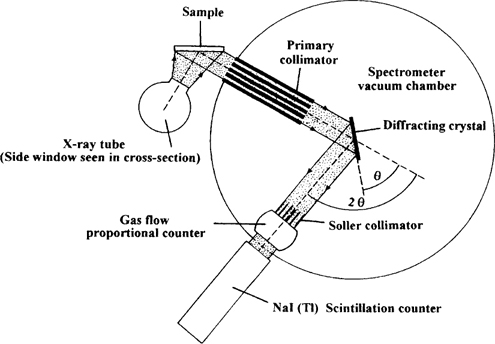
There are two principal types of X-ray fluorescence: energy-dispersive and wavelength-dispersive spectrometry (Potts et al. 1985). Energy-dispersive spectrometry operates by collecting data from the detector, separating it according to its energy and displaying it in spectral form. Wavelength-dispersive spectrometry, on the other hand, relies on a different means of operation. In this case the spectrometer relies on the presence of crystals causing a secondary X-ray to be diffracted at a particular angle, according to its atomic number, the secondary X-ray being detected electronically. The dispersion of the secondary X-ray is greater than with energy-dispersive X-ray spectrometry which makes it possible to separate the X-ray peaks more completely and, in general, also makes it possible to detect elements at lower levels (see Figure 2.4). Wavelength-dispersive spectrometry is normally slower simply because the spectrometer angle needs to be changed, and also, from time to time, the crystals in the spectrometer, depending on what elements are sought.
Figure 2.4 A diagrammatic representation of a wavelengh-dispersive (WD) spectrometer as found in WD-XRF. The same spectrometer is used in electron microprobe, although electrons are the exciting energy instead of X-rays.
Typically wavelength-dispersive X-ray spectrometry is used to analyse material that has been powdered and made into a silicon borate glass bead. The bead is cast so that its lower surface is flat and of the appropriate diameter for the beam of primary X-rays used for its analysis. Energy-dispersive spectrometry, on the other hand, can more readily be used as a totally non-destructive technique and is therefore more appropriate to a museum environment. However, if the sample has an irregular surface and/or is weathered/depleted in any way it is impossible to produce a quantitative result. The obvious use for energy-dispersive analysis in a museum is to provide an initial identification of a material, though it must never be forgotten that the technique only provides an analysis of the surface. The depth to which the exciting energy (X-ray or gamma ray) penetrates the sample is dependent on, in the case of an X-ray tube, the voltage used and also the matrix composition of the material: for a ‘light’ matrix the depth from which the heaviest secondary X-ray may escape is c. 40 microns, for the analysis of materials with ‘heavy’ matrices the maximum depth is more typically c. 15 microns.
The successful quantification of the results from XRF depends on a number of factors. An ideal sample is one which is polished flat and compositionally homogeneous. The factors which effect the analysis include X-ray tube voltage, the composition of the anode which is used in the X-ray tube, the geometry of the analytical system, the use of a collimator, the roughness of the sample surface, the extent of interference between elements on the X-ray spectrum, whether the X-ray emission peaks are successfully deconvoluted and the composition of the sample being analysed (a greater absorption of light elements, such as sodium or magnesia occurs in a matrix which consists of a heavier average Z [atomic number], such as one rich in lead, than in one which has a lighter average Z). In addition, the use of a reliable set of standards of known composition is absolutely essential, as it is for almost any analytical technique. Obtaining a reliable set of standards can be difficult and is one way of checking the quality of the analyses. Finally, the kind of quantification program employed can affect the results. In the case of XRF, the use of fundamental parameters or influence coefficients techniques can have an important impact on the results produced.
A micro-destructive technique which produces high quality results is electron microprobe. This followed on from the milliprobe (Hall et al. 1973) and its early use in analysis (Brill and Moll 1963), becoming commonly used especially for research in mineral sciences in the 1970s (Reed 1996). As the technique suggests micro-samples as small as 0.5 mm can be mounted and analysed. The technique involves the use of a micro-beam of electrons which are focused on the sample surface using electrostatic lenses. The electrons themselves are generated using an electron gun (in Figure 2.4 the electron gun is vertical on the left-hand side of the machine). The interaction of the electrons with the sample generates secondary X-rays which are characteristic of the chemical elements in the material. This technique provides an analysis of a shallower layer of material than XRF (3–5 microns compared to c. 30–50 microns), but by sampling and preparing the sample carefully the quality of the results when compared to open geometry energy-dispersive X-ray analysis are far higher. The samples are normally embedded in epoxy resin and polished flat so that the geometry of the analysis is repeated exactly each time. In the process of doing this any weathered material can be removed.
The electron beam can be focused or defocused depending on the intended area of analysis; it may also be essential to defocus the beam in order to minimise or eradicate the possibility of volatilising the sample surface, causing elements like sodium to be boiled off (Potts et al. 1985; Henderson 1988). In practice, the minimum diameter of a focused electron beam during the analysis of a metal or a ceramic is 1 micron on the sample surface, which spreads out in the metal itself to c. 2 microns; for glass the beam needs to be deliberately defocused to c. 80 microns.
The electron probe was introduced in c. 1975 primarily as a tool used by geologists. As a result some of the early machines used were ideal for the analysis of silicates, especially for the chemical analysis of individual crystals in ceramic materials. Apart from being micro-destructive, one of the other advantages of the technique is that it is possible to locate the electron beam precisely on the area of the sample to be analysed with the use of a microscope attached to the system; if compositional heterogeneity is suspected, an energy-dispersive detector attached to the system can be used to carry out qualitative point analyses before the quantitative analyses are performed. A scanner attached to the machine can also provide image of the sample. It would be possible to quantify the energy-dispersive results from the system but the levels of precision and detection achieved with the probe are of a far higher quality (Dunham and Wilkinson 1978; Henderson 1988; Veritá et al. 1994). This is also true when the results from an energy-dispersive spectrometer attached to a scanning electron microscope and those from a wavelength-dispersive system in an electron microprobe are compared.
This technique is a quantitative one and, given the small beam size, it is normal to analyse 3 to 5 spots of a homogeneous material like glass, and average the results. Before chemical analysis is attempted the system must be calibrated with the use of standards for the major elements being analysed, in order to reproduce the matrix conditions of differential absorption of secondary X-rays. Geological standards may be used for pure elements occurring at minor or trace levels in the sample. As with any analytical technique, the cross-analysis of a multielement standard which was not used in calibrating the system and of proven reliability at the start and end of the analysis, will provide two things: the determination of relative analytical accuracy and a means of monitoring any drift in the system.
As mentioned above scanning electron microscopy (SEM) can be used for microanalysis, and it is possible to attach both energy-dispersive and wavelength-dispersive spectrometers to the instrument. However, the quality of the analyses will not be as high as for a dedicated electron microprobe because in the context of SEM it is not possible to reproduce the same analytical geometry as for a microprobe. Indeed the systems should not be confused – they are different and should be referred to as electron microprobe and analytical SEM respectively.
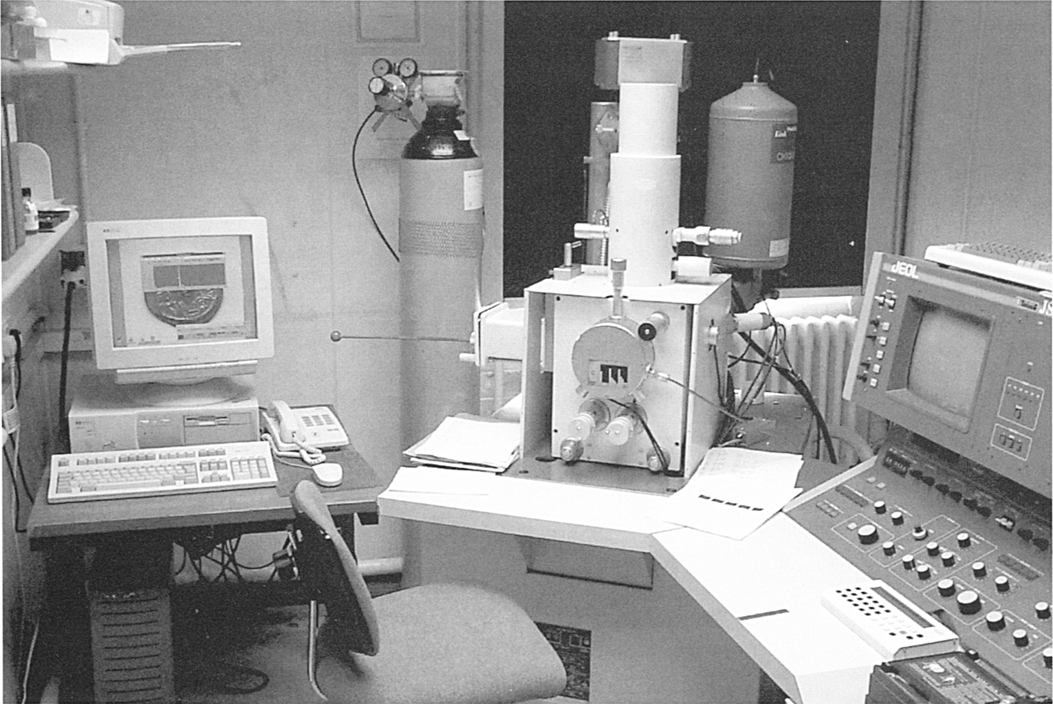
SEM is primarily used for imaging structurally or compositionally heterogeneous materials (Tite et al. 1982). The systems are often fitted with an energy-dispersive spectrometer, a secondary electron detector and a back-scattered electron detector (see Figure 2.5). The secondary electron detector provides images of the surface texture of materials whereas the use of a back-scattered detector mainly provides images of variations in composition.
Figure 2.5 A Jeol JSM 845 scanning electron microscope with an energy-dispersive spectrometer.
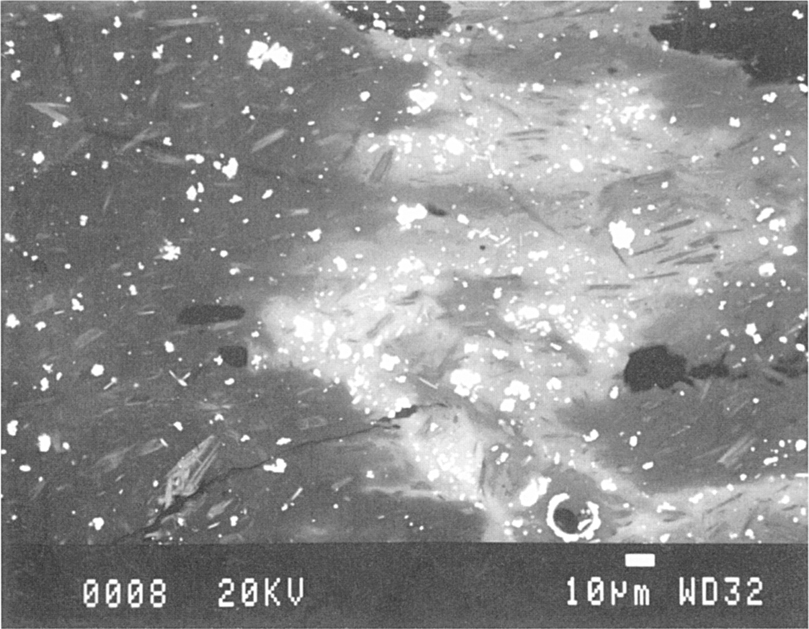
The source of energy for SEM is an electron gun. Instead of the electrons being focused at a point, as in the electron microprobe, they are focused on a particular plane. They are also scanned across the material using scanning coils to build up an image of their interaction with the material. Because back-scattered electrons travel in almost straight lines and the detector is located to one side of a specimen, a shadowing effect is produced. A secondary electron image is dependent on the angle between the beam and the specimen surface (see Figure 2.6). Differences in grey level are, as a result, a reflection of the angle of the surface to the detector: the roughness of the surface and the shape of the sample can be seen clearly on the surface of the glass in Figure 2.6, including characteristic conchoidal fractures. Back-scattered electron images, on the other hand, provide pictures of compositional heterogeneity by recording the number of back-scattered electrons from the sample, giving a measure of the relative average atomic number in the area being analysed (see Figure 2.7). The secondary electron images therefore provide highly magnified images of the surface textures of materials, whereas back-scattered electron images are built up from variations in composition (Reed 1996: 77). The two techniques can also be used in conjunction with each other: if a small area of decoration has been applied to a metal surface which is of a different composition from the body of the artefact, SEM will provide evidence for both the way in which the decoration has been attached and also how the materials used are different.
Figure 2.6 A secondary electron micrograph of the surface of a Bronze Age glass bead (fourteenth century BC) from Wilsford in Wiltshire, UK (× 1000).
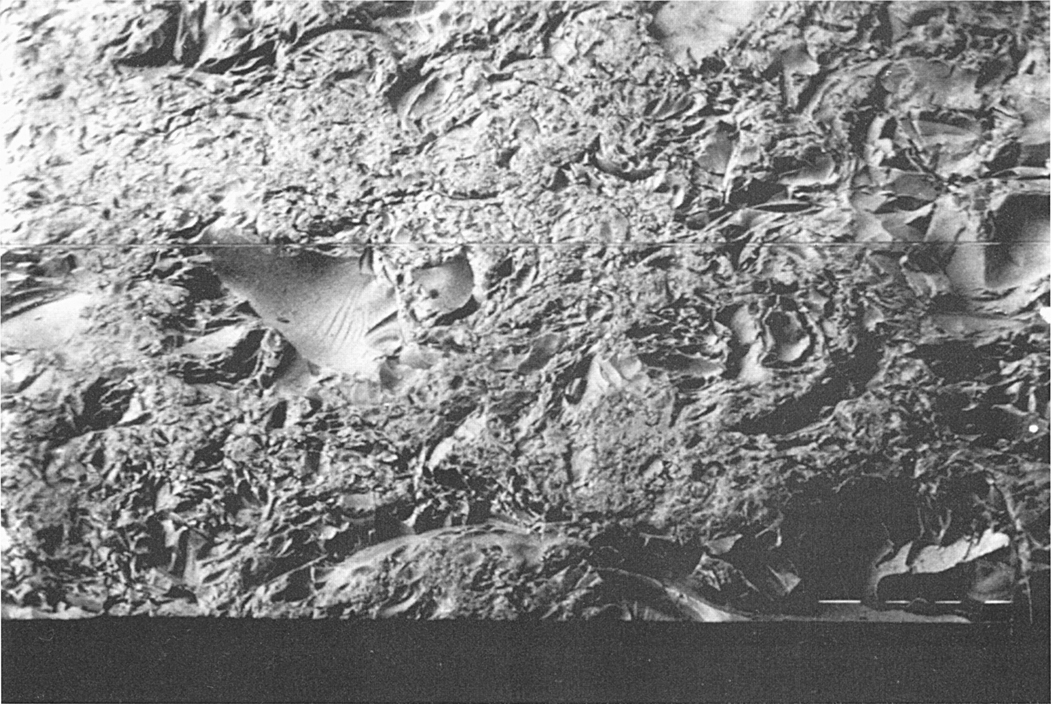
Figure 2.7 A back-scattered electron micrograph of a sample of early Christian (sixth–tenth century) opaque green glass showing white lead-tin oxide crystals in a cloud of (pale grey) high lead glass (on the right). The darker areas of the sample contain lower lead oxide levels and both areas contain elongated pale grey soda-lime-silica crystals.
Whereas with an electron microprobe an initial examination of a thin section of a pottery sample can provide an unambiguous identification of the crystal which can then be pinpointed and analysed chemically, an electronmicrograph can provide clear images of how a particular compositional family of crystals (e.g. alkaline feldspars) might vary in composition and texture within the same sample or between samples from different sources. In a review paper, Freestone and Middleton (1987) have discussed the role of the analytical SEM specifically for the analysis of minerals in archaeological ceramics. In addition, of course, an SEM can be used to show great compositional contrasts between crystals and the matrix material they are sitting in, between layered materials and between depleted/corroded surfaces and the parent material. By examining cross-sections through materials it is possible to relate structural corrosion to changes in chemical composition which can, in turn, be recorded photographically.
For successful imaging using a back-scattered detector it is appropriate to use a sample that has been mounted and polished flat in the same way the sample was prepared using the electron microprobe. This procedure is of course inappropriate if the sample is being examined for its surface texture, in which case it should be carefully attached to a stub within the SEM and can be rotated to examine different areas of interest.
In order to examine materials like metals which conduct electrons, the sample can be attached to the stub within the system. If the material is glass, glaze or obsidian (for example) and does not conduct electrons, then it needs to be coated in order to prevent distortion and deflection of the electron beam; this is also true for electron microprobe analysis. The sample size that can be examined under SEM is determined by the size of the sample chamber. Since samples are examined under vacuum, open geometry (as with XRF spectrometry) is not possible. A range of SEM systems are manufactured and relatively large objects can be accommodated, of up to c. 5 cm × 3 cm in dimension.
The features that characterise PIXE are the cost and size of the instrument. The analytical technique requires a tandem van der Graaf accelerator in order to generate particles which are accelerated at high speeds towards the sample where they collide and penetrate the sample, still at great speeds. A particle accelerator can cost up to £500,000. The sample can be the same size and prepared in the same way as for SEM and EPMA. It should be presented to the beam in a fixed geometry. The system can be operated in both an open geometry and by using a sample chamber, so the sample size can, theoretically, be infinite. With an open geometry system it is also possible to analyse materials containing light elements by placing the sample in a bath of helium in order to prevent the light secondary X-rays produced from being absorbed in the air before being detected (Jaksic et al. 1992).
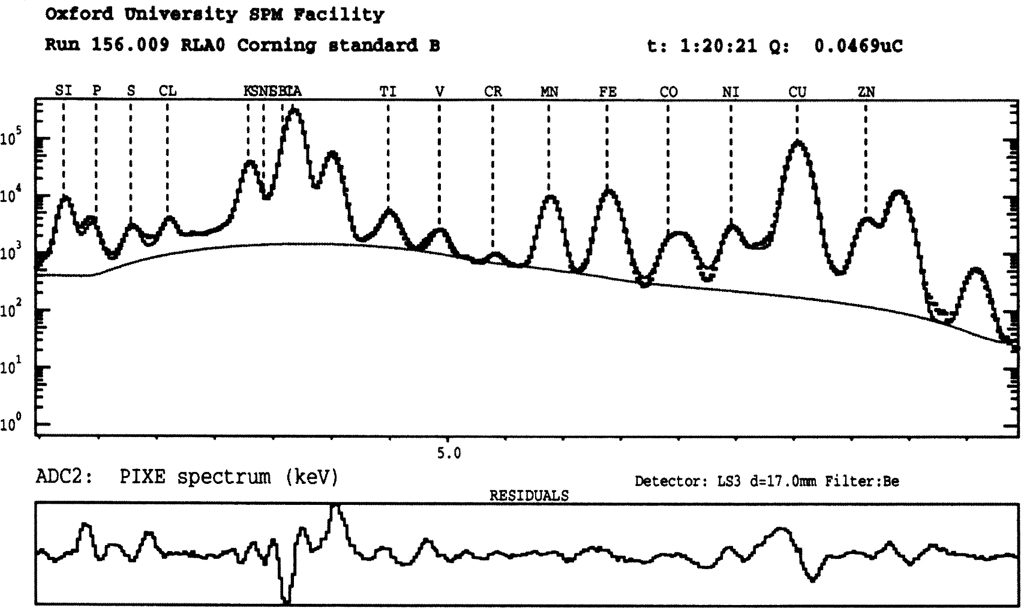
Analytically, the most significant difference from EPMA is that the backgrounds produced by PIXE are a factor of 10 lower (see Figure 2.8). This is because the particles bombarding the sample enter it at such a great speed that less scattering of the particles occurs than when electrons or X-rays are used as the primary exciting energy. The net result is that the background of the X-ray spectrum is significantly lower, allowing far lower concentration of components to be detected. Some PIXE systems are fitted with scanning coils so that the distribution of elements on the surface of the material can be mapped, including at very low concentrations. The same detector system and multi-channel analyser is often used as with EPMA and SEM systems: a lithium-drifted silicon detector for energy-dispersive fluorescence.
Figure 2.8 An example of the X-ray spectrum of the Corning B glass standard produced using a scanning proton microprobe. A variety of X-ray peaks are labelled: silicon, phosphorus, sulphur, chlorine, potassium, calcium, titanium, vanadium, chromium, manganese, iron, cobalt, nickel, copper zinc; all are Kα peaks.
The depth of analysis during PIXE is of the same order as with stand-alone ED-XRF analysis, and, as with XRF, is dependent on the system’s voltage, in the case of PIXE typically 1.5 MeV or 2 MeV. The depth of penetration by the analysing beam can be up to 50 microns in a material with a light matrix and only c. 15 microns in a heavy matrix. If the substance being analysed contains crystals which are 10 microns below the surface there is no way, at present, of separating the contribution made by the crystal to the analysis from that made by the matrix of the material: this is where SEM and EPMA systems are more appropriate analytical techniques in the analysis of crystalline materials.
In addition to being able to detect elements at very low concentrations, by using PIXE it is also possible to map elemental distributions through the thickness of a sample by analysing its surface. This technique is known as Rutherford back-scattering and relies on back-scattering of the protons from crystallites or other particles within the sample being analysed.
Ahrens, L.H. (1954) Quantitative Spectrochemical Analysis of Silicates, London: Pergamon Press.
Bishop, R.L. (1992) ‘Comments on Section II: Variation’, in H. Neff (ed.), Chemical Characterization of Ceramic Pastes in Archaeology, Monographs in World Archaeology No. 7, Madison: Prehistory Press, pp. 167–170.
Brill, R.H. and Moll, S. (1963) ‘The electron-beam probe microanalysis of ancient glass’, in Recent Advances in Conservation, Rome: International Institute of Conservation, pp. 147–149.
Britton, D. and Richards, E.E. (1969) ‘Optical emission spectroscopy and the study of metallurgy in the European bronze age’, in D. Brothwell and E. Higgs (eds) Science in Archaeology, London: Thames and Hudson, pp. 603–613.
Budd, P., Pollard, A.M., Scaife, B. and Thomas, R.G. (1995) ‘The possible fractionation of lead isotopes in ancient metallurgical processes’, Archaeometry 37: 143–150.
Cann, J.R. and Renfrew, C. (1964) ‘The characterization of obsidian and its application to the Mediterranean region’, Proceedings of the Prehistoric Society 30: 111–133.
Dunham, A.C. and Wilkinson, F.C.F. (1978) ‘Accuracy, precision and detection limits of energy-dispersive electron microprobe analyses of silicates’, X-ray Spectrometry, 7: 50–56.
Dunnell, R.C. (1993) ‘Comments and Reviews’, Archaeomaterials 7, 1: 161–165.
Evans, J. (1989) ‘Neutron activation analysis and Romano-British pottery studies’, Chapter 6 in J. Henderson (ed.), Scientific Analysis in Archaeology, and its Interpretation, Oxford: Oxford University Committee for Archaeology, Monograph No. 19 and UCLA Institute of Archaeology, Archaeological Research Tools 5.
Farnsworth, M. and Ritchie, P.D. (1938) ‘Spectrographic studies on ancient glass. Egyptian glass mainly of the 18th Dynasty, with special reference to its cobalt content’, Technical Studies in the Field of the Fine Arts 6, 3: 155–173.
Freestone, I.C. and Middleton, A.P. (1987) ‘Mineralogical applications of the analytical SEM in archaeology’, Mineralogical Magazine 51: 21–31.
Gale, N.H. and Stos-Gale, Z.A. (1992) ‘Lead isotope studies in the Aegean (The British Academy Project)’, in A.M. Pollard (ed.), New Developments in Archaeological Science, Proceedings of the British Academy 77, Oxford: Oxford University Press, pp. 63–108.
Glascock, M.D. (1992) ‘Characterizaton of Archaeological Ceramics at MURR by Neutron Activation Analysis and Multivariate Statistics’ in H. Neff (ed.), Chemical Characterization of Ceramic Pastes in Archaeology, Monographs in World Archaeology No. 7, Madison: Prehistory Press, pp. 11–26.
Gulson, B.L. (1986) Lead Isotopes in Mineral Exploration, Amsterdam: Elsevier.
Hall, E.T, Schweitzer, F. and Toller, P.A. (1973) ‘X-ray fluorescence analysis of museum objects: a new instrument’, Archaeometry 15: 53–78.
Hatcher, H., Tite, M.S. and Walsh, J.N. (1995) ‘A comparison of inductively-coupled plasma emission spectrometry and atomic absorption spectrometry analysis on standard reference silicate materials and ceramics’, Archaeometry 37: 83–94.
Henderson, J. (1988) ‘Electron probe microanalyses of mixed-alkali glasses’, Archaeometry 30 (1): 77–91.
Heyworth, M.P., Hunter, J.R, Warren, S.E. and Walsh, J.N. (1991) ‘ICPS and glass: the multi-element approach’, in M.J. Hughes, M.R Cowell and D.R Hook (eds), Neutron Activation and Plasma Emission Spectrometric Analyses in Archaeology. Techniques and Applications, British Museum Occasional Paper 82, London: British Museum Press, pp. 143–154.
Hughes, M.J., Cowell, M.R. and Craddock, P.T. (1976) ‘Atomic absorption techniques in archaeology’, Archaeometry 18: 19–37.
Jaksic, M., Grime, G., Watt, F. and Henderson, J. (1992) ‘Quantitative PIXE analysis using a scanning proton probe’, Nuclear Instruments and Methods in Physics Research B54: 491–498.
Jarvis, K.E., Gray, A.L. and Houk, R.S. (1992) Handbook of Inductively Coupled Plasma Mass Spectrometry, Glasgow: Blackie.
Jenkins, R. (1974) An introduction to X-ray Spectrometry, Chichester: John Wiley.
Jenkins, R. (1988) X-ray fluorescence spectrometry, Chichester: Wiley-Interscience.
Jope, E.M. (1950) ‘Roman lead-glazed pottery in Britain’ The Archaeological Newsletter 2: 199.
Jope, E.M. and Huse, G. (1942) ‘Examination of “Egyptian blue” by X-ray powder Photography’, Nature 146: 26.
Kerr, P.F. (1977) Optical Mineralogy, 4th edn, New York: McGraw-Hill.
Klaproth, M.H. (1798) Memoires de l’academie royale des sciences et belle-lettres, Berlin. Classe de philosophie experimentale.
Mallory-Greenough, L.M., Greenough, J.D., Dobosi, G. and Owen, J.V. (1999) ‘Fingerprinting ancient Egyptian quarries: preliminary results using laser ablation microprobe inductively coupled plasma-mass spectrometry’, Archaeometry 41, 2: 227–238.
Organ, R.M. (1971) ‘The value of analyses of archaeological objects’, Archaeometry 13, 1: 27–28.
Peacock, D.P.S. (1977) ‘Ceramics in Roman and Medieval Archaeology’, in D.P.S. Peacock (ed.), Pottery and Early Commerce: Characterisation and Trade in Roman and Later Ceramics, London: Academic Press, pp. 147–162.
Pernicka, E. (1992) ‘Evaluating lead isotope data: comments on Sayre et al. “Statistical evaluation of the presently accumulated lead isotope data from Anatolia and surrounding regions”: III’, Archaeometry 34, 2: 322–326.
Pernicka, E. (1993) ‘Evaluating lead isotope data: Further observations – Comments III’, Archaeometry 35, 2: 259–262.
Pollard, A.M. and Heron, C. (1996) Archaeological Chemistry, Cambridge: The Royal Society of Chemistry.
Potts, P.J., Webb, P.C. and Watson, J.S. (1985) ‘Energy-dispersive X-ray fluorescence analysis of silicate rocks: comparisons with wavelength-dispersive performance’, Analyst 110: 507–513.
Purdy, B.A. and Brooks, H.K. (1971) ‘Thermal alteration of silica minerals: an archaeological approach’ Science 173: 322–325.
Reed, S.J.B. (1996) Electron Microprobe Analysis and Scanning Electron Microscopy in Geology, Cambridge: Cambridge University Press.
Reedy, T.J. and Reedy, C.L. (1992) ‘Evaluating lead isotope data: comments on Sayre et al. “Statistical evaluation of the presently accumulated lead isotope data from Anatolia and surrounding regions”: IV’, Archaeometry 34, 2: 327–329.
Renfrew, C., Dixon, J.E. and Cann, J.R. (1966) ‘Obsidian and early cultural context in the Near East’, Proceedings of the Prehistoric Society 32: 30–72.
Rice, P.M. (1987) Pottery Analysis: A Source Book, Chicago: The University of Chicago Press.
Rohl, B. and Needham, S. (1998) The circulation of metal in the British Bronze Age: the application of lead isotope analysis, British Museum Occasional Paper, number 102, London: The British Museum.
Sayre, E.V., Yener, K.A., Joel, E.C. and Barnes, I.L. (1992) ‘Statistical evaluation of the presently accumulated lead isotope data from Anatolia and surrounding regions’, Archaeometry 34, 1: 73–105.
Thompson, M. and Walsh, J.N. (1989) A Handbook of ICP Spectrometry, Glasgow: Blackie.
Tite, M.S. (1972) Methods of Physical Examination in Archaeology, London: Seminar Press.
Tite, M.S., Freestone, I.C., Meeks, N.D. and Bimson, M. (1982) ‘The use of scanning-electron microscopy in the technological examination of ancient ceramics’, in J.S. Olin and A.D. Franklin (eds), Archaeological Ceramics, Washington, DC: Smithsonian Institution Press, pp. 109–120.
Veritá, M., Basso, R., Wypyski, M.T. and Koestler, R.J. (1994) ‘X-ray microanalysis of ancient glassy materials: a comparative study of wavelength-dispersive and energy-dispersive techniques’ Archaeometry 36: 241–252.
Weymouth, J.W. and Mandeville, M. (1975) ‘An X-ray diffraction study of heat-treated chert and its archaeological implications’, Archaeometry 17, 1: 61–68.
Whitbread, I.K. (1995) Greek Transport Amphorae: A Petrological and Archaeological Study, Fitch Laboratory Occasional Paper 4, Athens: The British School at Athens.