
Figure 8.1.Service sector workers in an office. Photo by Monkey Business Images. Stock photo ID: 656511280. Shutterstock.com.
Chapter 8
Services
After agriculture and manufacturing, the third major component of economic geography is the tertiary, or service, sector. In all likelihood, you and your classmates will not be working on a farm or in a factory. Rather, you will be working in an office, store, school, hospital, or some other location where you are paid not to produce tangible goods such as apples or cell phones but to provide intangible goods (figure 8.1). The intangible goods produced by the service sector are wide ranging. They include wholesale and retail services, such as selling cars, food, electronics, and furniture. They also include transportation and warehousing services that employ workers such as truck drivers, stocking clerks, package delivery personnel, and airline pilots. Utility workers are employed in the service sector as well, providing the generation and transmission of power as well as water and sewer services. Information production is another large component of this sector and includes film and recording industries, internet publishing, data processing, and telecommunications. In finance, stockbrokers, insurance agents, and realtors are part of the service sector. Education and health care are two massive parts of the service sector, as are the arts and tourism.
As in other sectors of the economy, service providers search for the most profitable location. Companies need places with good site characteristics and access to the right types of land, labor, and capital. Government regulations, infrastructure, and agglomeration also influence the desirability of sites. Situation, or the relative location of service providers to other places, rarely depends on proximity to raw material inputs, but proximity to customers can play an important role. However, with digital technology, the service sector is now global, creating a spatial distribution where some companies rely on workers on one side of the world to provide services to customers on the other. Globalization has led to clusters in some places. Finance, entertainment, tourism, information technology (IT), arts, and more congregate in certain cities, driving economic growth in those cities. At a local scale, spatial patterns are also driven by site and situation characteristics. Banking and insurance may cluster in one part of a city, warehousing and transportation in another. Retail establishments also locate in areas on the basis of neighborhood demographics and the presence of competitors.
Figure 8.1.Service sector workers in an office. Photo by Monkey Business Images. Stock photo ID: 656511280. Shutterstock.com.
While the future of most workers lies with the service sector, it is important to note the challenges that this brings. First of all, wages in the tertiary sector vary substantially. Whereas agricultural and manufacturing work tends to have a narrower range of wages, services range from the very low to the very high. Many fast-food and home-health-care workers earn near minimum wage, while surgeons and corporate executives can earn annual incomes in the hundreds of thousands of dollars or more.
At the same time, outsourcing and offshoring of work to temporary contract and foreign employers threaten the wages and job security of many service workers. The so called gig-economy means that many service workers lack regular paychecks and the health and retirement benefits that often accompany them. Likewise, many companies have found that workers in poorer countries can perform service jobs at a fraction of the cost of workers in higher-income places. Everything from lower-skilled customer service call centers to higher-end IT jobs have been sent offshore, providing new opportunities for residents of developing countries but threatening prospects for workers in developed ones.
Finally, automation, as in agriculture and manufacturing, threatens many service jobs. The proportion of people working as bank tellers and secretaries has declined with the diffusion of the automatic teller machine and office computers. The composition of service jobs will continue to change as self-driving vehicles and warehouse-stocking robots replace many transportation and wholesale positions. Even higher-skilled jobs are being threatened. Machines that can analyze x-ray and magnetic resonance images may replace radiologists, while investment advice and data analytics are being done with artificial intelligence.
These changes can lead to social conflict and present economic and political challenges that are increasingly difficult to ignore. Retraining displaced service workers and ensuring adequate wages will take on greater political significance. As in all sectors of the economy, technological change and globalization offer great benefits but also significant challenges.
Types of services
The US Bureau of Labor Statistics breaks service-providing industries into seven supersectors, which are further divided into more detailed sectors (table 8.1). Sectors are then broken down into even more detailed industries. In essence, the service industries include all businesses outside of manufacturing, construction, and natural resources and mining.
The service industry is often broken up into two broad categories: producer services and consumer services. Producer services, also known as business-to-business services, are those that sell to businesses and the government. This sector of the economy has seen steady growth as more companies focus on their core competencies and outsource other functions to subcontractors whose nature is to sell services to other businesses. In contrast, consumer services sell directly to consumers. Table 8.2 shows that producer and consumer services are often found within the same service sectors. The difference is not in what service is being provided but rather who the customer is.

Table 8.1.Service supersectors and selected sectors. Data source: US Bureau of Labor Statistics.

Table 8.2.Producer vs. consumer services. Table by author.
Services can also be divided into tradable and nontradable industries. Tradable services can be consumed in a place other than where they are produced. A corporate lawyer in London can provide services for a client in Mexico City, and a computer programmer in Mexico City can provide a service for a software company in London. In both cases, where the work is performed and where the work is consumed are different. In contrast, nontradable services are those that must be consumed in the same place they are produced. Even if they offer a better service for a better price, a barber in New York cannot cut the hair of a customer in Los Angles, and a plumber in Poland cannot fix the pipes of a customer in Chicago.
Spatial distribution of services
Global distributions
Services and development
Whereas agricultural strength conveyed power to ancient societies, as did industrial might to countries of the eighteenth through twentieth centuries, all affluent and powerful countries now draw their economic strength from services. In fact, of the rich countries identified as developed by the United Nations, the service sector dominates GDP production in all of them. In the United States, France, and the United Kingdom, nearly 80 percent of GDP came from services in 2015. Germany and Japan, two countries with sizable manufacturing sectors, still earned around 70 percent of GDP from services. At a broader scale, high-income countries earned about 75 percent of GDP from services, while low- and middle-income countries earned less than 60 percent, and the least developed countries earned under 50 percent of GDP from services. Figure 8.2 shows how developed Europe and North America rely heavily on the service sector, developing Latin American is somewhat mixed, and less-developed Africa has a weaker service sector.
Richer and more developed countries earn more from services because of high levels of automation and productivity. When people have higher levels of education and skills, and when machinery helps perform many tasks, more goods can be produced with fewer workers. Providing food, clothing, and other material necessities no longer requires a large segment of the working population, so people are freed up to work in other areas. Time and energy can be devoted to everything from potentially life-saving research in cancer treatments to less-essential yet enjoyable services such as developing social media apps, dog walking, and personal training.
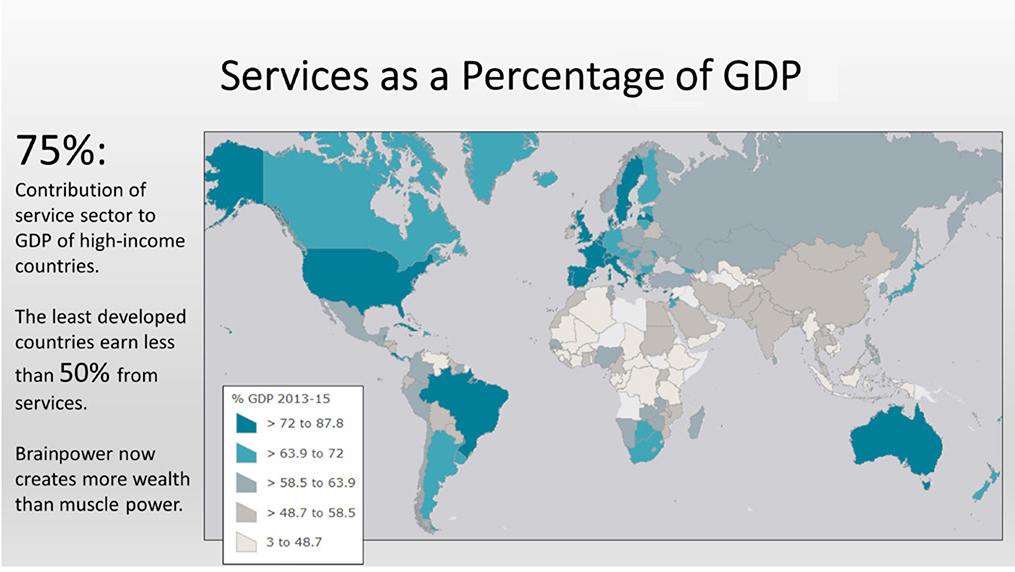
Figure 8.2.Services as percentage of GDP, 2013−15. Explore this map at https://arcg.is/OiS9f. Data source: World Bank.
In developing countries, such as many in Africa and parts of Latin American and Asia, large segments of the population still work in low-productivity subsistence agriculture. Nevertheless, some improvements in productivity, especially among capital-intensive commercial agriculture producers, now mean that more people are leaving the agricultural sector. Manufacturing has not absorbed many of these workers, given the problems discussed in chapter 7, leaving most to find some type of work in the service sector. However, the service jobs they take on are not higher-skilled positions in business services and technology. Rather, they are in low-skilled consumer services. These can include motorcycle taxi drivers, small shopkeepers, street vendors, house cleaners, and sellers of prepaid cell-phone minutes. Most of these jobs are in the informal sector, with inconsistent incomes and no benefits (figure 8.3). So, while maps of service employment in developing countries may show some growth in that sector, it is important to remember that the shift does not always represent movement toward well-paid jobs in new sectors of the economy.

Figure 8.3.Small shop in Cape Town, South Africa. In less-developed countries, many service workers are in low-productivity jobs, such as at small retail establishments in the informal economy. Photo by Daniel S Edwards. Stock photo ID: 235537198. Shutterstock.com.
Figure 8.4 shows the proportion of GDP from services for selected countries that have data from the 1960s to the present. France, the richest and most developed of this group, earns a much higher proportion of GDP from services. France still produces agricultural and industrial goods, but over time, automation on farms and in factories has allowed the French to devote their time to other pursuits. This has allowed the service sector to grow and contribute a greater share to the French economy. Mexico’s service sector has grown somewhat, but a greater transformation since the 1960s has been a shift from agriculture to manufacturing via the maquiladora industry. South Korea’s service sector has grown substantially. Manufacturing is still an important component of its economy, but new sectors have grown as well, including entertainment such as K-pop (figure 8.5). Kenya and India sill remain largely agricultural. In the case of Kenya, tourism services are important, although they have declined in recent years with fears of terrorism from nearby Somalia. India has seen rapid growth in its service sector, especially in back-office works such as call centers and data processing as well as information technology.
Services, cities, and the world economy
Some cities have a disproportionate influence in global services. By studying the location of corporate headquarters and the revenue earned, certain places stand out on the map as leaders in areas such as finance, consumer goods, information technology, and more. Even when a corporation’s primary function is manufacturing, corporate headquarters provide the services that oversee it, such as management, accounting, marketing, and research.
The reason for this concentration of services lies again in the benefits of agglomeration. As similar services cluster in one place, the strength of the whole becomes greater than any single part. The most skilled and talented workers will be attracted by ample employment prospects. Also, despite ease of communication brought about by the internet, physical proximity leads to casual conversations at coffee shops, bars, and on the street, which contribute to new ideas as well as career tips. Specialized subcontractors are also drawn to the agglomeration, offering services outside of a corporation’s core competencies. These can include human resources functions, IT network maintenance, payroll, wellness, and other services that help corporate headquarters run smoothly.

Figure 8.4.Services as a percentage of GDP over time, selected countries. Data source: World Bank.

Figure 8.5.K-pop group Blush. Korea now exports a wide range of services, such as music, which is consumed around the world. Photo by Randy Miramontez. Stock photo ID: 96074576.
Figure 8.6 shows cities by revenue generated in different economic sectors in 2012. The financial capital of the world is New York, followed by Paris, London, and Tokyo (figure 8.7). These cities are where many financial institutions have their headquarters and earn vast amounts of revenue. Large banks such as JPMorgan Chase, Goldman Sachs, HSBC Holdings, BNP Paribas, Mitsubishi UFJ Financial, and many more are found in these cities. In these cities, flows of investment capital are managed, corporate merger and acquisitions deals are done, and lending to companies and individuals is overseen. From this handful of urban nodes, major economic decisions are made that impact people around the world.

Figure 8.6.Dominant cities: Consumer goods, information technology, and finance. Explore this map at https://arcg.is/1aurPy. Data source: The data was produced by G. Csomós and constitutes Data Set 26 of the Globalization and World Cities (GaWC) Research Network (http://www.lboro.ac.uk/gawc) publication of inter-city data.
Consumer staple goods are also concentrated in a handful of powerful cities. These include large corporate food markets and providers of household and personal products. London tops the list in terms of revenue, followed by Paris, Tokyo, and New York. Food companies such as Tesco (groceries and general merchandise) and Carrefour (similar to Costco in the US) have their headquarters in London and Paris respectively. Colgate-Palmolive from New York oversees a massive market of personal hygiene and cleaning products. Beauty products come from L’Oréal in Paris and Estee Lauder in New York. Thus, many of the types of food, personal care, and beauty products are developed and marketed from a few influential cities.

Figure 8.7.Office workers in the financial district of Tokyo, Japan. Many corporate headquarters locate in Tokyo, making it a major center of global services, including consumer staples, finance, information technology, and more. Photo by Kobby Dagan. Stock photo ID: 365261141. Shutterstock.com.
Information technology, both software and hardware, also concentrates in a handful of places. Not surprisingly, Silicon Valley’s San Jose tops the list in terms of both revenue and number of headquarters. In and around San Jose are well-known companies such as Alphabet Inc. (Google), Facebook, and Adobe Systems (figure 8.8). Samsung, LG, and others are based in the Seoul, South Korea, region, and the New York metropolitan area has IBM and other IT companies. These cities shape a large part of our daily lives, providing tools for work and entertainment that many people use on a near-constant basis.

Figure 8.8.Alphabet (Google) office in Mountain View, California. Photo by Pozdeyev Vitaly. Stock photo ID: 383777227. Shutterstock.com.
Services and offshoring
In a global economy, companies search for the most profitable location for production. This holds true for the service sector just as it does for manufacturing and agriculture. While rail, roads, and shipping containers facilitate global trade in agricultural and manufactured goods, advances in communication technology have facilitated the global service industry. As communications have evolved from letters to the telegraph to the phone to the internet, many service companies have been able to take site and situation factors into account in their location decisions, the most important of these being labor. Today, with nearly instant communication between places, skill sets, language, wages, and government labor laws play a big role in where service providers locate.
The globalization of services only functions in the tradable sector, however. After all, you cannot offshore day care for your children to a babysitter in India. But many jobs can be completed remotely for customers by workers who earn lower wages than in the US and other developed countries.
One of the most well-known occupations that has seen significant spatial shifts is customer-service call centers. India—a place where British colonialism created a large English-speaking population—initially led the revolution in call-center offshoring. However, many Americans complained about the difficulty of understanding Indian accents, so by 2011, most offshored call centers for US-based companies had been relocated to the Philippines. More recently, some call-center jobs are being re-shored back to the United States. As labor costs rise in developing countries and as customers demand clear communication, without misunderstandings from cultural differences and English-language idioms, some companies are deciding that it makes better economic sense to use workers in the United States.
The IT sector has also seen shifts in its global distribution. The nature of information technology is that digital data can be nearly instantly moved from place to place. In theory, this makes it among the most footloose of industries. India, Eastern Europe, and other lower-cost countries have benefitted from the offshoring of IT work, such as computer programming, network maintenance, and research and development. Major US companies, including Disney, Verizon, and the University of California, San Francisco, have moved or considered moving IT jobs abroad to reduce costs. Yet this shift is not one way. Ironically, Infosys, an Indian outsourcing company, is also moving jobs to the United States. While one attraction of India as an IT outsourcing destination is its large number of engineering graduates, Infosys found that only 5 percent of them could write code correctly.
So, the geography of IT services continues to fluctuate. Some companies are now outsourcing not to foreign countries but to other cities and states within the United States. With exorbitant housing prices in tech centers such as Silicon Valley, where six-figure starting salaries are the only way to attract employees, some technology firms have found that workers in, say, Michigan, can do the same high-quality work but for lower wages than a worker in the San Francisco Bay Area. Other changes in IT employment are spurring some companies to bring workers back into the corporate office. It turns out that much IT work is best performed when people are physically in the same location as coworkers and customers. New ideas and solutions often come out of serendipitous conversations in offices and around the water cooler, which cannot happen as easily when workers are isolated in remote workplaces. In recent years, large technology firms such as Yahoo! and IBM have called workers back to the office from telecommuting.
Thus, the global distribution of service employment faces some of the same issues as manufacturing. Sites with lower wages appeal to companies in search of lowering costs, yet once worker skill sets and product quality are taken into account, it often makes sense to locate closer to customers.
Local distributions
Zooming in to a larger scale, we can look at the spatial pattern of services and how they order themselves on the landscape regionally and within cities. Many of these patterns you may have noticed already. For instance, if you live in a smaller town, you probably know that you have to drive into the big city for a pop concert or (if you win the lottery) to buy an Armani suit or handbag. Likewise, you may be fine seeing a local doctor in town if you have the flu, but if she finds something more serious, you may have to see a specialist in an urban regional medical center.
Another pattern you may have noticed is that similar types of stores seem to cluster in the same location. Clothing retailers, even those with very similar lines, are typically in the same part of town, as are restaurants and other commercial services. Given that they compete with each other, this seems like an unlikely arraignment, yet clustering with competitors is much more common than dispersed relationships.
Clearly, the spatial distribution of services is not random. Some types of services are found in smaller towns, and others are located only in larger cities. Likewise, stores and other services are not evenly spread around town but are clustered in specific places.
Central place theory
To understand why services differ between small towns and big cities, we return to Christaller’s central place theory, first described in chapter 5. Central place theory is based on the idea of market areas, which are determined by the concepts of threshold and range (figure 8.9). Each type of business has a threshold, or minimum number of customers needed to support it. A small convenience store has a small threshold, being able to make a profit from a relatively small number of customers in a local neighborhood. A high-end Armani store will not survive exclusively with customers from the nearby community. Since few people can afford Armani products, and those who can do not purchase them on a regular basis, it must draw from a much larger population. For this reason, it has a larger threshold. Market areas are also determined by range, or the distance people are willing to travel to purchase goods or services. People will generally travel only a short distance to purchase a soda from a convenience store, but they will travel a greater distance to purchase an Armani bag or suit.

Figure 8.9.Market area according to central place theory. Image by author.
Businesses that have large market areas, with large threshold requirements and large ranges, must cluster in high-order urban areas. A large city and its surrounding urban areas will have a sufficient customer base to support specialized services. Smaller urban areas will have businesses with smaller market areas, as a limited population size supports only businesses with small threshold requirements.
Thus, low-order small towns have businesses with very small market area requirements. These can include convenience stores, gas stations, auto repair shops, hair salons, and other small businesses. Medium-order cities that are somewhat bigger can have primary care physicians, maybe a car dealership, larger grocery stores, and midlevel clothing stores. Large, high-order cities have the most specialized businesses, such as exotic car dealers, specialist health-care facilities, high-end clothing stores, and major league sports teams.
Figure 8.10 shows cancer specialty hospitals in the southwestern United States, which require highly specialized medical staff and equipment. Because of the level of specialization and cost involved in this type of medical care, these hospitals have very large thresholds. Thankfully, cancer is less common than ailments such as the flu, so a large population is required to support this type of facility. At the same time, cancer is a very serious disease, meaning that people are willing to travel greater distances to get treatment. For this reason, these facilities also have a large range. It is evident that specialty hospitals are located primarily in larger urban counties and metropolitan areas. Smaller (micropolitan) urban areas and rural regions, because of their small populations, have very few facilities of this type.

Figure 8.10.High-order service: Cancer specialty hospitals. Data sources: ArcGIS Business Analyst; US Census.
Figure 8.11 emphasizes the significance of large urban areas in hosting highly specialized services such as cancer hospitals. The densely populated Los Angeles−Long Beach−Santa Ana statistical area, defined by the US Census Bureau, has sixty-nine such hospitals, serving a population of nearly thirteen million people. Assuming there is a rough balance between the supply of cancer hospitals and the demand by cancer patients, then each of the sixty-nine hospitals operates with a threshold of about 188,000 people (13 million/ 69 = ~188,000).
Convenience stores, unlike specialty hospitals, have lower costs and are used more frequently by the nearby population (figure 8.12), so they are much more scattered throughout small, medium, and large cities. The city of Madera, California, population just over 60,000, does not have any specialty hospitals. However, as would be expected, it does have convenience stores. Thirteen of these establishments (not including combination gas stations and convenience stores) serve an average of less than 5,000 people each.
Hotelling’s location model
While the central place theory helps explain where different types of services locate—specialized high-order services in larger cities and generic low-order services in smaller towns as well as larger ones—it does not explain where the same types of services locate. Often, when you and friends plan to meet for food or drinks, you pick a section of town where there are multiple restaurants. Likewise, when you go shopping, there is typically a neighborhood with multiple clothing stores. Auto dealers also frequently cluster in several blocks. On the surface, this seems illogical in that nearby businesses must compete with one another for business. But in 1929, Harold Hotelling, a mathematical statistician and economic theorist, came up with a theory that shows that the natural result of competition will draw businesses together in the same location.

Figure 8.11.High-order service in large urban areas. Data source: ArcGIS Business Analyst.

Figure 8.12.Low-order service in small urban areas. Data source: ArcGIS Business Analyst.
A common way of explaining how this works is to consider two ice cream vendors on a beach (figure 8.13). If each vendor locates at the far end of the beach, they split the customer base evenly (A). Half of the beachgoers will be closest to one vendor, and half will be closest to the other. But what happens when one vendor shifts toward the center to capture a larger segment of the beach? (B) This action forces the other vendor to move as well, so as to regain market share (C). Ultimately, each of the two vendors will move until they reach a new equilibrium that gives them each one-half of the market and where no move will allow for a larger share. The only location that allows for this is with both vendors adjacent to each other in the middle of the beach (D). While it is not the best location for customers on the far ends of the beach, it is the best location for the two vendors, who want to maximize their market share.
Hotelling’s line of thought is similar to the bid-rent model introduced in chapter 5. Recall that in that model, the highest rents are found at the center of the city. This is because the center is the point of highest accessibility, and thus the highest demand by businesses, in the city. When a business is located in the center of a city, customers can access it from 360 degrees. Any location other than the center will be farther from customers on the far side of the center. Just as in Hotelling’s linear location model, businesses will cluster as a natural result of competition.
Figure 8.14 illustrates clusters of wholesale flower, wholesale toy, and wholesale jewelry stores in downtown Los Angeles. Dozens of similar businesses locate within blocks of each other, forcing intense competition. Yet, a clustered location benefits them in that buyers come from all over the Los Angeles metropolitan area, knowing that there will always be an ample supply of the items they are looking for (figure 8.15). If an individual store locates in a less central location, it risks losing the volume of customers that are attracted to the cluster by good accessibility and variety of options.

Figure 8.13.Hotelling’s location model. Image by author.

Figure 8.14.Service clusters. Data source: ArcGIS Business Analyst.

Figure 8.15.Downtown Los Angeles flower district. This area contains dozens of flower sellers with similar products. Agglomeration benefits outweigh the downside of being in the same area as competitors. Photo by author.
Other location factors
Of course, there are other factors that complicate the simplified models of Christaller and Hotelling. Local zoning laws, discussed in chapter 5, can mandate that services cluster in specific parts of the city. You cannot convert a house to a liquor store or fast-food restaurant in the middle of a residential neighborhood, even if you feel it is the best location. Rather, most cities designate specific places where specific businesses are allowed. Some zones can allow for restaurants, while others may allow only offices.
Government incentives can also influence the location decisions of service providers. Tax breaks to locate car dealerships in a smaller city just outside the city limits of a larger one can lead to a cluster. Similar incentives at the local level can attract businesses to an enterprise zone, such as when a city wants to revitalize a run-down commercial district.
The demographic characteristics of communities also influence where services locate. High-end, full-service restaurants; designer clothing stores; and financial planners will locate in higher-income communities, while fast-food, discount clothing, and payday loan services will concentrate in lower-income areas. Ethnicity can influence the types of services present, so Latino immigrant communities may have medicinal herb shops and quinceanera dress stores that are less common in other communities. Lifestyle, as represented by Esri’s Tapestry Segmentation, has a significant influence as well. For instance, the Urban Chic segment adjacent to Vanderbilt University in Nashville, Tennessee, will likely attract organic food establishments, art galleries, yoga studios, and outdoor recreation suppliers (figure 8.16).
Population movement can also influence the location of services. Pedestrian and vehicle traffic flows vary substantially from place to place. A business in a busy downtown district can benefit from thousands of people walking by each day. The same is true for a business along a major highway thoroughfare that benefits from vehicle traffic. Population flows by time of day can also be significant. Many business districts have large daytime populations (figure 8.17) but few people after work hours. Services such as lunch-oriented restaurants and package carrier services will likely be attracted to these places. On the other hand, some districts attract a nighttime crowd. An area with movie theaters can attract restaurants and bars that benefit from the evening moviegoing crowd.

Figure 8.16.Tapestry segmentation: Services for urban chic. Explore this map at https://arcg.is/eeuKj. Data sources: Nashville-Davidson Metro Government, Esri, HERE, Garmin, Intermap, USGS, NGA, EPA, USDA, NPS, US Census Bureau, Infogroup.
Go to ArcGIS Online to complete exercise 8.1: “Central place theory: Where can I buy a Ferrari?” and exercise 8.2: “Consumer services site selection: Where should I put my store?”
Services and clusters in the United States
In many cities of the United States, the service economy is a key basic industry. Services such as finance, entertainment, tourism, technology, and others cluster in certain cities, bringing money into local economies, directly employing many workers and supporting employment for many more through the multiplier effect. Because of the importance of services in driving local economies, many cities use subsidies, marketing campaigns, urban redevelopment, and other policies to attract companies and workers.

Figure 8.17.Population flows and service location. Explore this map at https://arcg.is/0HTTTG. Data sources: Esri, HERE, Garmin, NGA, USGS, NPS.
Business and financial operations occupations
Some cities have been successful at creating agglomerations of high-skilled and well-paying services. New York and Chicago are world-renowned centers of finance, with large numbers of jobs in various types of banking and investment services (figure 8.18). These two areas stand out in figure 8.19, which shows cities with at least 10,000 workers in business and financial operations. This category also includes a wide range of occupations such as human resources, management, accounting, and marketing. Large urban areas such as Los Angeles also stand out, as do the largest cities in many states. Jobs in this sector tend to require higher levels of education and pay above-average wages. In 2016, the median wages in business and financial operations were 40 percent higher than the overall US median wage. These well-paying industries fuel economic activity in other sectors of the local economy and attract workers from other places, both near and far. This increases the economic strength of large urban areas and continues to drive rural-to-urban migration. As large cities attract high-skill, high-pay jobs, the differing levels of opportunity between rural and urban America are only exacerbated.
Several cities in Texas also have a substantial number of jobs in the business and financial operations sector. While corporate location decisions involve many factors, government incentives can help play a role. In 2014, Toyota Motors decided to relocate its corporate headquarters from Southern California to the Dallas, Texas, area. The state of Texas offered $40 million in incentives, equivalent to about $10,000 per employee, to attract the company. Similarly, it offered financial incentives to attract Chevron jobs to Houston and Apple jobs to Austin. Because of the high wages paid to workers in business and financial operations, many state and local governments argue that incentives are a worthwhile investment to attract corporate jobs. Over the long term, governments expect to benefit from increased tax revenue and economic development through the multiplier effect.

Figure 8.18.Trading floor of the Chicago Mercantile Exchange, Chicago, Illinois. Chicago has a significant cluster of high-paying finance jobs. Photo by Joseph Sohm. Stock photo ID: 258345956.

Figure 8.19.Business and financial operations employment. Explore this map at https://arcg.is/1nm14T. Data source: US Census.
Computer and mathematical occupations
The role that services play in local economies can also be viewed in terms of the location quotient, first introduced in chapter 4. Figure 8.20 shows places where computer and mathematical occupations are overrepresented as compared to the US average. Naturally, Silicon Valley in California stands out. But there are also many other urban areas with substantial tech sectors. The Seattle area is home to Microsoft and Amazon. The Washington, DC, area has numerous defense- and government-related technology companies. Austin, Texas, is a growing tech hub, and Huntsville, Alabama, has many facilities for NASA’s space program (figure 8.21). As with the business and finance sector, these occupations require high levels of education and pay good wages. As of 2016, wages were fully 70 percent higher than the US median, making tech hubs some of the most affluent and thriving places in the United States.

Figure 8.20.Computer and mathematical employment. Location quotient. Explore this map at https://arcg.is/1nm14T. Data source: US Census.
Arts, design, entertainment, sports, and media occupations
Another service sector that provides above-average wages and can be an important source of economic development is the arts, design, entertainment, sports, and media sector. Again, larger urban areas have the most jobs in this sector, which include actors, writers and editors, professional athletes, musicians, and broadcasters. Wages are 25 percent above the US median and require high levels of education or skills. Of course, Los Angeles stands out in figure 8.22, with its large film and entertainment sectors. New York has a media cluster, a thriving arts scene, its famous Broadway theater district, major publishing houses, and much more (figure 8.23). Smaller cities also stand out, such as Nashville, Tennessee, with its influential music scene.

Figure 8.21.Davidson Center for Space Exploration in Huntsville, Alabama. A cluster of computer and math employment linked to NASA is located here. Photo by Rob Hainer. Stock photo ID: 105385199.
Looking at the film industry alone, nearly 200,000 people are directly employed in California, and close to 100,000 are employed in New York. Maybe surprisingly, Georgia ranks third, with over 25,000 industry workers. Television programs such as The Walking Dead and The Vampire Diaries have been filmed there, as have major motion picture such as the Hunger Games series. Georgia has actively pursued the film industry, promoting its tax incentives for production, a business-friendly regulatory environment, and free location scouting. Its effort has paid off, so that an industry agglomeration in cities such as Atlanta now offers benefits to further film production. Because of the agglomeration effect, there are now experienced film crews; studios; and firms that specialize in editing, animation, lighting, wardrobe, and all other tasks essential for film production.

Figure 8.22.Arts, design, entertainment, sports, and media occupations employment. Explore this map at https://arcg.is/1nm14T. Data source: US Census.

Figure 8.23.Theaters in Times Square, New York City. Photo by Jiawangkun. Stock photo ID: 534020845. Shutterstock.com.
Food preparation and serving related occupations
While many services jobs are high-skill and high-wage positions, driving economic development and the formation of middle-class jobs, other service occupations are just the opposite. In the case of food preparation and service jobs, skill levels tend to be lower, as are median wages. Overall, workers in this sector earn 44 percent less than the US median wage. Even chefs and head cooks, the highest paid in this category, earn 26 percent less than the US median. These examples show the challenges of service sector-oriented economies. Increasingly, there is a polarization of incomes, with some services workers earning substantial wages while others earn barely enough to live on.
Figure 8.24 shows the location quotient by county for food preparation and serving-related occupations. When a high proportion of workers in a county are employed in restaurants and bars, overall wages tend to be low. In some cases, these counties have economies focused on tourism. Las Vegas stands out, as do counties to its east that cater to Grand Canyon tourism. Likewise, Mariposa County in California has a disproportionate number of restaurant employees that serve tourists to Yosemite National Park. Much of South Florida as well as coastal communities along the Atlantic coast also have tourism-oriented economies with a large proportion of restaurant employees.
But in other cases, restaurant employment may be among the only options for work not because of tourism but because the local economy is stagnant and few other employment options exist. In these counties, the only options for work may be the local diner or fast-food restaurant.
Sales and related occupations
Another service sector that employs a large number of people is sales and related occupations. This category has median wages 11 percent below the national average but with a great deal of variation. Higher-end sales, such as in financial services and manufactured goods, often requires higher levels of education and pays above-average wages. But this category also includes retail positions, employing hundreds of thousands of lower-skilled and lower-paid workers in the US. In urban areas, there is likely a mix of both high- and low-end sales employment. Higher-educated workers sell items such as pharmaceuticals, software, machinery, and other sophisticated products, while lower-educated workers work in retail establishments.

Figure 8.24.Food preparation and serving: Location quotient. Explore this map at https://arcg.is/1nm14T. Data source: US Census.
Problems arise in smaller rural places. As with restaurant work, in some places one of the few employment options is the local grocery store or discount retailer. Figure 8.25 shows some overlap with restaurant employment, such as in South Florida and along the Atlantic coast, where souvenir shops complement restaurants in serving tourists.
Creative class clusters
When discussing the spatial distribution of services, geographers typically look at the decisions made by firms. So far, we have seen how site and situation characteristics, such as the presence of ports and highway infrastructure, wage and skill levels, and proximity to resources and consumers, can influence where companies locate. We have also looked at the role of the government, including zoning laws and tax incentives. Such factors guide where companies invest, ultimately determining the quantity and quality of jobs and economic growth in different places. Some places have more high-paying jobs in business, finance, and the arts, while others have more low-paying jobs in restaurants and retail sales.
Geographer Richard Florida, in contrast, flips this line of thought, focusing on how people choose places to live and work and how firms often follow. His work focuses on a group of people with the skills and education that drive the most important economic and cultural innovations in the United States. By his argument, it is the places where these people choose to live that have become the most economically vibrant centers of activity in the country, with high-paying work, innovative companies, and a high quality of life.
Florida refers to this group of people as the creative class. These are people who create new products and ideas and find solutions to pressing problems in science, government, business, the arts, and many other areas. The creative class includes occupations such as scientists, engineers, university professors, artists, actors, designers, writers, legal and health-care professionals, financiers, and managers. These workers make up a specialized subset of the service sector. They are the most educated or skilled, and their work adds great value to the places where they cluster.

Figure 8.25.Sales and related employment: Location quotient. Explore this map at https://arcg.is/1nm14T. Data source: US Census.
While most traditional location theory focuses on people following their economic interests, moving to places with the best job opportunities, Florida argues that the creative class is attracted to places for both economic and lifestyle reasons. Specifically, they are attracted to places with the 3Ts: technology, talent, and tolerance. Technology can be found in and around universities and where some large technology firms have located. Many of these places also have talent, or a large proportion of people with at least a bachelor’s degree. The third characteristic, tolerance—openness; inclusiveness; and diversity of races, ethnicities, and lifestyles—exists to a greater degree in some cities than in others.
Places must have all three of these characteristics to attract the creative class. Some places have one or two of these characteristics, but the places that truly thrive from the creative class have all three. For example, Baltimore, St. Louis, and Pittsburgh all have technology, with important universities, yet have been unable to attract the creative class due to a lack of cultural openness. Miami and New Orleans have tolerance of different lifestyles, yet lack technology.
Examples of cities with all three of these characteristics include major urban areas such as Washington, DC, Raleigh-Durham, Boston, Austin, Seattle, and the San Francisco Bay Area. Smaller cities such as East Lansing, Michigan, and Madison, Wisconsin, can also meet the criteria. As creative class workers cluster in these places, more creative and technological companies are created and attracted, leading to powerful economic growth.
Cities with technology, talent, and tolerance tend to have microlevel urban characteristics that attract the creative class. Specifically, the creative class is drawn to places with a more organic street-level culture. Unlike the culture in formal urban cultural districts, such as those with a symphony hall or museums, street-level culture thrives in multiuse urban neighborhoods. Venues are small, with coffee shops, bars, and restaurants; small art galleries; and bookstores. People walk, intermingling with other residents of the city as they go about their daily lives in the neighborhood (figures 8.26 and 8.27). These types of communities reflect the urban revitalization, and in some cases gentrification, of cities that was discussed in chapter 5.
As the creative class clusters in attractive and economically thriving cities, there is now increasing concern about inequality. Innovation by the creative class has led to economic growth and correspondingly high wages for its members in places like San Francisco, Seattle, and New York, among other cities. Housing costs have skyrocketed, forcing those who are not members of the creative class to seek housing elsewhere. Some people see thriving creative-class cities as becoming playgrounds for the wealthy, with exciting street life and ample economic opportunity that only a segment of the population can enjoy. In fact, there appears to be little overlap between where the creative class lives and where the working class live. Each is increasingly living in cities and/or neighborhoods completely segregated by occupation and income.

Figure 8.26.People at music festival, Austin, Texas. The creative class is attracted to places with lively arts and entertainment scenes. Photo by PiercarloAbate. Stock photo ID: 612826124. Shutterstock.com.

Figure 8.27.Coffee shop in Portland, Oregon. The creative class also chooses to live in places with active neighborhoods full of coffee shops, restaurants, and bars. Photo by Joshua Rainey Photography. Stock photo ID: 391904392. Shutterstock.com.
Go to ArcGIS Online to complete exercise 8.3: “Service employment growth: What should I study and where can I find a job?”
Service employment: Growth, decline, and wages
As we have seen thus far, the service sector dominates developed countries such as the United States, but within this sector is a wide range in terms of wages. Restaurant and retail sales workers face low wages and limited opportunities for advancement, while those in business and finance, computer and math, and arts and media occupations enjoy higher wages and ample room for professional development. The subsegment of professionals that are in the creative class enjoy even more opportunity for good wages, professional growth, and exciting lives in culturally diverse urban areas.
Given the difference within the service sector, what are the trends moving forward? What types of careers should a young person be preparing for? The US Bureau of Labor Statistics provides projections through the year 2024. The trend toward service occupations will continue, with 81 percent of Americans working in that sector by 2024. Within the service sector, the largest single-industry sector will be health care and social assistance, followed by professional and business services, then state and local government. Topping out the top five sectors will be retail trade and leisure and hospitality.
Looking at specific occupations, several stand out as having especially high growth rates. Of the fastest-growing occupations, some offer above-median wages, while others are much lower paying. The single fastest-growing occupation is projected to be for wind turbine service technicians, which pays wages substantially above the median (figure 8.28). Following that are occupational therapy assistants and physical therapy assistants, who also earn above-average wages. However, the next two fastest-growing occupations, physical therapist aides and home health aides, earn wages well below the median. Given the nature of this book, it is also worth noting that one of the fastest-growing occupations includes cartographers and photogrammetrists, with wages well above the median for all occupations.

Figure 8.28.Wind turbine workers. Wind turbine service technicians are expected to see the fastest rate of employment growth in the United States by 2024. Photo by Patrizio Martorana. Stock photo ID: 374209276. Shutterstock.com.
While occupation growth rates are useful for showing expanding areas of employment, probably more important for American workers are the occupations with the most job growth in raw numbers (table 8.3). Looking at these numbers, employment prospects for the US workforce appear difficult. The largest number of new jobs by 2024 will be for personal care aides. In 2016 wages, these workers earned just 57 percent of the median for all workers. Next in line are registered nurses, who earn a healthy 139 percent of the median. Moving down the list, however, the employment picture looks grim. Home health aides, food preparation workers, and retail salespersons will see substantial growth, but wages are just 50 to 75 percent of the US median. Of the fifteen occupations with the most projected growth by 2024, eleven offer below-median wages. Only registered nurses, general and operations managers, accountants and auditors, and software developers have above-average wages and are expected to be among the jobs with the most growth.
This data indicates that future employment is heading in the direction of greater income polarization. Middle-wage manufacturing jobs will employ a smaller proportion of the US population. Most new jobs are projected to be in lower-income service sectors of the economy. Yet, as has been shown in this chapter, the geographic patterns of different service occupations will not be evenly distributed. At the urban and regional levels, places that see growth in higher-paying occupations, such as those that the creative class are attracted to, and others that can attract employers in the business services, technology, and scientific fields, will thrive. Cities and regions that cannot attract such employers are likely to see stagnant economies tied to lower-skill and low-wage services, such as home health aides caring for an elderly population, food servers, and retail employees. Within cities, economic segregation will continue to increase, with the educated and high-wage segment of the population enjoying vibrant neighborhoods, while less-educated and lower-paid residents struggle to pay rent and face long commutes from lower-cost peripheral communities.

Table 8.3.Occupations with the most job growth, 2014–24. Data source: US Bureau of Labor Statistics.
Challenges of automation
The United States produces vast amounts of agricultural and manufactured goods, yet the proportion of US workers employed in agriculture and manufacturing has been on a downward trend as machines replace human workers. As output and employment have shifted to the service sector, could the same trend follow there? Could large numbers of service workers soon find themselves replaced by machines?
Recent estimates are that 5 to 9 percent of jobs in the US and in the Paris-based Organisation for Economic Co-operation and Development (OECD), a group of mostly rich countries, could be automated in coming decades. Some of the service jobs that could soon be replaced are in warehouses, where robots are now able to find, pick, and package products for the rapidly growing online shopping sector (figure 8.29). Other jobs in retail and restaurants could be replaced with scanners, touch screen orders, and automatic payment from cell phones. In transportation, rapid progress is being made in developing autonomous vehicles, which threatens the jobs of taxi drivers, truck drivers, and anyone else who drives for a living. Work is even being done to fully automate massive ocean-going cargo ships. But it is not only lower- or middle-skilled service jobs that are threatened by automation. Computers can now accurately identify tumors in x-rays, natural language algorithms can scan legal documents, and artificial intelligence can identify patterns in data.
In recent years, artificial intelligence (AI) has made great progress. In 1997, IBM’s Deep Blue beat a reigning world chess champion. Then, in 2011, IBM’s Watson AI system beat human contestants in the TV trivia game Jeopardy. By 2016, Google’s AI beat a human player at Go, a boardgame invented in ancient China that is exponentially more complex than chess. In 2017, Facebook had to shut down an AI negotiating simulation when the two machines started to form their own language for pursuing their negotiations. As AI continues to advance, there will be pressure to use it increasingly for service tasks currently performed by humans.

Figure 8.29.Robotic arm for packing. Automation will make some services job, such as warehouse picking and packing, obsolete in the near future. Photo by wellphoto. Stock photo ID: 139813588. Shutterstock.com.
In the best-case scenario, automation in the service sector will enhance productivity, allowing people to be more effective and create more output for each hour worked. In theory, higher productivity translates to higher wages for workers. In hospitals, algorithms may help diagnose illnesses, and automated gurneys may be used to move patients from room to room. In aircraft maintenance, drones may automatically scan aircraft exteriors for wear and tear, and robots may move spare parts and install new ones. In these cases, doctors, nurses, and aircraft mechanics can be more productive as automation completes some of the routine tasks, allowing human workers to focus on more challenging and complicated ones.
The pace of automation depends on several factors. First, the technology must exist. Autonomous driving technology is advancing quickly and should be available in the consumer market in a few years. Second, the technology must be cost effective to deploy. If a technology exists but is too expensive for most firms to purchase, then it is unlikely to be used. The cost of a self-driving truck may remain high for the near future, limiting the number of truckers who are displaced. This also relates to labor markets. If an ample supply of workers is available at a reasonable cost, there may be less incentive to invest in machinery and technology. However, in cases where labor is scarce or expensive, the only option for a firm may be to switch to automation.
Challenges of inequality
The service sector faces the same challenges as agriculture and manufacturing: globalization and automation. The global outsourcing industry will continue to shift jobs to lower-cost locations if they can be done remotely without sacrificing quality. At the same time, advances in robotics and AI will replace or reshape a wide range of occupations. The risk is that these trends will further exacerbate income inequality, as those with more skills and education are able to work more productively with coworkers in other places or with robotic assistants, while those without the right skills or education become largely redundant.
Geographers and others propose myriad solutions to the growing income gap. All of them have their merits, but as with solutions to all complex issues, opinions vary greatly in the details.
Economic growth
One solution that nearly everyone agrees on is economic growth. When economies grow, the demand for workers increases. Employers hire more workers, and competition between firms drives up wages. Of course, economic growth is easier said than done, and how to promote it is beyond the scope of this book. Smart people offer widely different prescriptions for government taxation and spending, levels of regulation and deregulation, ideal levels for federal interest rates, and more. From a spatial perspective, different countries and different states have tried various mixes of these factors, yet empirically, no single combination works in all situations.
Minimum wage
Another possible, yet more controversial, solution relates to the minimum wage. Proponents argue that raising the minimum wage lifts incomes of those at the bottom of the workforce, reducing inequality and poverty. As these workers earn more, their spending spurs additional job growth through the multiplier effect. While this seems like a straightforward argument, it has many opponents. Those who oppose increasing the minimum wage say that it has the unintended consequence of reducing employment. Thus, while some workers will benefit from a higher wage, others will be worse off, since they will not have a job at all. Employers will find ways to run their business with fewer workers if labor is too expensive relative to output. Positions or hours will be cut, and the transition to automation may be accelerated.
As with economic growth, the empirical evidence on minimum wages is mixed. Some research has shown that increases in the minimum wage do not reduce employment, while others show a small decline in the number of minimum-wage jobs or a reduction in the hours that minimum wage earners work each week. Recent research in California has supported the argument in favor of raising the minimum wage, while in Seattle, Washington, some research has shown that increases have reduced the number of minimum wage jobs in that city. Most likely, the impacts depend on a variety of factors, such as the strength of the local economy and the amount of the wage increase (figure 8.30).

Figure 8.30.State minimum wage, 2017. Explore this map at https://arcg.is/0uafCb. Data source: Bureau of Labor Statistics.
Negative income tax
Another solution, supported by a wide range of policymakers and politicians, is the idea of a negative income tax. With a traditional progressive income tax, a worker pays a larger tax percentage to the government as income rises, but with a negative income tax, people who earn little receive money from the government. In essence, this type of system tops off the wages of lower-income earners. In the United States, this is done via the earned income tax credit (EITC). This credit goes to people who work yet earn below a specified annual income. In 2017, a single person with no children could receive a modest $510, but for a family with three or more children, the EITC increased to $6,318. It has bipartisan political support, since it is effective in reducing poverty (a core goal of the left), but it is also tied to work (a core value of the right). From a geographic standpoint, it is efficient in reaching lower-income workers in a wide range of places. As discussed in previous chapters, antipoverty programs have traditionally been concentrated in denser urban areas, where clusters of poverty are easy to reach. However, this often leaves the rural and suburban poor unserved by social service programs. The benefit of the EITC is that it reaches people regardless of where they live, as it is distributed via checks issued by the Internal Revenue Service.
Universal basic income
Economic growth, minimum wage increases, and negative income taxes all rest on the assumption that people work. But what if growing automation means that an increasing segment of the population becomes permanently unemployed? An idea that is being considered recently is the universal basic income, whereby all residents of a country—rich and poor, employed and unemployed—would receive a fixed monthly minimum income, of, for instance, $1,000. Some on the political left like this idea because it would reduce poverty and inequality while some on the political right like it because it could largely replace what they see as heavily bureaucratic and inefficient welfare agencies. A basic income would allow people to pursue school and risk starting businesses without having to worry about how to pay the rent and buy food. It has been pushed by some of Silicon Valley’s technology leaders, who worry that automation will increasingly replace an ever-greater share of the workforce. If that were to happen without some type of universal income, inequality could skyrocket, as the owners of firms reap a greater share of wealth with the help of robots and AI. Of course, there are also many critics who argue that a universal basic income would simply allow people to not work, becoming a burden on those who do. At least in the near future, this idea is unlikely to be implemented in any significant way, but with technological progress over the next fifty to 100 years, it may become more paramount.
Service sector unions
In the mid-1950s, 35 percent of the US workforce was in a union. For some, this was the golden age of US workers, when middle-class employment, often in manufacturing, was available to large numbers of people. But by 2016, only 10.7 percent of the workforce belonged to a union. Unionization has fallen in all industries, but those in low-wage service jobs are especially unlikely to be members of a union. If we return to the largest-growing service occupations, we can see that jobs in health-care support, such as personal care and home health aides, have lower-than-average levels of unionization, at 6.9 percent. Food preparation is even lower, with only 3.9 percent unionized. Union representation falls even more when looking at sales and related occupations, with a mere 3.1 percent unionized.
Those who support more unionization of the service sector point out that wages for union workers are higher than for their nonunion counterparts. In health-care support occupations, for example, union workers earn nearly 16 percent more, while in food preparation and serving, union workers earn close to 27 percent more. The challenge is organizing workers who are scattered geographically in different locations with different employers. Organizing a large factory with thousands of workers in the early twentieth century was much easier than trying to organize a scattered workforce.
Some states in the US are more supportive of unions than others, impacting levels of unionization (figure 8.31). Much of the South has traditionally opposed unions, seeing them as limiting the flexibility needed by firms to hire, fire, and set wages and benefits according to market conditions. By this argument, union rules can reduce competitiveness and ultimately limit economic growth.

Figure 8.31.Unionization rates, 2016. Data source: Bureau of Labor Statistics.
Ultimately, new, creative solutions will be needed to address the increasing polarization of income seen in the US and much of the world. As pointed out in this section, there are many ideas but limited consensus on how to best tackle this pressing problem.
Go to ArcGIS Online to complete exercise 8.4: “Minimum wage and unemployment.”
References
Arntz, M., T. Gregory, and U. Zierahn. 2016, “The Risk of Automation for Jobs in OECD Countries: A Comparative Analysis.” OECD Social, Employment and Migration Working Papers, no. 189. Paris: OECD Publishing. http://dx.doi.org/10.1787/5jlz9h56dvq7-en.
Bajaj, V. 2011. “A New Capital of Call Centers.” New York Times, November 25, 2011. http://www.nytimes.com/2011/11/26/business/philippines-overtakes-india-as-hub-of-call-centers.html.
Baskin, B. 2017. “Next Leap for Robots: Picking Out and Boxing Your Online Order.” Wall Street Journal, July 25, 2017. https://www.wsj.com/articles/next-leap-for-robots-picking-out-and-boxing-your-online-order-1500807601?mg=prod%2Faccounts-wsj.
Buss, D. 2014. “It’s Not About Incentives: Toyota’s Texas Move Is a Corporate-Culture Gambit.” Forbes, April 29, 2014. https://www.forbes.com/sites/dalebuss/2014/04/29/its-not-about-incentives-toyotas-texas-move-is-a-corporate-culture-gambit/#7e1fdcc736df.
Csomós, G. 2012. “Data Set 26 of the Globalization and World Cities (GaWC) Research Network.” http://www.lboro.ac.uk/gawc.
The Economist. 2017. “Why Africa’s Development Model Puzzles Economists.” The Economist, August 17, 2017. https://www.economist.com/news/finance-and-economics/21726697-structural-transformation-its-economies-not-following-precedents-why.
Florida, Richard. 2003. “Cities and the Creative Class.” Cities and Community 2, no. 1. doi: https://doi.org/10.1111/1540-6040.00034.
———. 2006. The Rise of the Creative Class and How It’s Transforming Work, Leisure, Community and Everyday Life. New York: Basic Books.
Goel, V., and P. Mozur. 2017. “Infosys, an Indian Outsourcing Company, Says It Will Create 10,000 US Jobs.” New York Times, May 2, 2017. https://www.nytimes.com/2017/05/02/business/infosys-hire-10000-american-workers.html.
Harnett, S. 2016. “Outsourced: In a Twist, Some San Francisco IT Jobs Are Moving to India.” NPR, December 27, 2016. https://www.npr.org/sections/alltechconsidered/2016/12/27/507098713/outsourced-in-a-twist-some-san-francisco-tech-jobs-are-moving-to-india.
Holmes, N., and A. Berube. 2016. “The Earned Income Tax Credit and Community Economic Stability.” Brookings, November 20, 2016. https://www.brookings.edu/articles/the-earned-income-tax-credit-and-community-economic-stability.
Hotelling, H. 1929. “Stability in Competition.” The Economic Journal 39, no. 153: 41−57. doi: https://doi.org/10.2307/2224214.
Kitroeff, N. 2017. “What Will a Higher Minimum Wage Do? Two New Studies Have Different Ideas.” Los Angeles Times, January 11, 2017. http://www.latimes.com/business/la-fi-impact-minimum-wage-20170110-story.html.
Lohr, S. 2017. “Hot Spot for Tech Outsourcing: The United States.” New York Times, July 30, 2017. https://www.nytimes.com/2017/07/30/technology/hot-spot-for-tech-outsourcing-the-united-states.html?_r=0.
Manyika, James, Michael Chui, Mehdi Miremadi, Jacques Bughin, Katy George, Paul Willmott, and Martin Dewhurst. 2017. Harnessing Automation for a Future That Works. McKinsey & Company. https://www.mckinsey.com/global-themes/digital-disruption/harnessing-automation-for-a-future-that-works.
Paris, C. 2017. “Norway Takes Lead in Race to Build Autonomous Cargo Ships.” Wall Street Journal, October 12, 2017. https://www.wsj.com/articles/norway-takes-lead-in-race-to-build-autonomous-cargo-ships-1500721202.
US Bureau of Labor Statistics. 2017. “Industries at a Glance: NAICS Code Index.” https://www.bls.gov/iag/tgs/iag_index_naics.htm.
———. “Employment Projections and Occupational Outlook Handbook.” Press release. https://www.bls.gov/news.release/ecopro.toc.htm.
———. “Union Membership.” Press release. https://www.bls.gov/news.release/union2.toc.htm.
Witsil, F. 2014. “Call Center Jobs Increase as More Return from Overseas.” USA Today, August 4, 2014. https://www.usatoday.com/story/money/business/2014/08/04/call-center-jobs-overseas/13560107.